kube-scheduler is the default scheduler in a Kubernetes cluster. It assigns pods to nodes based on resource availability and scheduling constraints. This topic covers the metrics, dashboard panels, and anomaly troubleshooting for kube-scheduler.
Prerequisites
Before you begin, ensure that you have:
-
Access to the kube-scheduler dashboard. For setup instructions, see View the dashboards for control plane components.
Metrics
The following table lists the metrics exposed by kube-scheduler.
| Metric | Type | Description |
|---|---|---|
scheduler_scheduler_cache_size |
Gauge | Number of nodes, pods, and AssumedPods (pods assumed to be scheduled) in the scheduler cache. |
scheduler_pending_pods |
Gauge | Number of pending pods by queue type: unschedulable (pods that cannot be scheduled), backoff (pods in backoffQ temporarily blocked), active (pods in activeQ ready to be scheduled). |
scheduler_pod_scheduling_attempts_bucket |
Histogram | Number of attempts to successfully schedule a pod. Bucket thresholds: {1, 2, 4, 8, 16}. |
memory_utilization_byte |
Gauge | Memory usage in bytes. |
cpu_utilization_core |
Gauge | CPU usage in cores. |
rest_client_requests_total |
Counter | Number of HTTP requests, broken down by status code, method, and host. |
rest_client_request_duration_seconds_bucket |
Histogram | HTTP request latency, broken down by verb and URL. |
The following metrics are deprecated. Remove any alerts and monitoring that depend on them.
-
cpu_utilization_ratio: CPU utilization -
memory_utilization_ratio: Memory usage
Dashboard guide
The dashboard is built from kube-scheduler metrics and Prometheus Query Language (PromQL) queries. It has three panels: Overview, Resource, and Kube API.
Overview

| Metric | PromQL | Description |
|---|---|---|
| Scheduler Pending Pods | scheduler_pending_pods{job="ack-scheduler"} |
Number of pending pods by queue type (unschedulable, backoff, active). |
| Scheduler Pod Scheduling Attempts | histogram_quantile($quantile, sum(rate(scheduler_pod_scheduling_attempts_bucket{job="ack-scheduler"}[$interval])) by (pod, le)) |
Number of scheduling attempts per pod. Bucket thresholds: {1, 2, 4, 8, 16}. |
| Scheduler Cache Statistics | scheduler_scheduler_cache_size{job="ack-scheduler",type="nodes"} / type="pods" / type="assumed_pods" |
Number of nodes, pods, and AssumedPods in the scheduler cache. |
Resource

| Metric | PromQL | Description |
|---|---|---|
| Memory Usage | memory_utilization_byte{container="kube-scheduler"} |
Memory usage in bytes. |
| CPU Usage | cpu_utilization_core{container="kube-scheduler"}*1000 |
CPU usage in millicores. |
Kube API

| Metric | PromQL | Description |
|---|---|---|
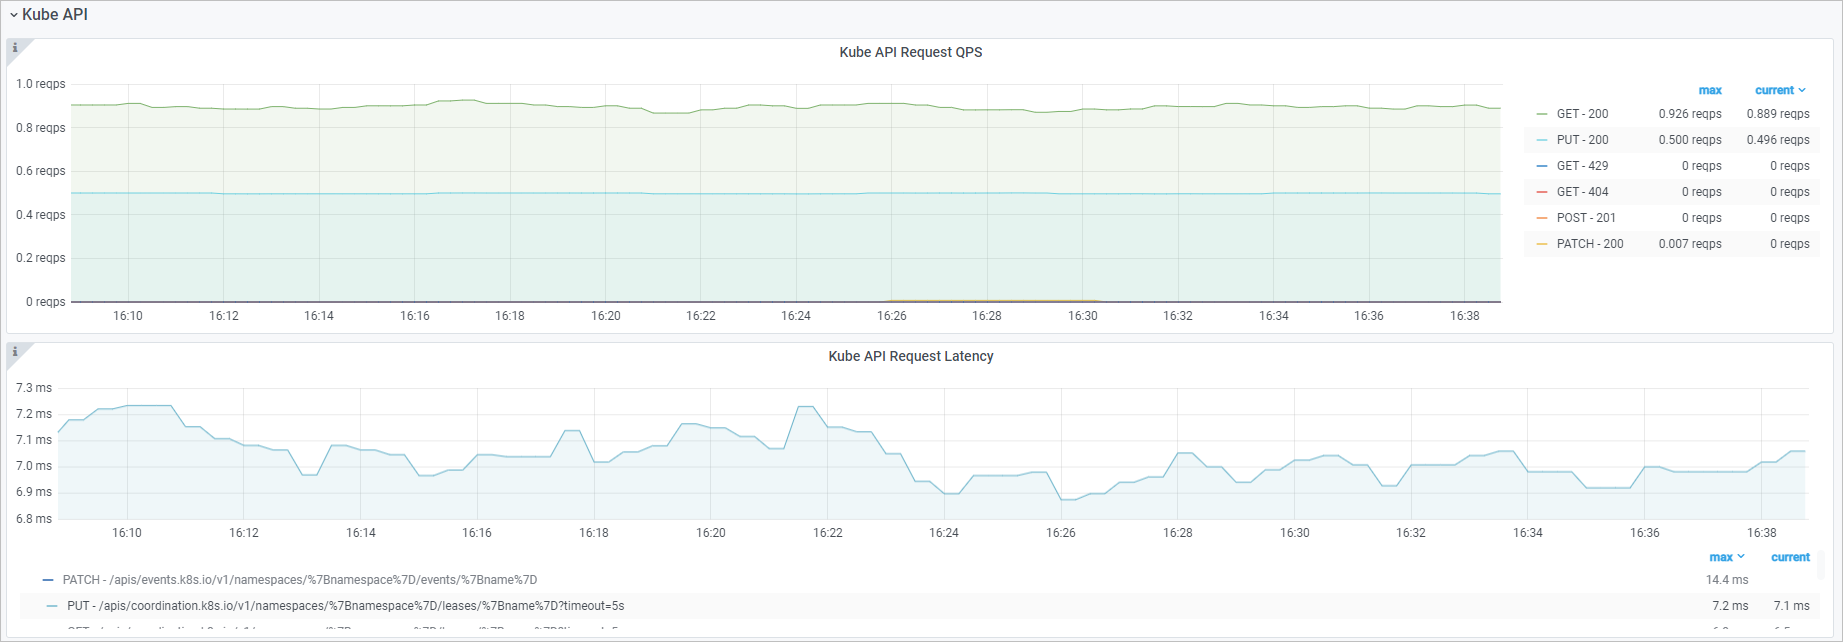
| Kube API Request QPS | sum(rate(rest_client_requests_total{job="ack-scheduler",code=~"2.."}[$interval])) by (method,code) (repeated for 3xx, 4xx, 5xx) |
HTTP requests from kube-scheduler to kube-apiserver, broken down by method and status code. |
| Kube API Request Latency | histogram_quantile($quantile, sum(rate(rest_client_request_duration_seconds_bucket{job="ack-scheduler"}[$interval])) by (verb,url,le)) |
Latency of HTTP requests from kube-scheduler to kube-apiserver, broken down by verb and URL. |
Common metric anomalies
Use this section to determine whether a metric deviation is expected and how to investigate it.
Scheduler availability
This check determines whether kube-scheduler is running. Investigate availability issues before looking at performance metrics.
| Normal | Abnormal | What it means | What to do |
|---|---|---|---|
| At least 1 active scheduler pod is running. | 0 active scheduler pods. | No scheduler is available to assign pods to nodes. | Check whether the Deployment or StatefulSet for kube-scheduler exists. Determine whether the pod went offline due to a planned manual operation. |
Pending pods
| Normal | Abnormal | What it means | What to do |
|---|---|---|---|
| Scheduling throughput is stable and the pending count stays low. | Pods in the unschedulable queue keep increasing, or do not decrease after other pods are scheduled. | Pod resource requests are misconfigured, or node resources are insufficient. | Check whether node resources meet the pod's requirements. Check whether the pod has node affinity rules that cannot be satisfied. |
Scheduling attempts per pod
| Normal | Abnormal | What it means | What to do |
|---|---|---|---|
| A pod is scheduled within a few attempts. | A pod remains unscheduled after many attempts. | Pod resource requests are misconfigured, or node resources are insufficient. | Check whether node resources meet the pod's requirements. Check whether the pod has node affinity rules that cannot be satisfied. |
What's next
For metrics, dashboards, and anomaly troubleshooting for other control plane components, see: