Use etcd metrics and dashboard panels to detect and diagnose control plane issues in ACK clusters.
Before you begin
Access
See View monitoring dashboards for control plane components.
List of metrics
The following table lists etcd component metrics.
|
Metric |
Type |
Description |
|
cpu_utilization_core |
Gauge |
CPU usage, in cores. |
|
etcd_server_has_leader |
Gauge |
In the Raft consensus algorithm, one etcd member is elected as leader. The leader sends periodic heartbeats to maintain cluster stability. Indicates whether a leader exists among etcd members.
|
|
etcd_server_is_leader |
Gauge |
Indicates whether this etcd member is the leader.
|
|
etcd_server_leader_changes_seen_total |
Counter |
Total leader changes observed by this etcd member. |
|
etcd_mvcc_db_total_size_in_bytes |
Gauge |
The total size of the etcd member database. |
|
etcd_mvcc_db_total_size_in_use_in_bytes |
Gauge |
The used size of the etcd member database. |
|
etcd_disk_backend_commit_duration_seconds_bucket |
Histogram |
Time for a data change to be written to backend storage and committed. The bucket boundaries are |
|
etcd_debugging_mvcc_keys_total |
Gauge |
The total number of keys stored in etcd. |
|
etcd_server_proposals_committed_total |
Gauge |
In Raft, state changes are submitted as proposals. Total proposals committed to the Raft log. |
|
etcd_server_proposals_applied_total |
Gauge |
Total applied proposals. |
|
etcd_server_proposals_pending |
Gauge |
Number of pending proposals. |
|
etcd_server_proposals_failed_total |
Counter |
Number of failed proposals. |
|
memory_utilization_byte |
Gauge |
Memory usage, in bytes. |
|
resource_utilization_level |
Gauge |
Resource utilization level.
|
The following resource utilization metrics are no longer in use. Remove any alerts or monitoring rules that rely on these metrics:
cpu_utilization_ratio: CPU utilization.
memory_utilization_ratio: Memory utilization.
Dashboard guide
The dashboard uses PromQL queries to visualize etcd metrics.
Dashboard overview
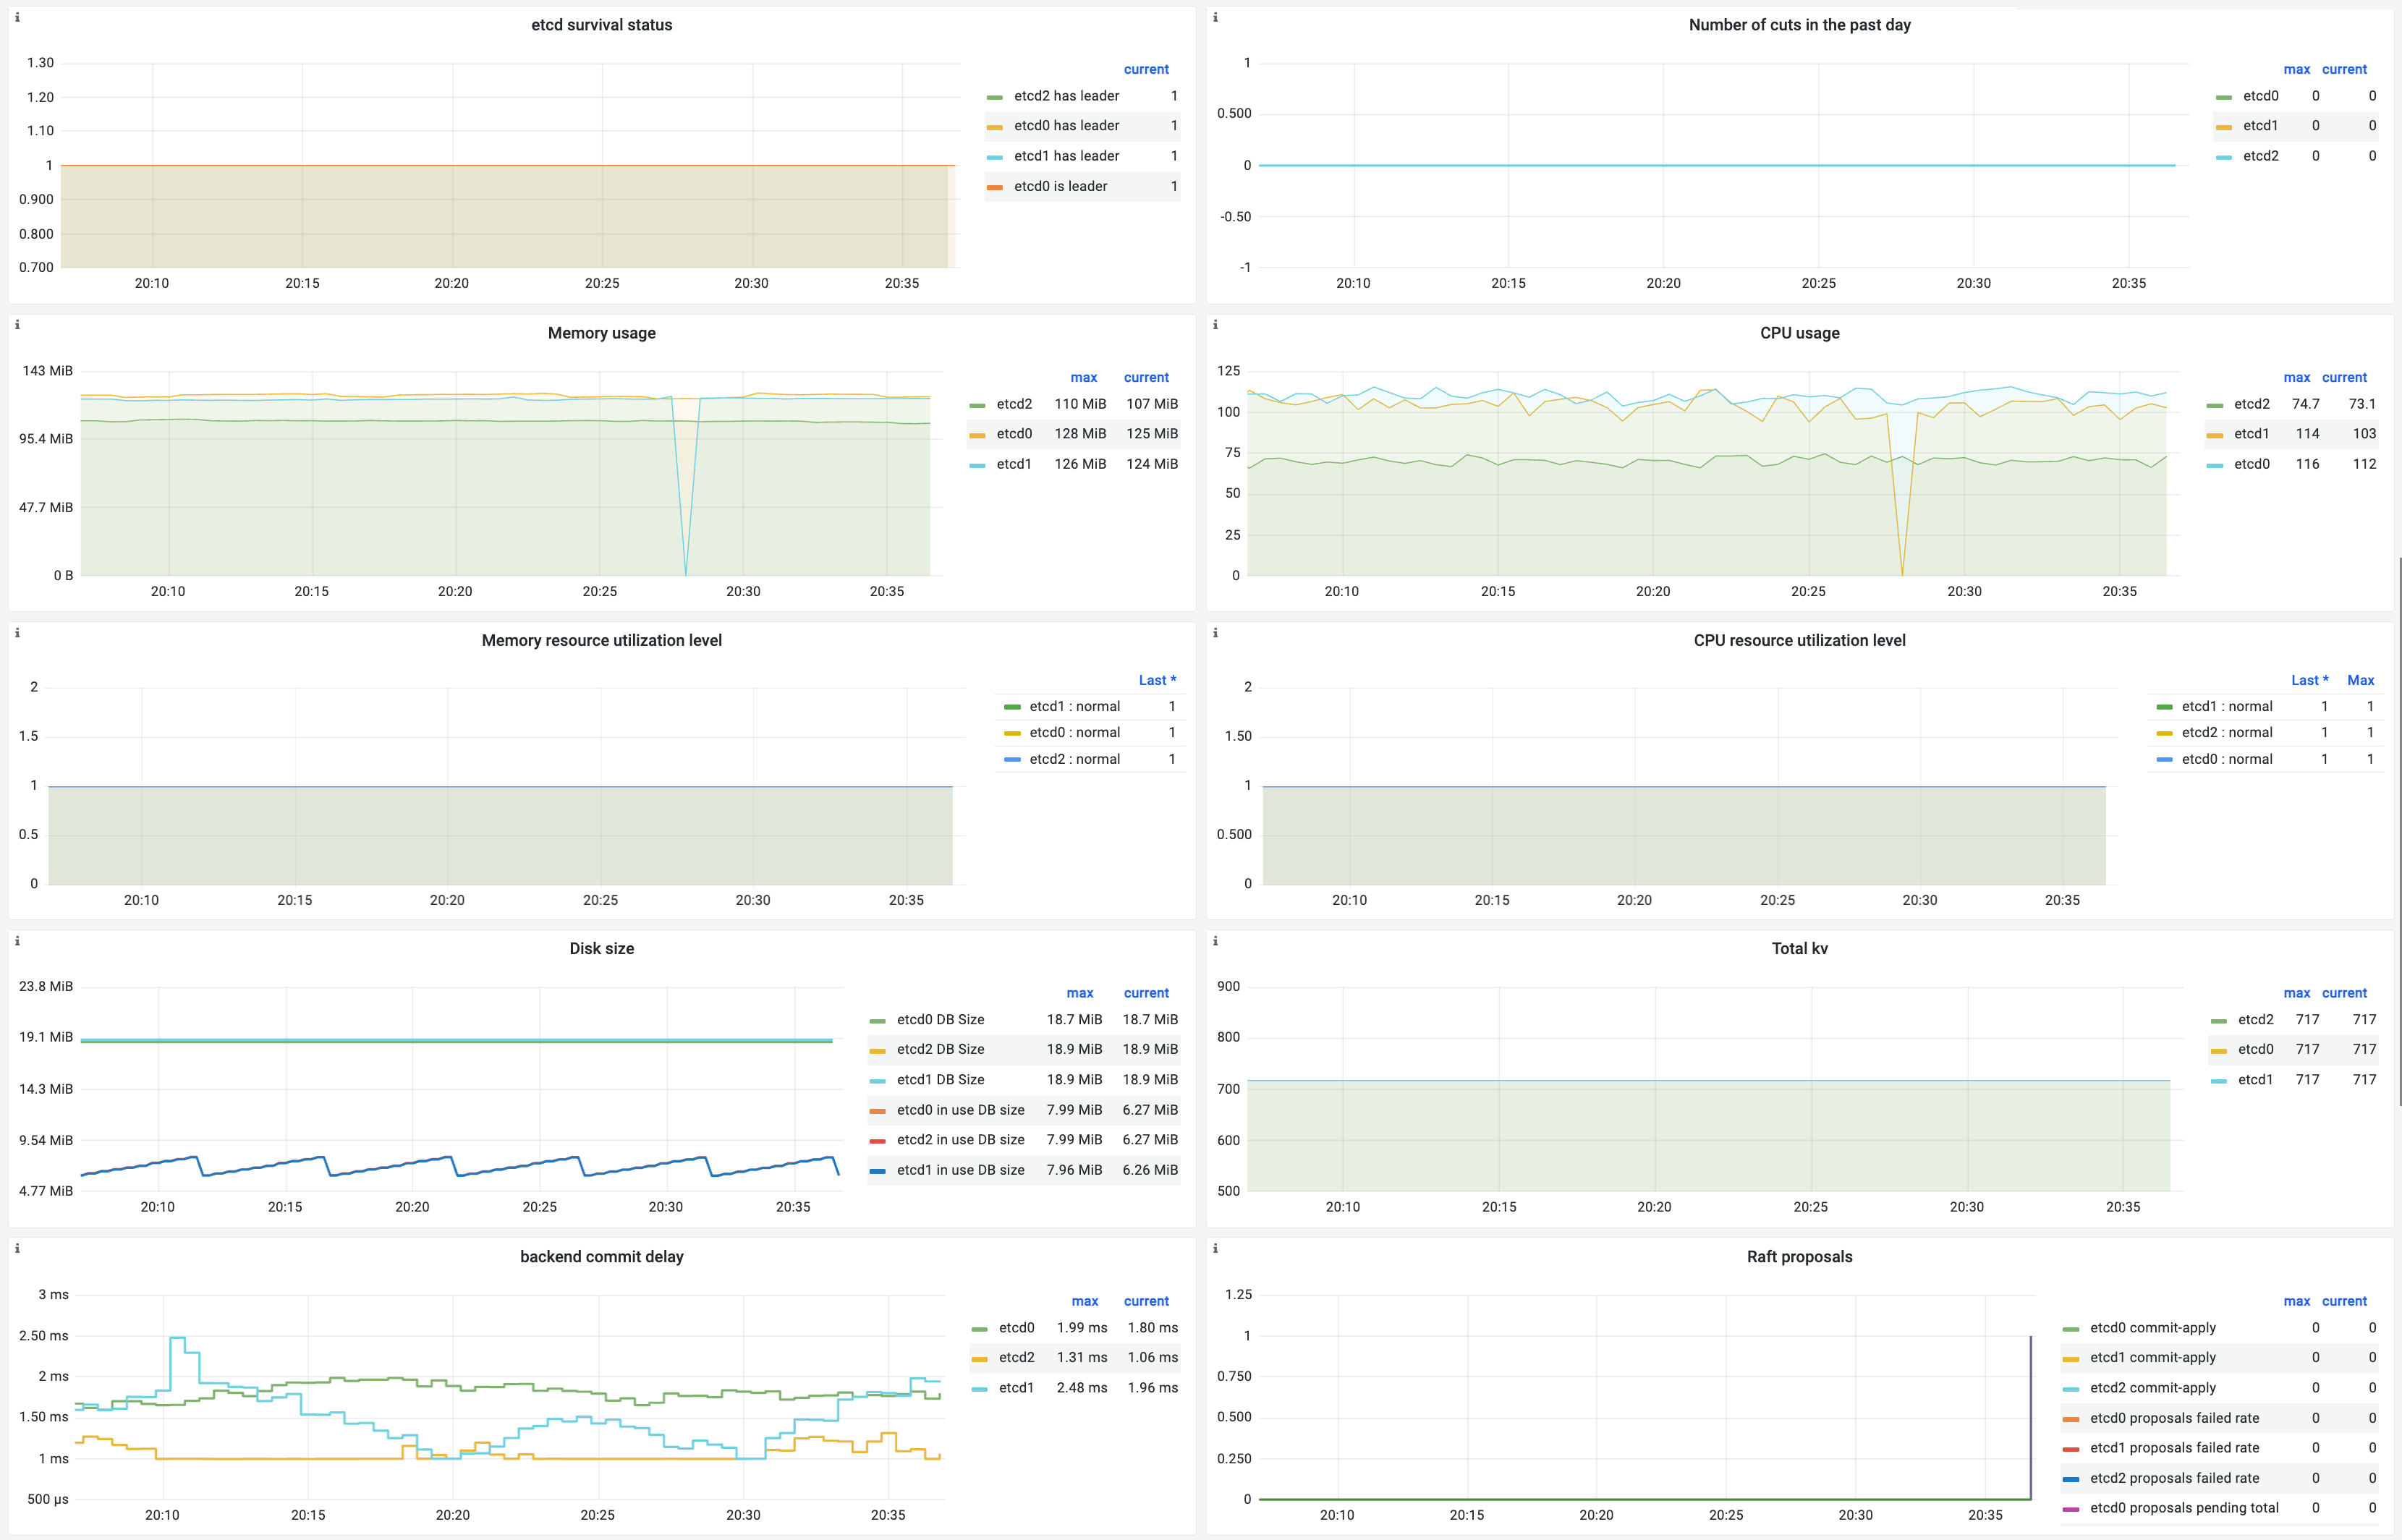
Panel descriptions
|
Parameter |
PromQL |
Description |
|
etcd liveness status |
|
|
|
Leader changes in the last day |
|
Number of etcd leader changes over the last day. |
|
Memory usage |
|
Memory usage, in bytes. |
|
CPU usage |
|
CPU usage, in millicores. |
|
Memory usage level |
|
|
|
CPU usage level |
|
|
|
Disk size |
etcd_mvcc_db_total_size_in_bytes |
The total size of the etcd backend database. |
|
etcd_mvcc_db_total_size_in_use_in_bytes |
The used size of the etcd backend database. |
|
|
Total key-value pairs |
etcd_debugging_mvcc_keys_total |
The total number of key-value pairs in the etcd cluster. |
|
Backend commit latency |
|
The time required to persist a proposal in the etcd database. |
|
Raft proposal status |
|
The rate of failed Raft proposals per minute. |
|
|
The total number of pending Raft proposals. |
|
|
|
Number of committed but unapplied proposals. |
Common metric anomalies
etcd liveness status
|
Normal case |
Abnormal case |
Description |
|
All three etcd members have a leader, and one must be the leader: |
A single member is abnormal. |
The corresponding |
|
More than one member is abnormal. |
Multiple members report Also check whether any member has |
Backend commit latency
|
Normal case |
Abnormal case |
Description |
|
The latency is typically between a few and tens of milliseconds. |
Sustained latency of hundreds of milliseconds or more. |
Indicates disk I/O issues. |
Raft proposal anomalies
|
Normal case |
Abnormal case |
Description |
|
The rate of failed Raft proposals is 0. |
The rate of failed Raft proposals is greater than 0. |
Some proposals fail to commit. Investigate high failure rates. |
|
The total number of pending Raft proposals is 0. |
A non-zero number of pending Raft proposals persists. |
Backlog of Raft proposals, often caused by slow apply speed. Correlate with backend commit latency. |
|
The gap between committed and applied Raft proposals is 0. |
The gap between committed and applied proposals is greater than 0. |
May indicate excessive client request volume on etcd. If this value exceeds 5000, etcd rejects requests with |
References
See Monitoring metrics for kube-apiserver, Monitoring metrics for kube-scheduler, Monitoring metrics for kube-controller-manager, and Monitoring metrics for cloud-controller-manager.