View kube-controller-manager workqueue, resource, and Kube API metrics with the monitoring dashboard.
Key concepts
Workqueue
Before you begin
Access the dashboard
See View monitoring dashboards for cluster control plane components.
Metric list
The following table lists
|
Metric |
Type |
Description |
|
workqueue_adds_total |
Counter |
Total events added to the |
|
workqueue_depth |
Gauge |
Current |
|
workqueue_queue_duration_seconds_bucket |
Histogram |
Time an item waits in the |
|
memory_utilization_byte |
Gauge |
Memory utilization. Unit: bytes. |
|
cpu_utilization_core |
Gauge |
CPU utilization. Unit: cores. |
|
resource_utilization_level |
Gauge |
Resource utilization level.
|
|
rest_client_requests_total |
Counter |
Total HTTP requests by status code, method, and host. |
|
rest_client_request_duration_seconds_bucket |
Histogram |
HTTP request latency by verb and URL. |
The following resource utilization metrics are no longer in use. Remove any alerts or monitoring rules that rely on these metrics:
cpu_utilization_ratio: CPU utilization.
memory_utilization_ratio: Memory utilization.
Dashboard usage
Configure the request quantile and PromQL sampling interval on the dashboard. The following sections describe each chart and its PromQL query.
Workqueue
Dashboard view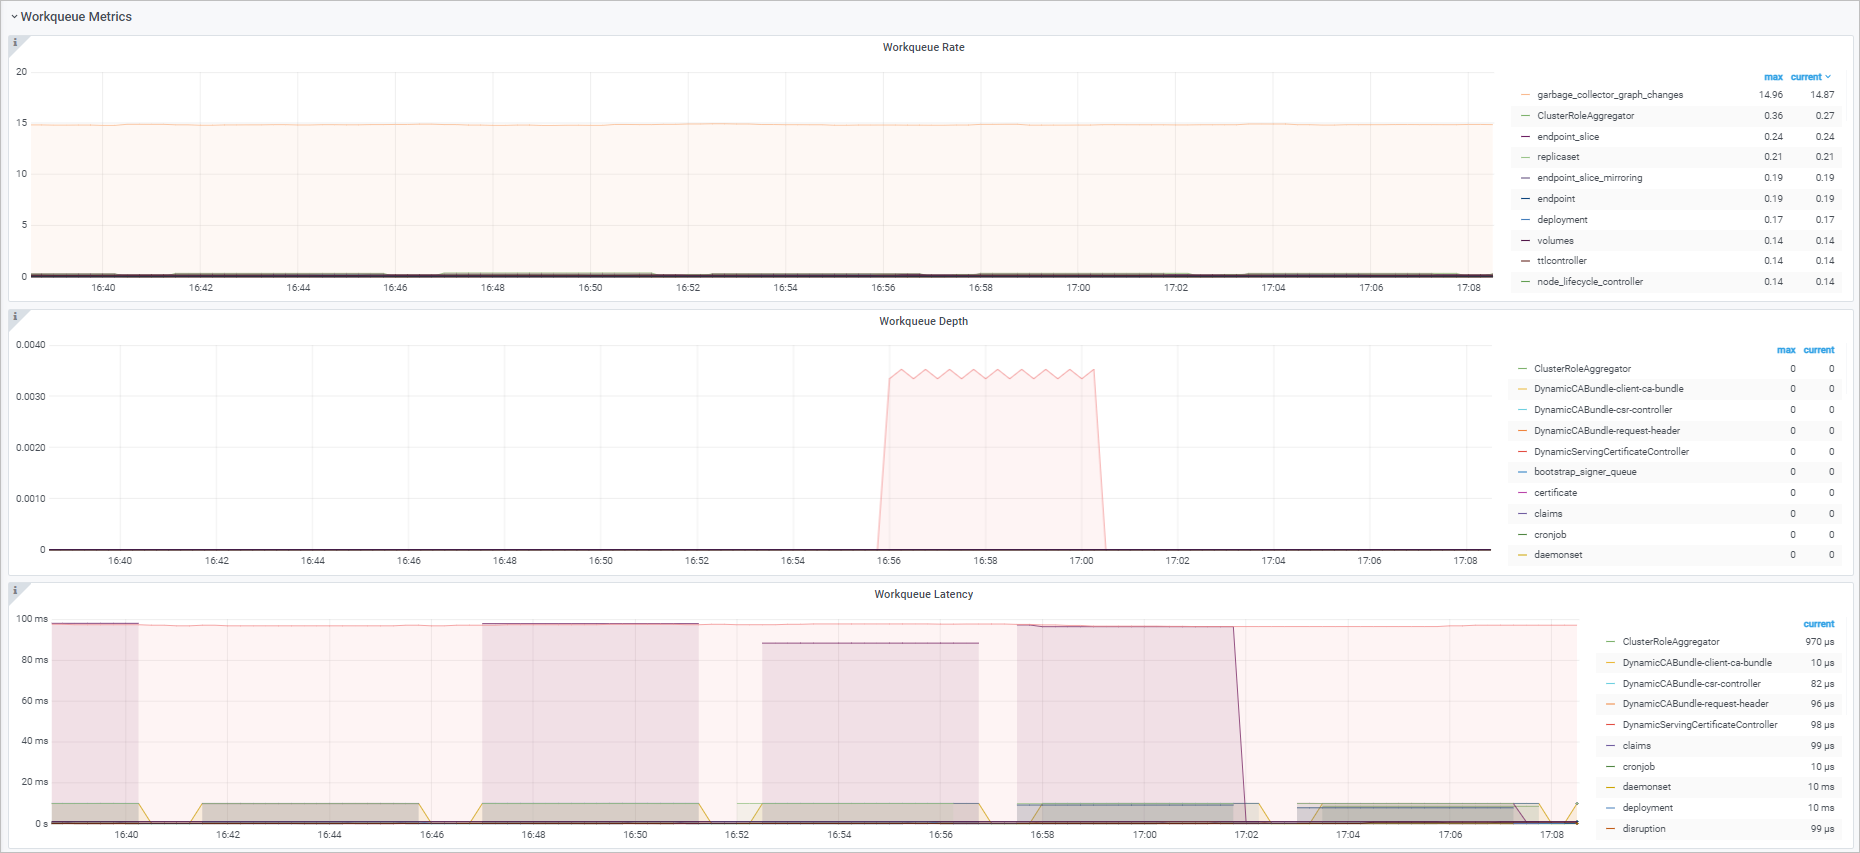
Charts
|
Name |
PromQL |
Description |
|
Workqueue Add Rate |
sum(rate(workqueue_adds_total{job="ack-kube-controller-manager"}[$interval])) by (name) |
Rate of events added to the |
|
Workqueue Depth |
sum(rate(workqueue_depth{job="ack-kube-controller-manager"}[$interval])) by (name) |
Average rate of change in |
|
Workqueue Processing Latency |
histogram_quantile($quantile, sum(rate(workqueue_queue_duration_seconds_bucket{job="ack-kube-controller-manager"}[5m])) by (name, le)) |
Time an item waits in the |
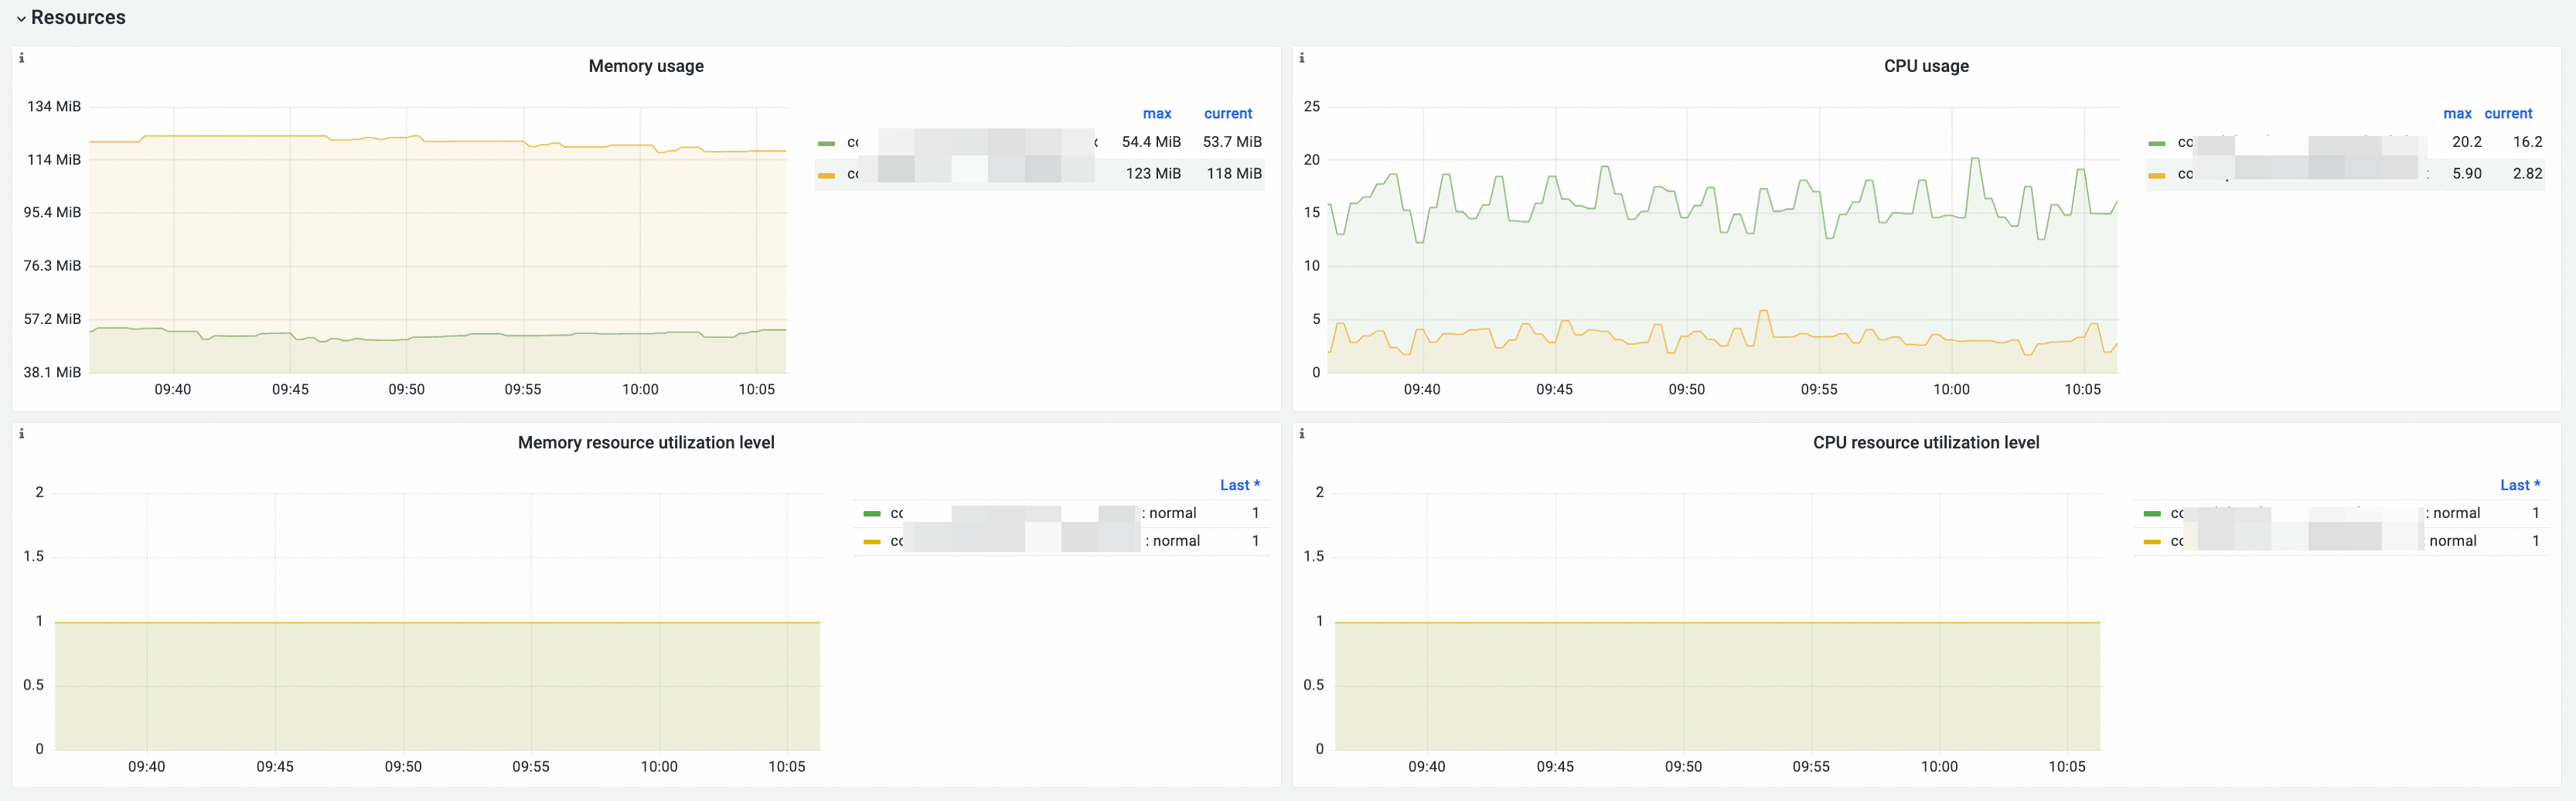
Resources
Dashboard view
Charts
|
Chart name |
PromQL |
Description |
|
Memory Utilization |
memory_utilization_byte{container="kube-controller-manager"} |
Memory utilization. Unit: bytes. |
|
CPU Utilization |
cpu_utilization_core{container="kube-controller-manager"}*1000 |
CPU utilization. Unit: millicore. |
|
Memory Resource Utilization Level |
|
|
|
CPU Resource Utilization Level |
|
Kube API
Dashboard view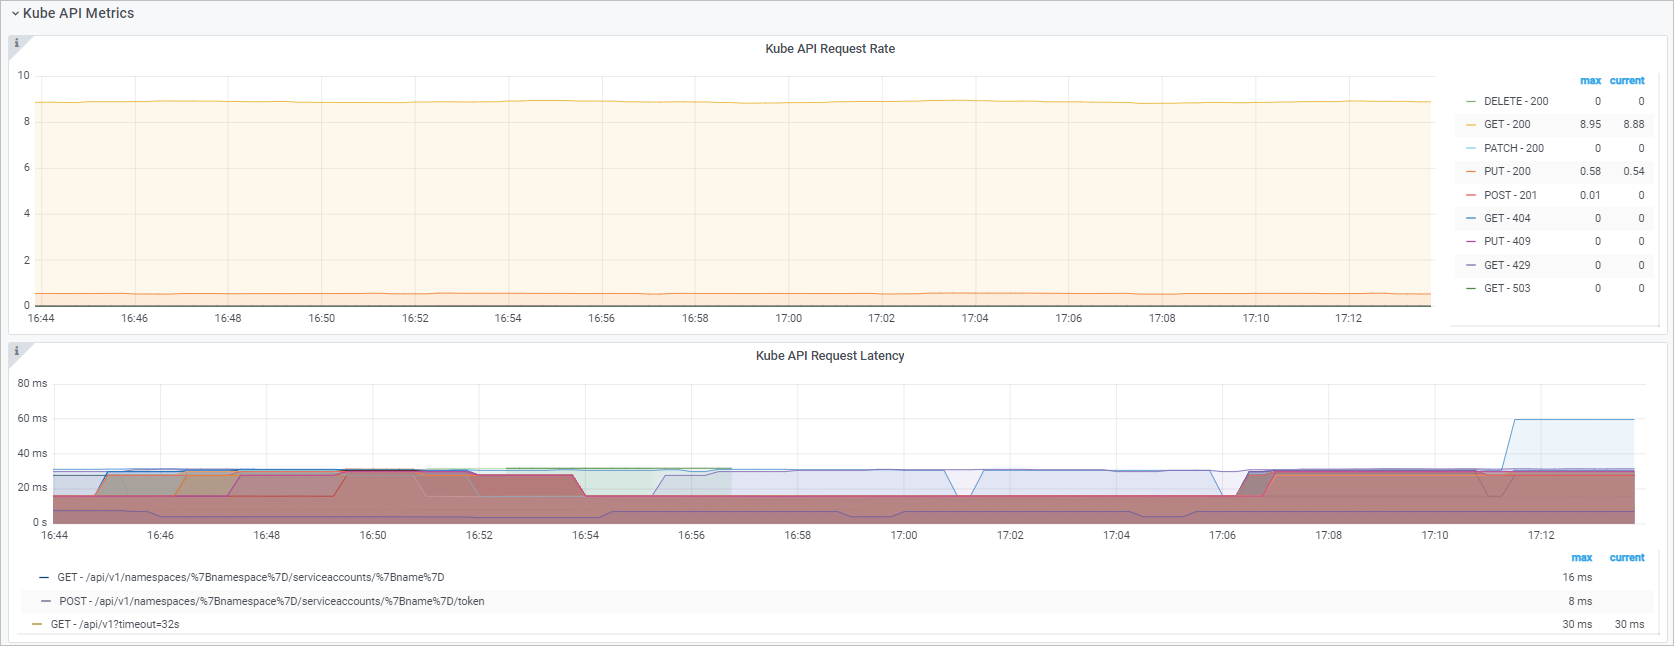
Charts
|
Chart name |
PromQL |
Description |
|
Kube API Request QPS |
|
QPS of HTTP requests from kube-controller-manager to kube-apiserver, by method and status code. |
|
Kube API Request Latency |
histogram_quantile($quantile, sum(rate(rest_client_request_duration_seconds_bucket{job="ack-kube-controller-manager"}[$interval])) by (verb,url,le)) |
Latency of HTTP requests from kube-controller-manager to kube-apiserver, by verb and URL. |
References
For metrics and dashboards of other control plane components, see Monitoring metrics for the kube-apiserver component, Monitoring metrics for the etcd component, Monitoring metrics for the kube-scheduler component, and Monitoring metrics for the cloud-controller-manager component.