The cloud-controller-manager add-on lets Kubernetes core components interact with the cloud provider through the Kubernetes API. This topic lists its metrics, explains how to use the monitoring dashboards, and analyzes common metric anomalies.
Before you begin
Access the dashboards
See View monitoring dashboards for control plane components.
Metric list
The cloud-controller-manager component exposes the following metrics.
Metric | Type | Description |
ccm_slb_latency_ms | Histogram | Classic Load Balancer (CLB) synchronization latency. Unit: ms. Bucket thresholds: |
ccm_node_latency_ms | Histogram | Node synchronization latency. Unit: ms. Bucket thresholds: |
ccm_route_latency_ms | Histogram | Route synchronization latency. Unit: ms. Bucket thresholds: |
workqueue_adds_total | Counter | Total events added to the |
workqueue_depth | Gauge | Current |
workqueue_queue_duration_seconds_bucket | Histogram | Time an item waits in the |
memory_utilization_byte | Gauge | Memory utilization. Unit: bytes. |
cpu_utilization_core | Gauge | CPU utilization. Unit: cores. |
resource_utilization_level | Gauge | Resource utilization level.
|
rest_client_requests_total | Counter | Total HTTP requests by status code, method, and host. |
rest_client_request_duration_seconds_bucket | Histogram | HTTP request latency by verb and URL. |
The following resource utilization metrics are no longer in use. Remove any alerts or monitoring rules that rely on these metrics:
cpu_utilization_ratio: CPU utilization.
memory_utilization_ratio: Memory utilization.
Dashboards
PromQL-based panels visualize the component metrics.
CCM
Observability display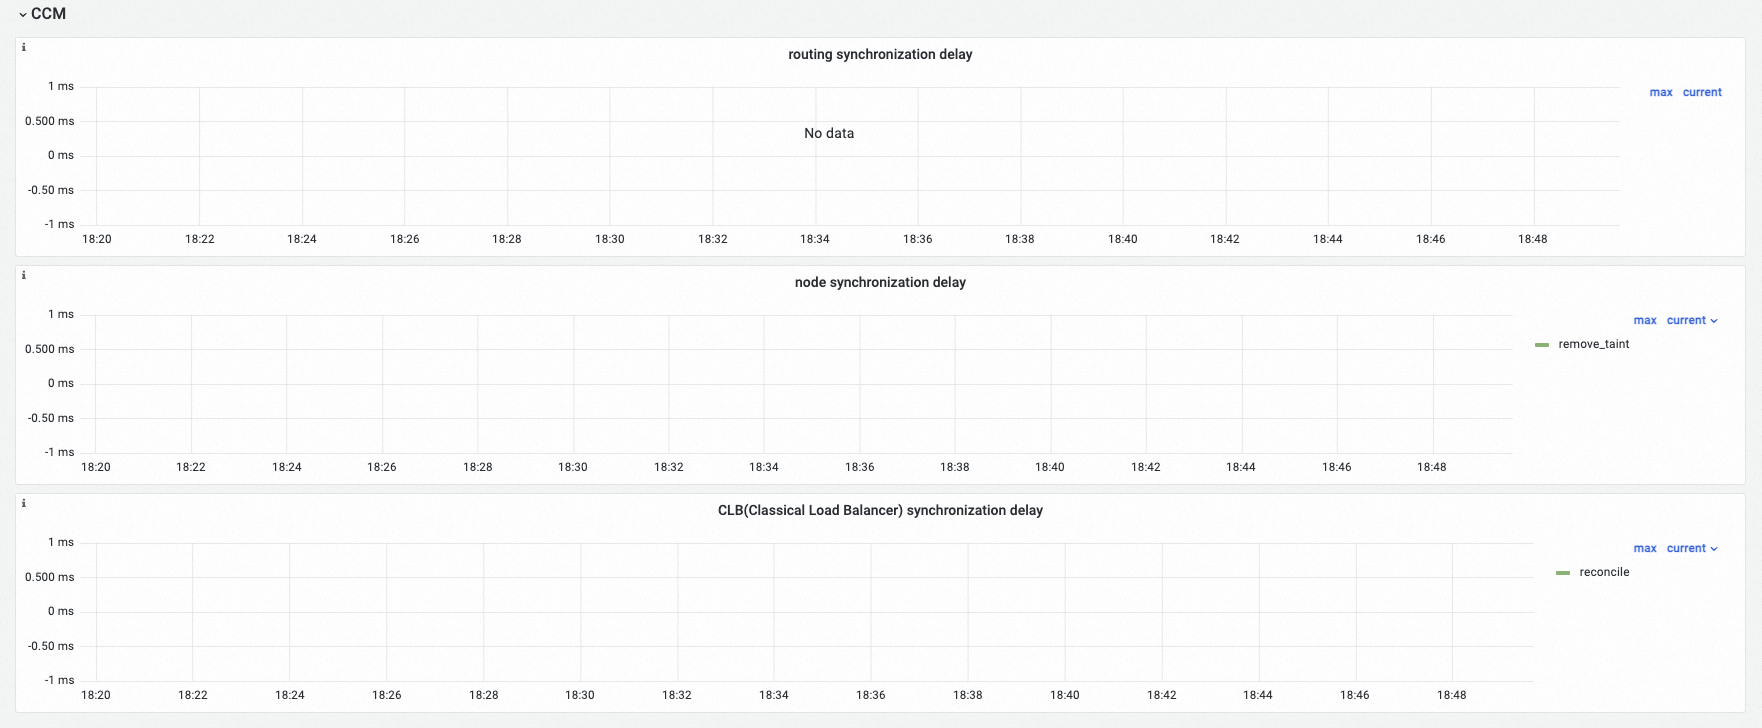
Panel details
Panel name | PromQL | Description |
Route synchronization latency | histogram_quantile($quantile, sum(rate(ccm_route_latencies_duration_milliseconds_bucket[$interval])) by (verb, le)) | Route synchronization latency. Unit: ms. |
Node synchronization latency | histogram_quantile($quantile, sum(rate(ccm_node_latencies_duration_milliseconds_bucket[$interval])) by (verb, le)) | Node synchronization latency. Unit: ms. |
CLB (Classical Load Balancer) Synchronization Latency | histogram_quantile($quantile, sum(rate(ccm_slb_latencies_duration_milliseconds_bucket[$interval])) by (verb, le)) | CLB synchronization latency. Unit: ms. |
Queue
Observability display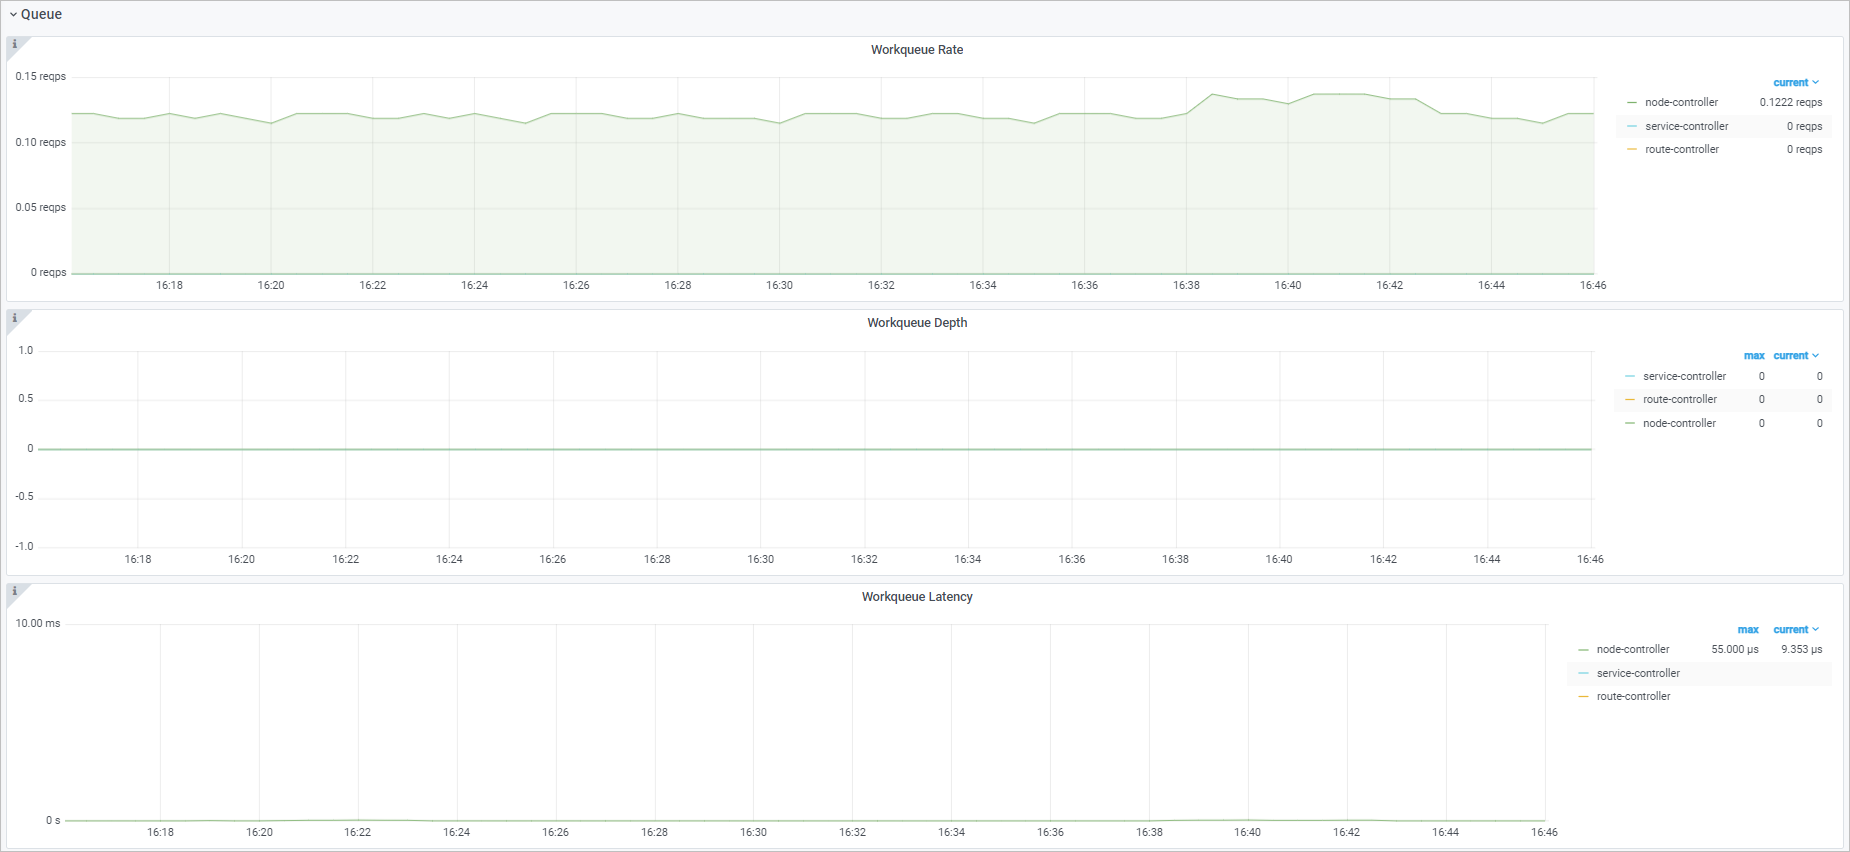
Panel details
Panel name | PromQL | Description |
Workqueue add rate | sum(rate(workqueue_adds_total{job="ack-cloud-controller-manager"}[$interval])) by (name) | Rate of events added to the |
Workqueue depth | workqueue_depth{job="ack-cloud-controller-manager"} | Average rate of change in |
Workqueue processing latency | histogram_quantile($quantile, sum(rate(workqueue_queue_duration_seconds_bucket{job="ack-cloud-controller-manager"}[$interval])) by (name, le)) | Time an item waits in the |
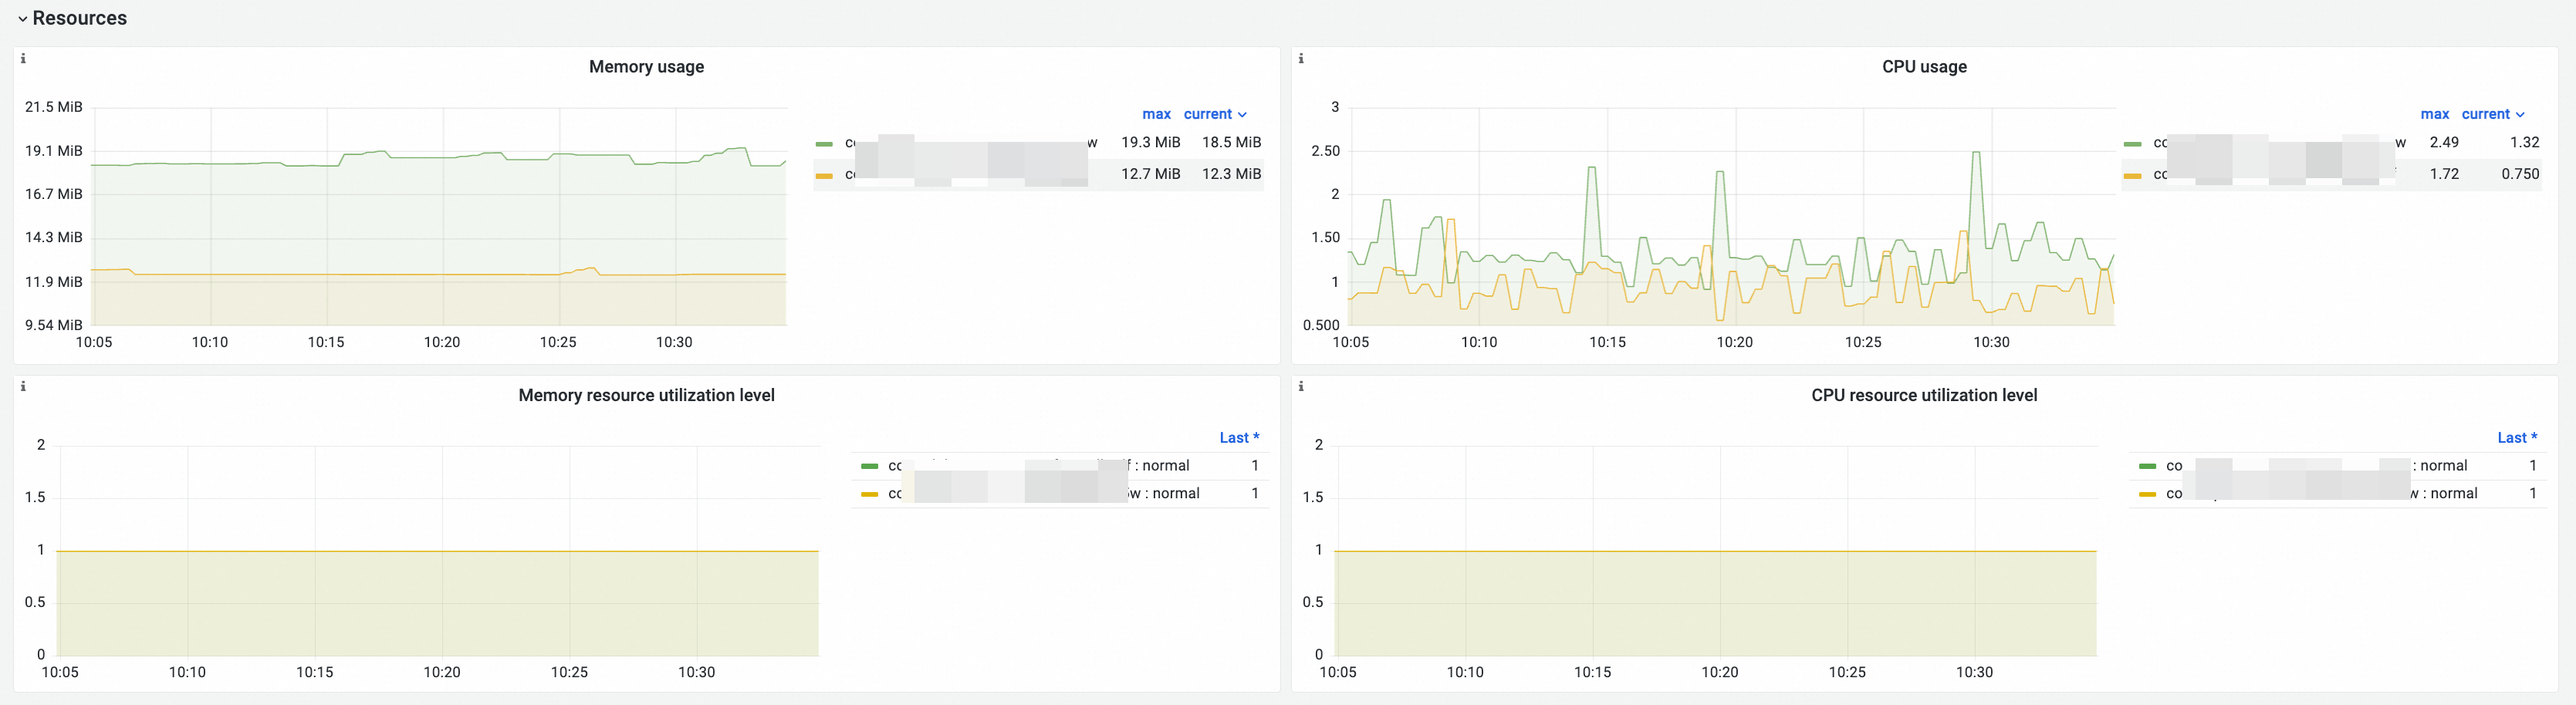
Resources
Observability display
Panel details
Panel name | PromQL | Description |
Memory usage | memory_utilization_byte{container="cloud-controller-manager"} | Memory utilization. Unit: bytes. |
CPU Usage | cpu_utilization_core{container="cloud-controller-manager"}*1000 | CPU utilization. Unit: millicore. |
Memory utilization level |
|
|
CPU utilization level |
|
Kube API
Observability display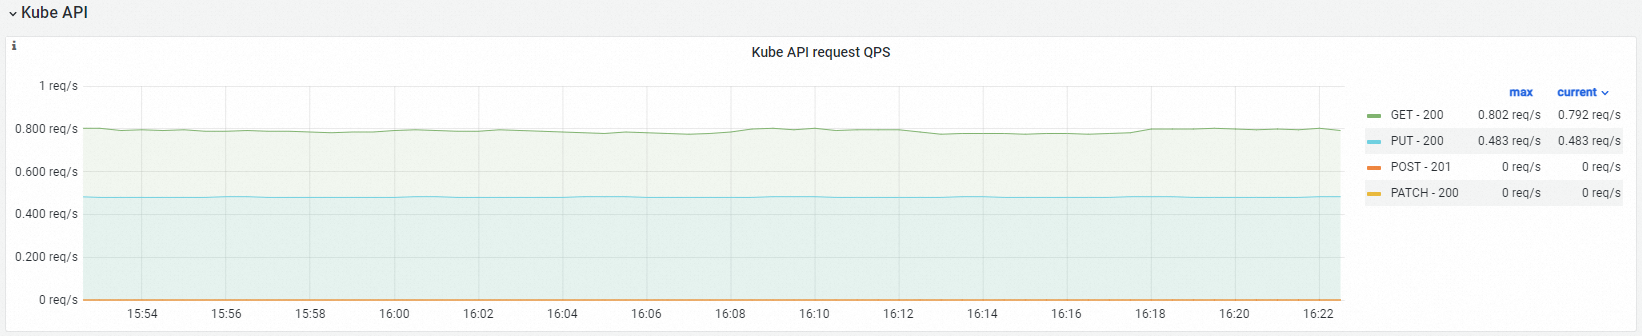
Panel details
Panel name | PromQL | Description |
Kube API request QPS |
| HTTP request QPS from cloud-controller-manager to kube-apiserver, by method and status code. |
Common metric anomalies
Classic Load Balancer (CLB) synchronization latency
Normal conditions | Abnormal conditions | Description | Recommendations |
The synchronization latency of CLB (Classical Load Balancer) is ≤ 10 s. | The synchronization latency of CLB (Classical Load Balancer) exceeds 10 s. | CLB synchronization is taking too long. | Check the Service for abnormal events. |
Workqueue depth
Normal conditions | Abnormal conditions | Description | Recommendations |
The workqueue depth is ≤ 10. | The workqueue depth exceeds 10. | Large backlog of items awaiting synchronization. | An overly long queue slows Service synchronization. Reduce the frequency of changes to nodes, Pods, and Services in the cluster. |
Related documentation
For other control plane components, see kube-apiserver monitoring metrics, etcd monitoring metrics, kube-scheduler monitoring metrics, and kube-controller-manager monitoring metrics.