Managed Service for OpenTelemetry gives you end-to-end visibility into requests flowing through your microservices. By enabling Xtrace in AlbConfig, ALB attaches trace IDs to every request at the ingress layer — so you can correlate access logs with distributed traces without instrumenting each service individually.
Prerequisites
Before you begin, ensure that you have:
-
ALB Ingress Controller installed on your cluster, version 2.11.1 or later
-
ACK consoleACK consoleNew clusters: On the Component Configuration page during cluster creation, select ALB Ingress in the Ingress field. For more information, see Create an ACK managed cluster, Create an ACK dedicated cluster (new cluster creation is discontinued), or Create an ACK serverless cluster.
-
Existing clusters: See Manage components to install or upgrade the component.
-
-
(Conditional) For ACK dedicated clusters: ALB Ingress Controller granted the required access permissions. See Grant the ALB Ingress Controller access permissions to an ACK dedicated cluster.
-
Managed Service for OpenTelemetry activated. Activate Managed Service for OpenTelemetry now
How it works
When a request enters the ALB listener, ALB generates a trace ID and injects it into the request headers using the Zipkin sampling algorithm. The request, together with its trace ID, is forwarded to the backend service. Access logs for each request — including the trace ID — are written to a Simple Log Service (SLS) Logstore. Managed Service for OpenTelemetry reads these logs and reconstructs the full trace, which you can then view in the OpenTelemetry console.
Xtrace is configured at the listener level in AlbConfig. The sampling rate applies uniformly to all traffic on that listener.
Enable Xtrace for ALB Ingress
Step 1: Enable Simple Log Service for the cluster
Enable Simple Log Service for your cluster. After enabling, the cluster automatically creates an SLS project. For instructions, see Collect logs from ACK cluster containers.
Step 2: Get the SLS project ID
-
Log on to the ACK console and click Clusters in the left navigation pane.
-
Click the name of your cluster, then click Cluster Information in the left navigation pane.
-
On the Basic Information tab, copy the value from the Simple Log Service Project field. You will use this ID in the next step.
Step 3: Create an AlbConfig
The AlbConfig creates an ALB instance with Simple Log Service access logs enabled and Xtrace configured on the listener.
-
Create
alb-test.yamlwith the following content:You can only modify Xtrace settings after Simple Log Service access logs are enabled on the ALB instance. If you are reusing an existing ALB instance, set
forceOverride: trueunderspec.configto overwrite its existing properties. See Reuse an existing ALB instance.For instructions on creating a vSwitch, see Create and manage vSwitches.
Xtrace parameter reference
Parameter Description Default Range tracingEnabledEnables Xtrace on the listener falsetrue/falsetracingSampleSampling rate. 10000 = 100%, 5000 = 50%, 1 = 0.01% — 1–10000 tracingTypeSampling algorithm — ZipkinapiVersion: alibabacloud.com/v1 kind: AlbConfig metadata: name: alb-demo spec: config: name: alb-test addressType: Intranet zoneMappings: # The vSwitch must be in an ALB-supported zone and the same VPC as the cluster. Select at least two vSwitches in different zones for high availability. - vSwitchId: vsw-2vc82nndnoo********** # Replace with your vSwitch ID. - vSwitchId: vsw-2vc30f5mlhs********** accessLogConfig: logProject: "k8s-log-xz92lvykqj1siwvif****" # Replace with your SLS project ID from Step 2. logStore: alb_xz92lvykqj1siwvif**** # Must start with "alb_". Created automatically if it does not exist. listeners: - port: 80 protocol: HTTP logConfig: accessLogRecordCustomizedHeadersEnabled: false accessLogTracingConfig: tracingEnabled: true # Set to true to enable Xtrace. Default: false. tracingSample: 9999 # Sampling rate. Range: 1-10000, where 10000 = 100%. Example: 9999 = 99.99%. tracingType: Zipkin # Sampling algorithm. Only takes effect when tracingEnabled is true. -
Apply the AlbConfig:
kubectl apply -f alb-test.yamlExpected output:
albconfig.alibabacloud.com/alb-demo created
Step 4: Create an IngressClass
-
Create
alb.yamlwith the following content:apiVersion: networking.k8s.io/v1 kind: IngressClass metadata: name: alb spec: controller: ingress.k8s.alibabacloud/alb parameters: apiGroup: alibabacloud.com kind: AlbConfig name: alb-demo -
Apply the IngressClass:
kubectl apply -f alb.yamlExpected output:
ingressclass.networking.k8s.io/alb created
Step 5: Deploy a service and configure Ingress routing
-
Create
cafe-service.yamlwith the following content to deploy acoffeeDeployment andcoffee-svcService:apiVersion: apps/v1 kind: Deployment metadata: name: coffee spec: replicas: 2 selector: matchLabels: app: coffee template: metadata: labels: app: coffee spec: containers: - name: coffee image: registry.cn-hangzhou.aliyuncs.com/acs-sample/nginxdemos:latest ports: - containerPort: 80 --- apiVersion: v1 kind: Service metadata: name: coffee-svc spec: ports: - port: 80 targetPort: 80 protocol: TCP selector: app: coffee type: NodePort -
Deploy the Deployment and Service:
kubectl apply -f cafe-service.yamlExpected output:
deployment.apps/coffee created service/coffee-svc created -
Create
cafe-ingress.yamlto configure Ingress routing rules:apiVersion: networking.k8s.io/v1 kind: Ingress metadata: name: cafe-ingress spec: ingressClassName: alb rules: - host: demo.domain.ingress.top http: paths: - path: /coffee pathType: ImplementationSpecific backend: service: name: coffee-svc port: number: 80 -
Apply the Ingress:
kubectl apply -f cafe-ingress.yamlExpected output:
ingress.networking.k8s.io/cafe-ingress created
Step 6: Configure domain name resolution
If you set a custom domain in spec.rules.host, add a CNAME record for that domain pointing to the ALB DNS name. For instructions, see Create and use an ALB Ingress to expose Services to external traffic.
Step 7: Send requests to generate trace data
-
Get the ALB instance address:
kubectl get ingExpected output:
NAME CLASS HOSTS ADDRESS PORTS AGE cafe-ingress alb demo.domain.ingress.top alb-u53i28ewt580*****.cn-<Region>.alb.aliyuncs.com 80 16m -
Send a request to the service:
The number of requests needed before traces appear in the console depends on your sampling rate. With
tracingSample: 9999(99.99%), a single request is enough. With a lower rate — for example,tracingSample: 100(1%) — send at least 100 requests to ensure a trace is captured: ``bash for i in $(seq 1 100); do curl -s -o /dev/null -H Host:demo.domain.ingress.top http://alb-u53i28ewt580*****.cn-<Region>.alb.aliyuncs.com/coffee; done``curl -H Host:demo.domain.ingress.top http://alb-u53i28ewt580*****.cn-<Region>.alb.aliyuncs.com/coffeeThe response is an HTML page with the title Hello World.
Verify tracing
Check SLS access logs
-
Log on to the ACK console and click Clusters.
-
Click your cluster name, then click Cluster Information.
-
On the Basic Information tab, click the link in the Simple Log Service Project field to open the SLS console. In the left navigation pane, click the Logstore whose name starts with
alb_(for example,alb_xz92lvykqj1siwvif****). Search forxtraceto confirm that requests contain Xtrace data.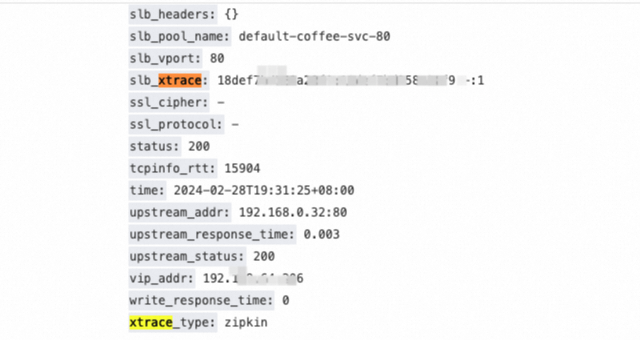
View traces in the OpenTelemetry console
-
Log on to the Managed Service for OpenTelemetry console.
-
On the Applications page, select the region from the top navigation bar and click your application name.
-
In the left navigation pane, click API Calls, then click the Trace tab to view trace data. The tab shows up to 100 traces with the longest duration. For more information, see Interface Calls.
What's next
-
To implement distributed tracing with Nginx Ingress instead, see Implement Tracing Analysis for the Nginx Ingress Controller Component.
-
If you encounter issues, see Troubleshoot ALB Ingress issues and ALB Ingress FAQ.