Container Service for Kubernetes (ACK) lets you enable tracing for the NGINX Ingress controller and send trace data to Managed Service for OpenTelemetry. Managed Service for OpenTelemetry aggregates, processes, and stores this trace data in real time. The service generates monitoring data, such as detailed traces and a real-time topology map, for troubleshooting and diagnosing issues with the NGINX Ingress controller.
The Ingress-NGINX open source project will no longer be maintained after March 2026. Consequently, Container Service for Kubernetes will also discontinue maintenance for the NGINX Ingress controller. Understand the risks before you proceed. For more details, see the product announcement about discontinuing maintenance for the NGINX Ingress controller component.
Prerequisites
-
You have activated Managed Service for OpenTelemetry and granted the required permissions.
-
The NGINX Ingress controller is installed. For more information, see Manage the NGINX Ingress controller.
Version compatibility
Support for tracing varies across different versions of the NGINX Ingress controller component, so you need to select the configuration method that is appropriate for your version.
|
NGINX Ingress controller version |
OpenTelemetry |
OpenTracing |
|
≥ v1.10.2-aliyun.1 |
Supported |
Not supported |
|
v1.9.3-aliyun.1 |
Supported |
Supported |
|
v1.8.2-aliyun.1 |
Supported |
Supported |
|
< v1.8.2-aliyun.1 |
Not supported |
Supported |
Procedure
Choose the procedure that corresponds to your NGINX Ingress controller version.
OpenTelemetry
Step 1: Obtain the endpointManaged Service for OpenTelemetry
New console
-
Log on to the Managed Service for OpenTelemetry console. In the navigation pane on the left, click Integration Center.
-
In the Open Source Frameworks section, click the OpenTelemetry card.
-
In the OpenTelemetry panel that appears, select the region where you want to report data.
-
Record the endpoint for the gRPC reporting method.
 Note
NoteUse the VPC endpoint if the NGINX Ingress controller is deployed in the same Alibaba Cloud region as your Managed Service for OpenTelemetry integration. Otherwise, use the public endpoint.
Previous console
-
Log on to the Managed Service for OpenTelemetry console.
-
In the navigation pane on the left, click Cluster Configurations. On the page that appears, click the Access Point Information tab.
-
At the top of the page, select the region that you want to connect to.
-
In the Cluster Information section, turn on the Show Token switch. In the Client section, click OpenTelemetry, and then record the endpoint for the gRPC reporting method.
 Note
NoteUse the VPC endpoint if the NGINX Ingress controller is deployed in the same Alibaba Cloud region as your Managed Service for OpenTelemetry integration. Otherwise, use the public endpoint.
Step 2: Configure the NGINX Ingress controllerManaged Service for OpenTelemetry
Log on to the ACK console. In the left navigation pane, click Clusters.
-
On the Clusters page, click the name of your cluster. In the left navigation pane, click .
-
On the Deployments page, set the Namespace to kube-system. Search for
nginx-ingress-controller, and then click Edit. -
At the top of the Edit page, select the nginx-ingress-controller container. On the Environment Variable tab, click Add to set the following environment variable.
Type
Variable key
Value/value from
Description
Custom
OTEL_EXPORTER_OTLP_HEADERS
authentication=<authentication token>Use the authentication token that you obtained in Step 1: Obtain the endpoint. Example:
authentication=bfXXXXXXXe@7bXXXXXXX1_bXXXXXe@XXXXXXX1.
After you add the variable, click Edit in the right-side panel of the Update page. In the dialog box that appears, click OK.
-
In the navigation pane on the left, choose .
-
On the Configurations page, set the Namespace to kube-system. Search for
nginx-configuration, and then click Actions in the Edit column for the nginx-configuration ConfigMap. -
In the Edit panel, click Add, add the following configuration, and then click OK.
Parameter
Description
Value
Example
enable-opentelemetry
Enables OpenTelemetry tracing.
-
true: enables tracing.
-
false: disables tracing.
truemain-snippet
-
env OTEL_EXPORTER_OTLP_HEADERS;env OTEL_EXPORTER_OTLP_HEADERS;otel-service-name
The service name.
Custom.
nginx-ingress
otlp-collector-host
The domain name of the gRPC reporting endpoint.
Use the VPC endpoint that you obtained in Step 1: Obtain the endpoint. Remove the http:// prefix and the port number. Example:
tracing-analysis-XX-XX-XXXXX.aliyuncs.com.tracing-analysis-XX-XX-XXXXX.aliyuncs.comotlp-collector-port
The port of the gRPC reporting endpoint.
Enter the actual value.
8090opentelemetry-trust-incoming-span
Specifies whether to trust incoming traces from other services.
-
true: trust is enabled.
-
false: trust is disabled.
trueopentelemetry-operation-name
The format of the trace span.
HTTP $request_method $service_name $uriHTTP $request_method $service_name $uriotel-sampler
The sampling strategy.
For more information about the parameters, see opentelemetry.
TraceIdRatioBased
otel-sampler-ratio
The sampling rate.
The value must be between 0 and 1, with up to two decimal places. A value of 0 means no requests are sampled, and 1 means all requests are sampled.
For more information about the parameters, see opentelemetry.
0.1
otel-sampler-parent-based
Specifies whether to inherit the sampling decision from the upstream service.
-
false (Default): Does not inherit the upstream sampling decision. Sampling is based on the otel-sampler and otel-sampler-ratio parameters.
-
true: Inherits the upstream sampling decision. The otel-sampler and otel-sampler-ratio parameters are ignored.
For more information about the parameters, see opentelemetry.
false
-
Step 3: View trace dataManaged Service for OpenTelemetry
-
Log on to the Managed Service for OpenTelemetry console.
-
In the navigation pane on the left, click Applications.
-
At the top of the Applications page, select the region, and then click the nginx-ingress application name.
-
-
On the Application Overview tab, view metrics such as request count and error count.
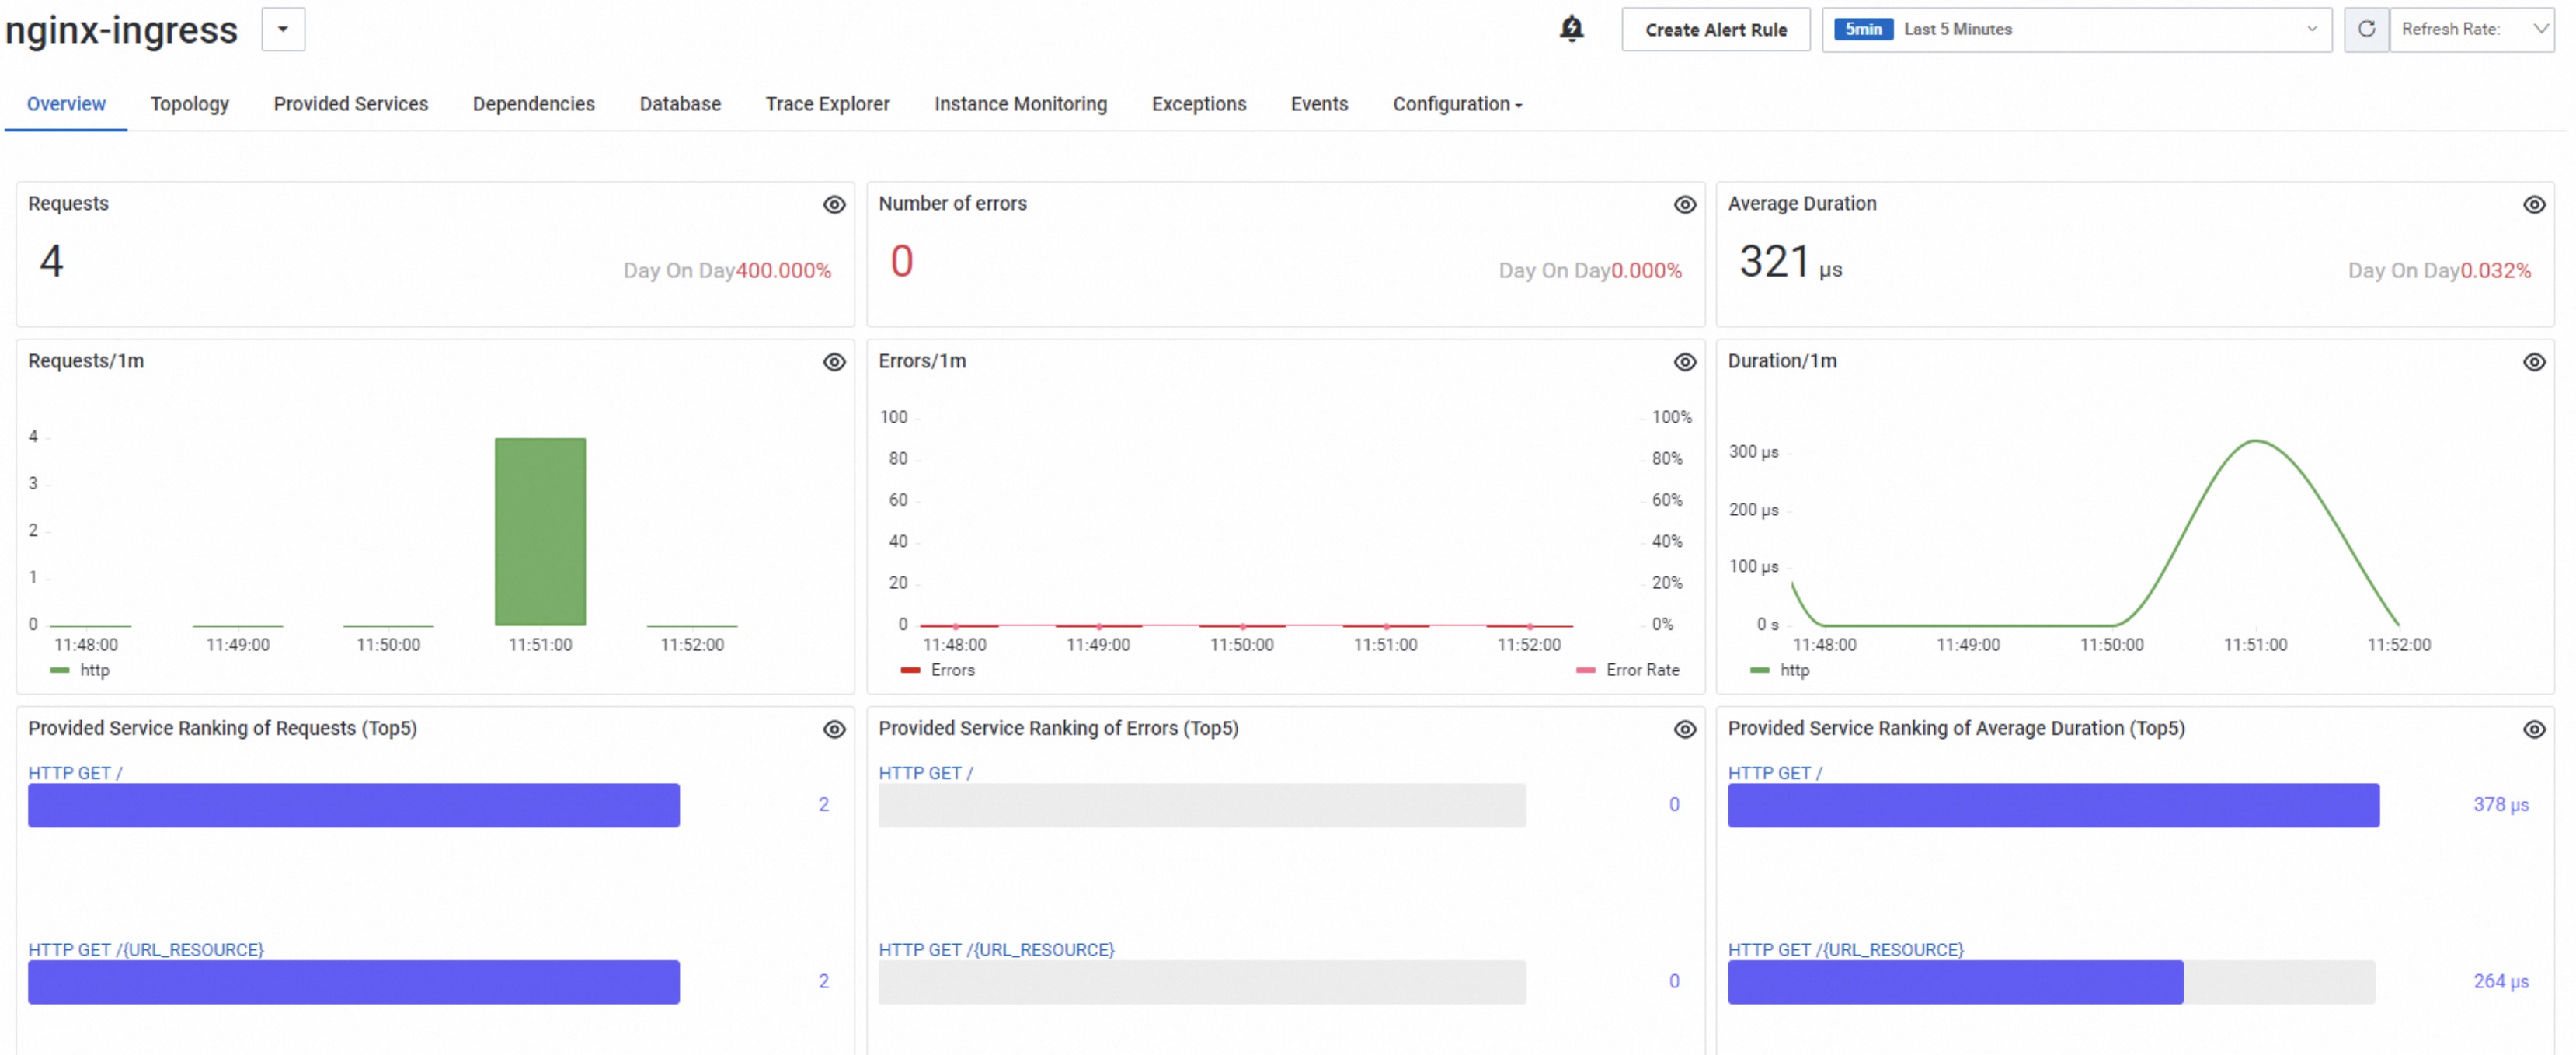
-
On the Trace Analysis tab, view information such as the trace list and average duration.

-
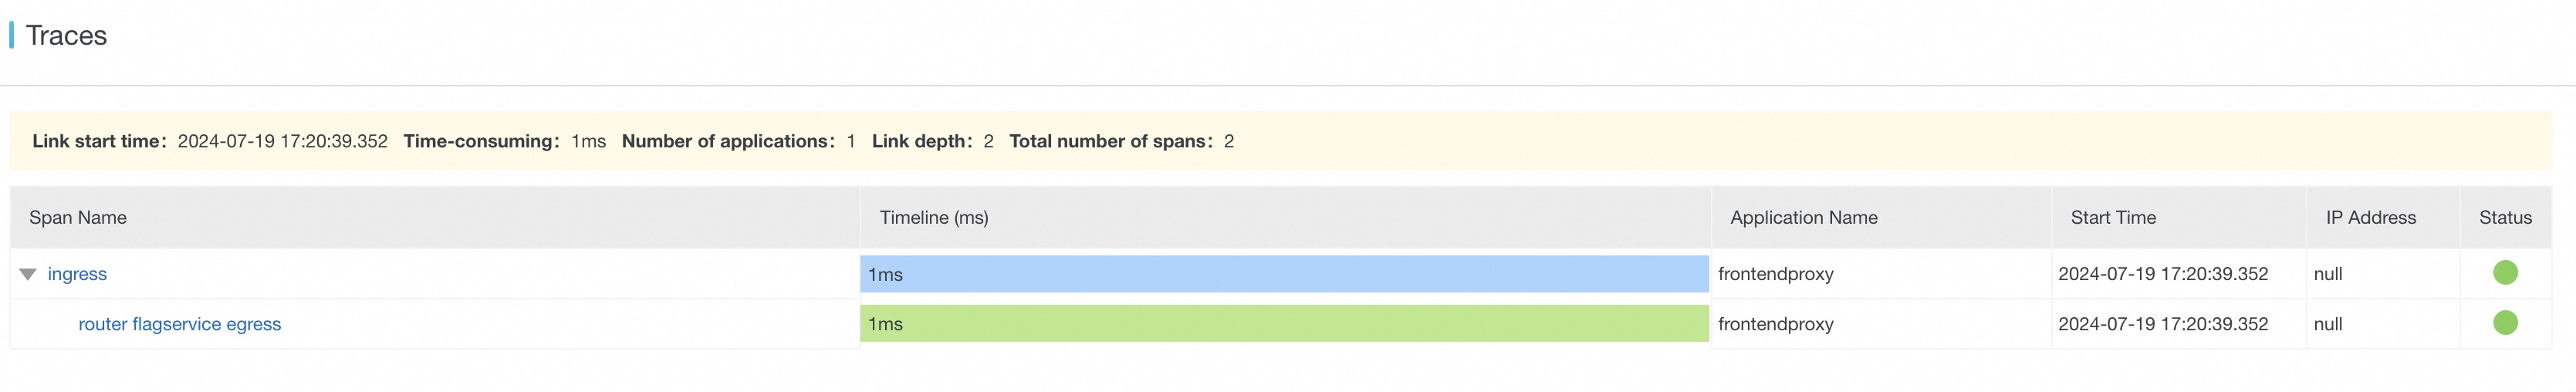
On the Trace Analysis tab, click a Trace ID to view the trace details.

-
OpenTracing
Step 1: Obtain the endpointManaged Service for OpenTelemetry
New console
-
Log on to the Managed Service for OpenTelemetry console. In the navigation pane on the left, click Integration Center.
-
In the Open Source Frameworks section, click the Zipkin card.
NoteThe endpoint you obtain depends on the client you use. This topic uses Zipkin as an example.
-
In the Zipkin panel that appears, select the region where you want to report data.
-
Record the endpoint information.
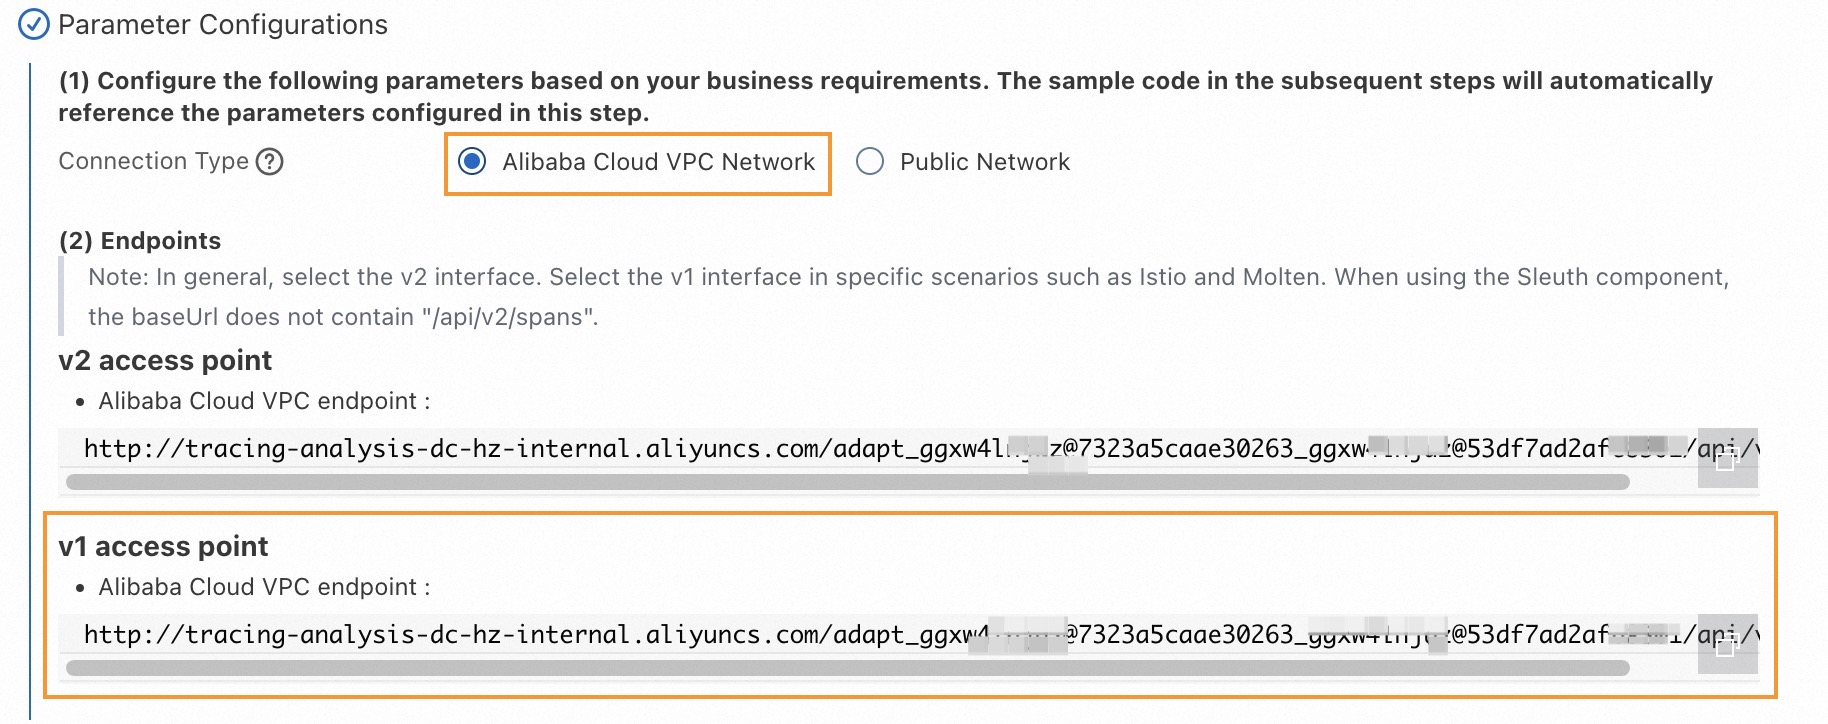 Note
NoteUse the VPC endpoint if the NGINX Ingress controller is deployed in the same Alibaba Cloud region as your Managed Service for OpenTelemetry integration. Otherwise, use the public endpoint.
Previous console
-
Log on to the Managed Service for OpenTelemetry console.
-
In the navigation pane on the left, click Cluster Configurations. On the page that appears, click the Access Point Information tab.
-
At the top of the page, select the region that you want to connect to.
-
In the Cluster Information section, turn on the Show Token switch. In the Client section, click Zipkin, and then record the endpoint information.
 Note
NoteUse the VPC endpoint if the NGINX Ingress controller is deployed in the same Alibaba Cloud region as your Managed Service for OpenTelemetry integration. Otherwise, use the public endpoint.
Step 2: Configure the NGINX Ingress controllerManaged Service for OpenTelemetry
Log on to the ACK console. In the left navigation pane, click Clusters.
On the Clusters page, click the name of your cluster. In the left navigation pane, click .
-
On the Configurations page, set the Namespace to kube-system. Search for
nginx-configuration, and then click Actions in the Edit column for thenginx-configurationConfigMap. -
In the Edit panel, click Add, add the following configuration, and then click OK.
Parameter
Description
Value
Example
enable-opentracing
Specifies whether to enable tracing.
-
true: enables tracing.
-
false: disables tracing.
true
zipkin-service-name
The service name.
Custom.
nginx-ingress
zipkin-collector-host
The domain name of the reporting endpoint.
Modify the endpoint that you obtained in Step 1: Obtain the endpoint. Remove the
http://prefix and append a question mark?to the end. For example:-
Original endpoint:
http://tracing-analysis-dc-hz-internal.aliyuncs.com/adapt_******_******/api/v1/spans -
Modified value:
tracing-analysis-dc-hz-internal.aliyuncs.com/adapt_******_******/api/v1/spans?
tracing-analysis-dc-hz-internal.aliyuncs.com/adapt_******_******/api/v1/spans?opentracing-trust-incoming-span
Specifies whether to trust traces from other services or systems.
-
true: trust is enabled.
-
false: trust is disabled.
true
zipkin-sample-rate
The sampling rate.
The value must be between 0 and 1, with up to two decimal places. A value of 0 means no requests are sampled, and 1 means all requests are sampled.
0.1
-
Step 3: View trace dataManaged Service for OpenTelemetry
-
Log on to the Managed Service for OpenTelemetry console.
-
In the navigation pane on the left, click Applications.
-
At the top of the Applications page, select the region, and then click the nginx application name.
-
In the navigation pane on the left of the application details page, click API Call. In the right-side area, view the trace information.
-
The Overview tab displays the trace topology.
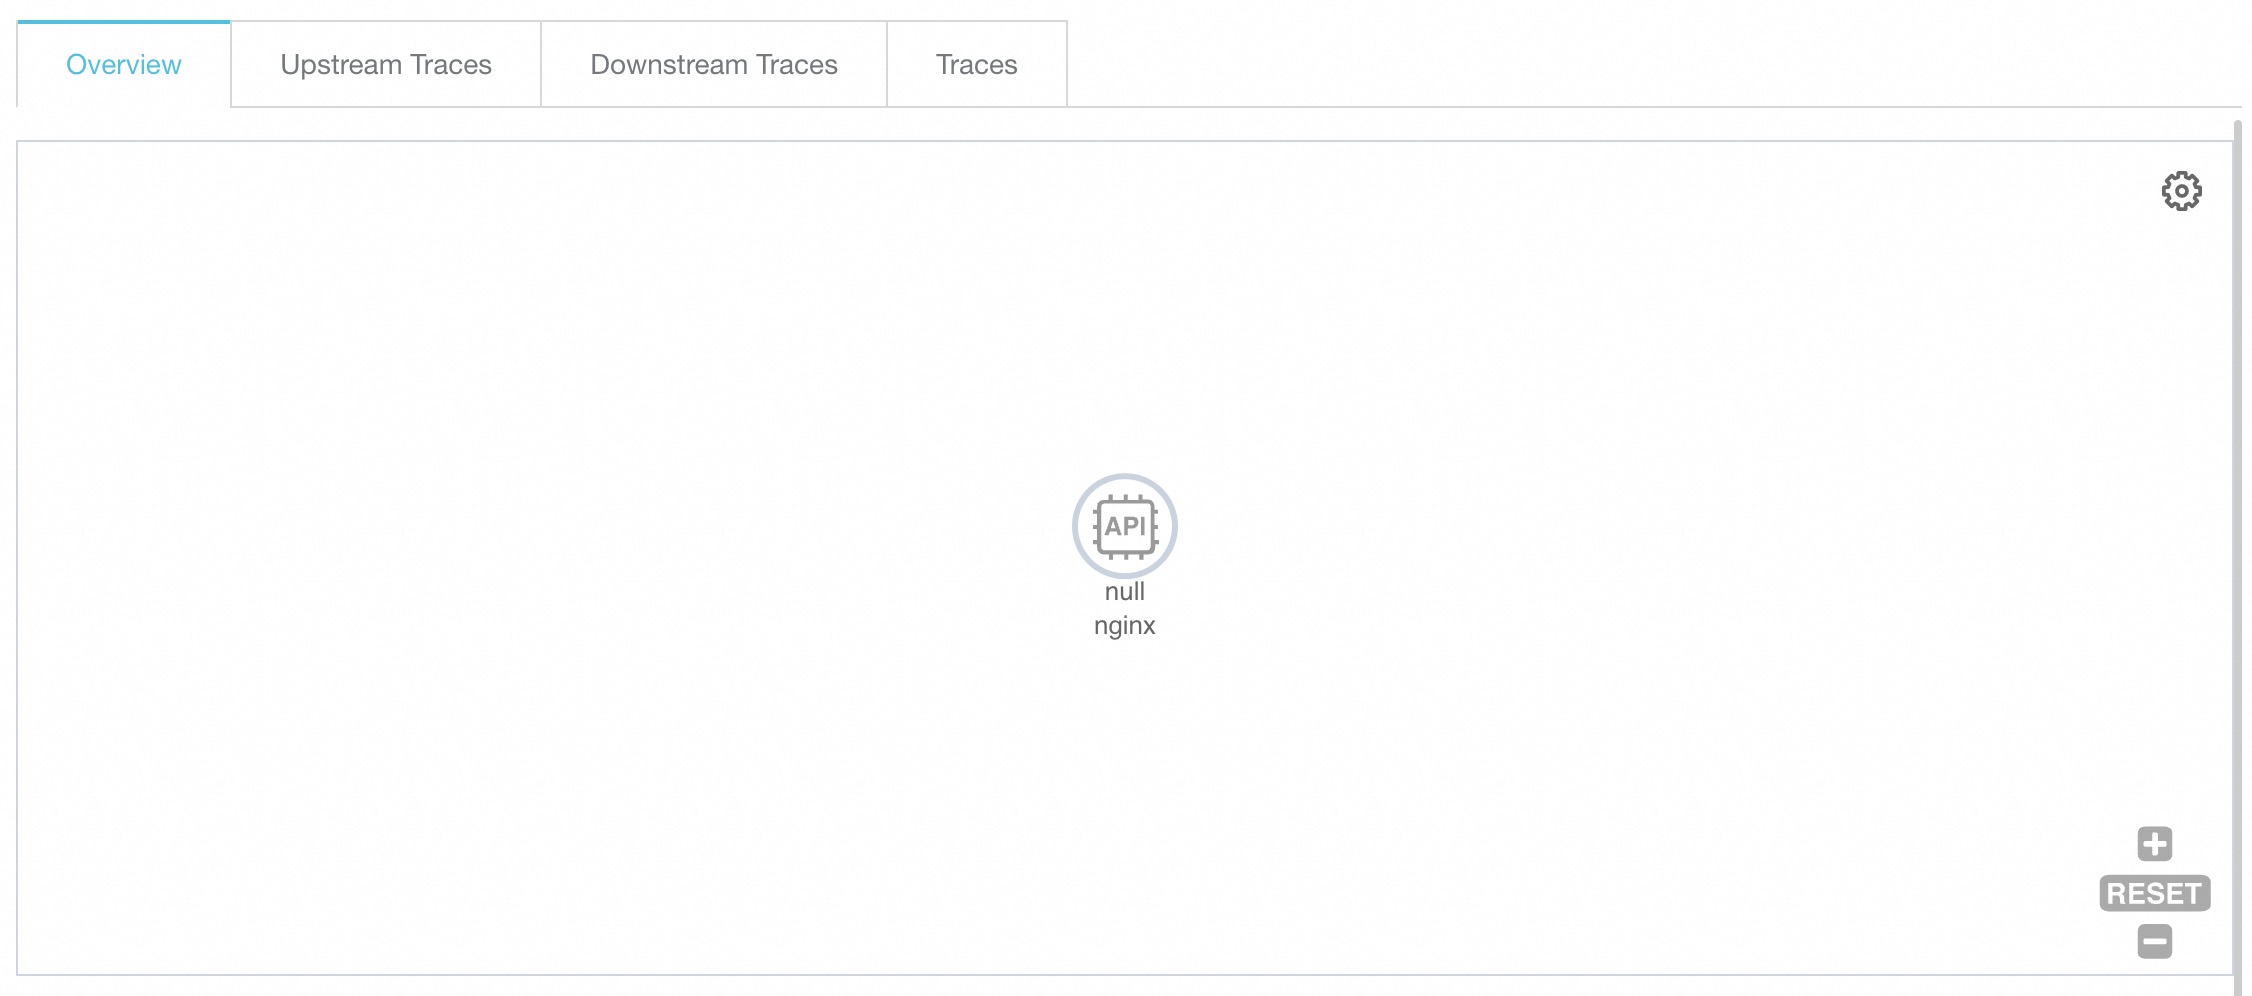
-
Click the Traces tab to view up to 100 traces with the longest duration for the application. For more information about trace data, see Interface Calls.
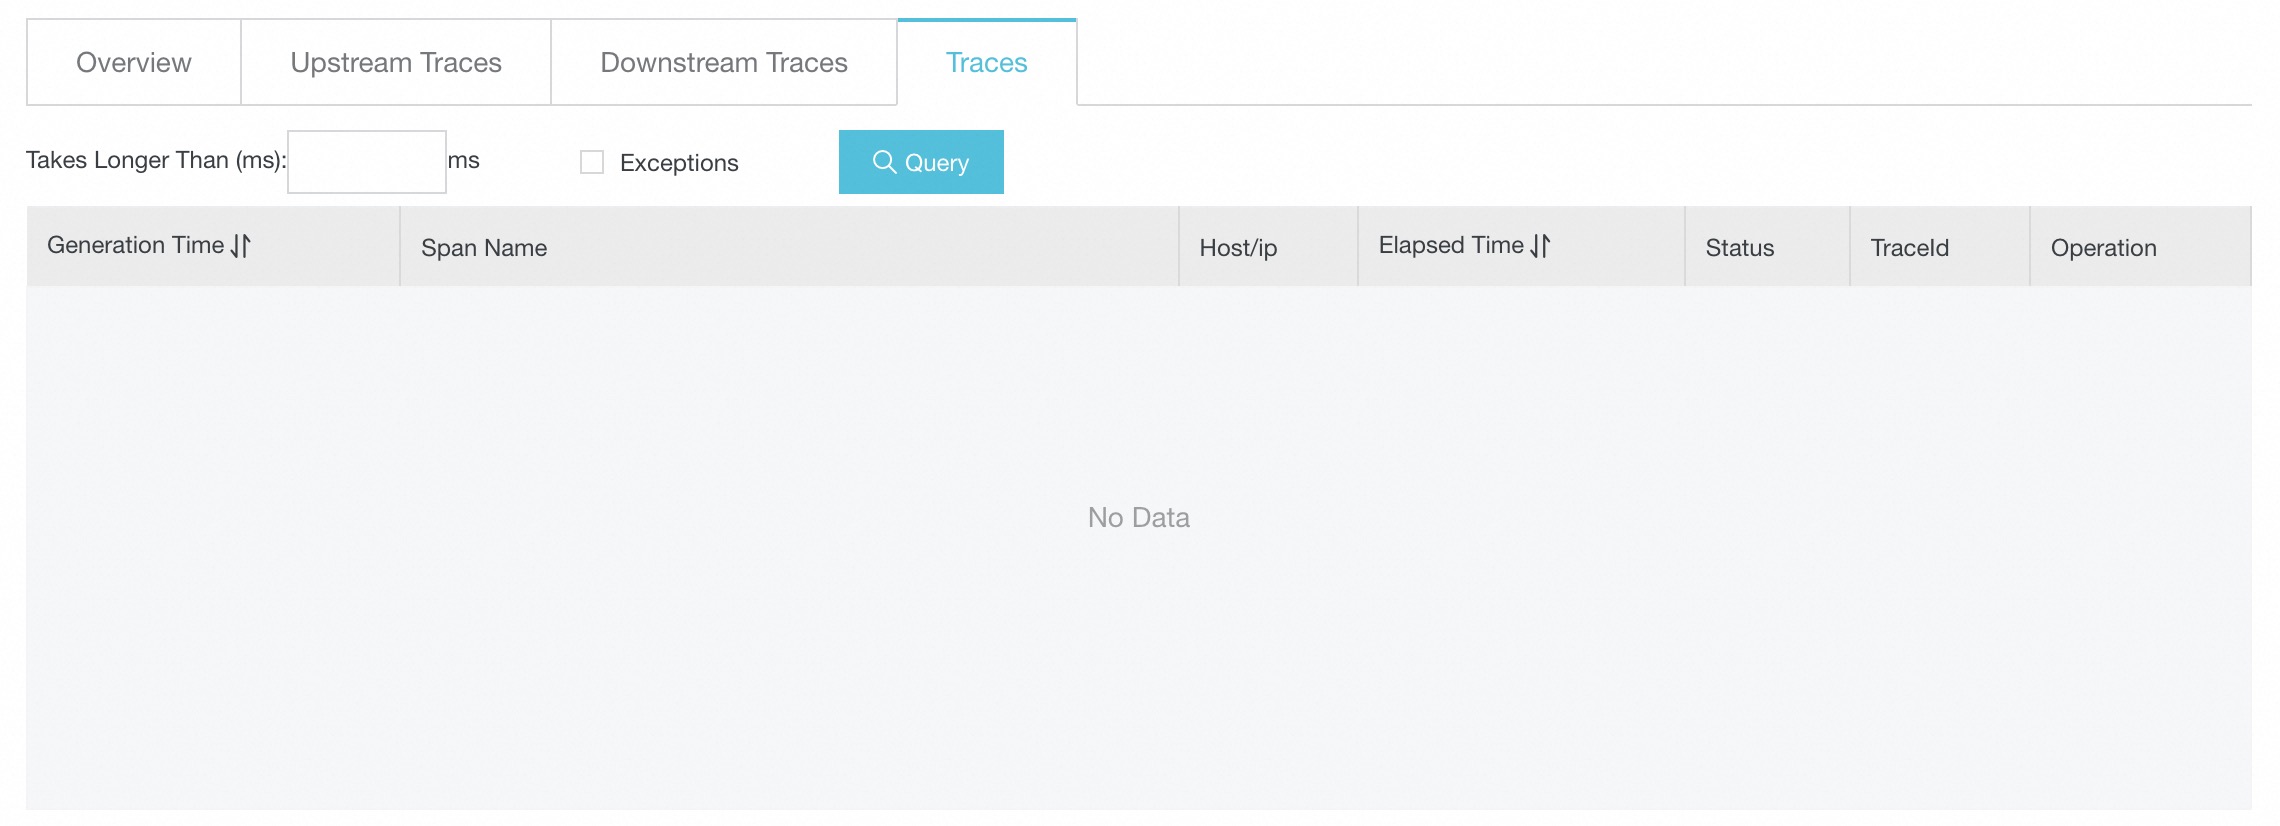
-
On the Traces tab, click a Trace ID to view the trace details.
-
Change the trace propagation protocol (Optional)
When you use OpenTelemetry for NGINX Ingress controller tracing, OpenTelemetry by default recognizes and propagates the trace context downstream in the W3C Trace Context format. If your frontend and backend applications use other protocols, such as Jaeger or Zipkin, you need to modify the trace propagation protocol of OpenTelemetry to link the traces from the frontend application, NGINX Ingress controller, and backend application. This topic describes how to modify the OpenTelemetry trace propagation protocol that is used by the NGINX Ingress controller.
-
In addition to the configuration in Step 2, substep 4, add the
OTEL_PROPAGATORSenvironment variable. Save the change and redeploynginx-ingress-controller.Variable key
Value
Description
OTEL_PROPAGATORS
tracecontext,baggage,b3,jaeger
The propagation format. For more information, see Specify the propagation header format for OpenTelemetry.
-
In addition to the configuration in Step 2, substep 7, modify the
main-snippetconfiguration to apply theOTEL_PROPAGATORSenvironment variable.Parameter
Value
Description
main-snippet
env OTEL_EXPORTER_OTLP_HEADERS; env OTEL_PROPAGATORS;
Loads the environment variables.
References
-
For more information about Managed Service for OpenTelemetry, see What is Managed Service for OpenTelemetry?
-
For more information about ACK, see What is Container Service for Kubernetes (ACK)?
-
The required fields in the
nginx-configurationConfigMap vary depending on the tracing solution (such as Zipkin, Jaeger, or SkyWalking). For more information about integrating these solutions with Managed Service for OpenTelemetry, see Preparations.