Simple Log Service allows you to query and analyze logs by configuring an index. This feature integrates SQL analytics. This topic describes the basic syntax, usage limits, and SQL functions for this feature.
Before you begin
Simple Log Service provides features for querying and analyzing logs. For instructions, see Get started with log query and analysis.
To query and analyze logs, you must collect them into a Standard logstore. For more information, see Manage a logstore. After you create an index, queries and analysis run only on incremental logs. To query and analyze historical log files, you must reindex them.
If you need to query tens of billions of logs, see What do I do if the "The results are inaccurate" error message appears in the console?.
Simple Log Service includes reserved fields by default. To analyze reserved fields, see Reserved fields.
Query and analysis
Simple Log Service allows you to query billions of logs in seconds and perform statistical analysis on the results using SQL. While a search statement can be used by itself, an analytic statement must always be paired with a search statement. This allows you to analyze query results or the entire dataset.
SLS Query Skill for intelligent log query and analysis: Simple Log Service provides an Agent Skill that lets you use natural language to query and analyze SLS log data in a local AI Agent.
Basic syntax
A query consists of a search statement and an optional analytic statement, separated by a vertical bar (|). You can run a search statement by itself. However, an analytic statement must always follow a search statement to analyze the query results or the entire dataset.
Search statement | Analytic statementType | Description |
Search statement |
Important We recommend that you use no more than 30 conditions in a search statement. |
Analytic statement |
Important
|
Simple Log Service provides ANTLR grammar files that you can use with ANTLR tools to develop custom applications based on SLS queries.
The following are the ANTLR grammar files:
Example
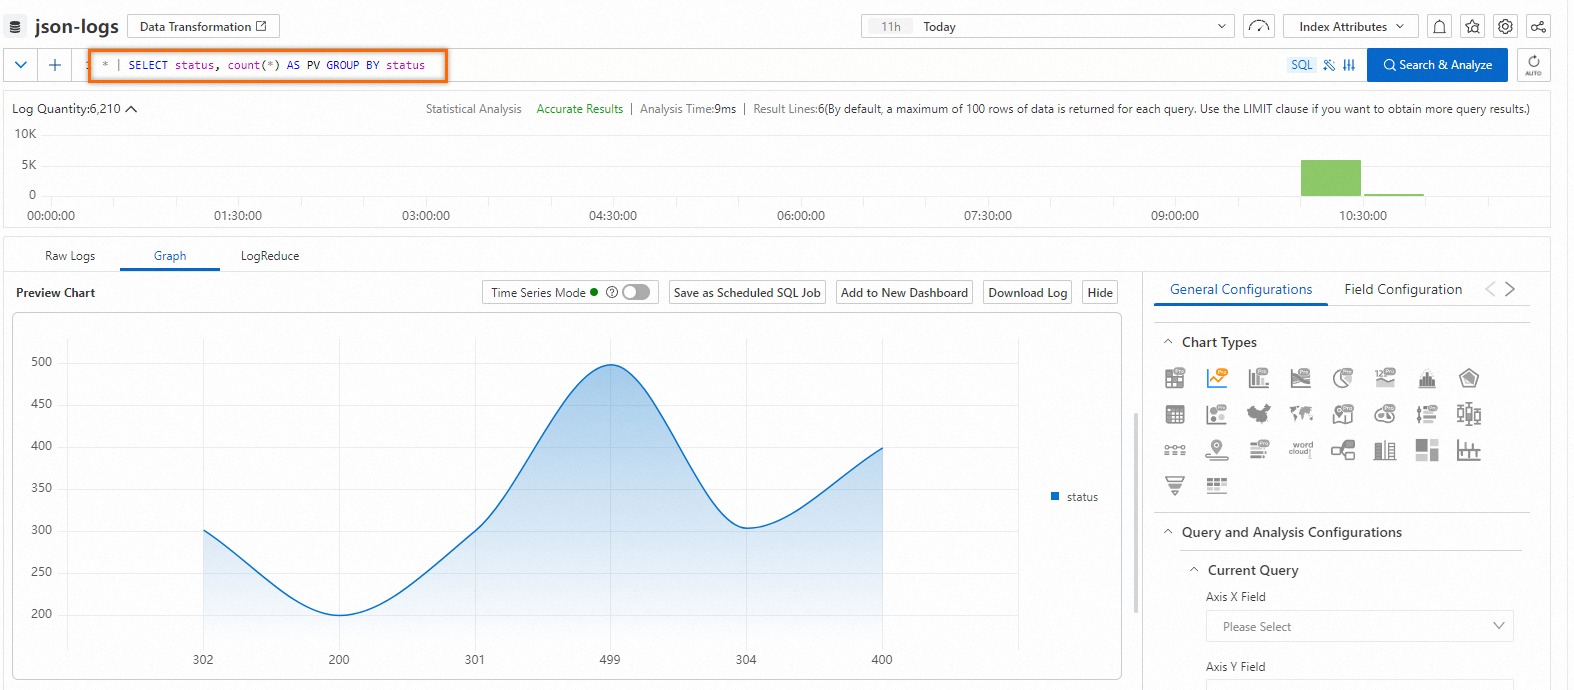
* | SELECT status, count(*) AS PV GROUP BY statusThe query and analysis results are shown in the following figure.
Advanced features
LiveTail: Monitor online logs in real time to reduce O&M workloads.
LogReduce: Extracts patterns from similar logs during log collection to quickly provide an overview of your log data.
Contextual query: View the context of a specific log for easier troubleshooting and problem diagnosis.
Field analysis: Provides field distribution, statistical metrics, and top-five time series charts to help you understand your data.
Event configuration: Configure events to easily obtain detailed information from raw logs.
StoreView overview: Use StoreView to perform cross-region and cross-store federated queries.
Query limits
Item | Description |
Number of keywords | You can specify up to 30 conditions, excluding logical operators, in a single query. |
Field value size | The maximum size of a single field value is 512 KB. Any content exceeding this limit is not indexed for queries. If a field value is larger than 512 KB, you may not be able to find the log by using a keyword search, but the log data itself remains complete. Note To set the maximum length for a log field value, see Why are field values truncated during query and analysis? |
Concurrent operations | A single project supports a maximum of 100 concurrent query operations. For example, 100 users can run queries in different logstores within the same project at the same time. |
Returned results | Each query returns up to 100 results per page. You can navigate through the pages to view all results. |
Fuzzy search | When you perform a fuzzy search, Simple Log Service finds up to 100 matching terms and returns all logs that contain these terms and meet the search criteria. For more information, see Fuzzy search. |
Result sorting | By default, results are displayed in descending chronological order, sorted by time accurate to the second or nanosecond, if available. |
Limits
|
Limit |
General-purpose instance |
Dedicated SQL |
|
|
SQL enhancement |
Full Precision |
||
|
Concurrency |
Up to 15 concurrent queries per project. |
Up to 100 concurrent queries per project. |
Up to 5 concurrent queries per project. |
|
Data volume |
A single query can scan up to 400 MB of log data, excluding cached data. Data that exceeds this limit is truncated, and the result is marked as incomplete query result. |
A single query can scan up to 2 GB of log data, excluding cached data. Data that exceeds this limit is truncated, and the result is marked as incomplete query result. |
Unlimited. |
|
Enabling the mode |
Enabled by default. |
You can enable this feature using a switch. For more information, see SQL enhancement. |
You can enable this feature using a switch. For more information, see SQL complete accuracy. |
|
Fee |
Free of charge. |
Charged based on the actual CPU time used. |
Charged based on the actual CPU time used. |
|
Data effectiveness |
The analysis feature applies only to data written after the feature is enabled. To analyze historical data, you must reindex the data. |
The analysis feature applies only to data written after the feature is enabled. To analyze historical data, you must reindex the data. |
The analysis feature applies only to data written after the feature is enabled. To analyze historical data, you must reindex the data. |
|
Return results |
By default, an analysis operation returns a maximum of 100 rows of data and 100 MB of data. An error is reported for an analytic statement that returns more than 100 MB of data. To return more data, use the LIMIT clause. |
By default, an analysis operation returns a maximum of 100 rows of data and 100 MB of data. An error is reported for an analytic statement that returns more than 100 MB of data. To return more data, use the LIMIT clause. |
By default, an analysis operation returns a maximum of 100 rows of data and 100 MB of data. An error is reported for an analytic statement that returns more than 100 MB of data. To return more data, use the LIMIT clause. |
|
Field value size |
The default maximum length of a single field value is 2 KB (2,048 bytes). You can increase the maximum length to 16 KB (16,384 bytes). The part of a value that exceeds the limit is not used in log analysis and retrieval. Note
To modify the maximum length of a field value, set Maximum Length of Text Field. The updated index setting is effective only for incremental data. For more information, see Create an index. |
|
Timeout period |
The maximum timeout period for an analysis operation is 55 seconds. |
The maximum timeout period for an analysis operation is 55 seconds. |
The maximum timeout period for an analysis operation is 55 seconds. |
|
Number of bits for double-typed field values |
A double-typed field value can have a maximum of 52 bits. If the number of bits used to encode a floating-point number exceeds 52, a loss of precision occurs. |
A double-typed field value can have a maximum of 52 bits. If the number of bits used to encode a floating-point number exceeds 52, a loss of precision occurs. |
A double-typed field value can have a maximum of 52 bits. If the number of bits used to encode a floating-point number exceeds 52, a loss of precision occurs. |
FAQ
Related documents
Related API operations