SQL Enhancement elastically scales storage and computing resources to accelerate query and analysis in Simple Log Service without manual intervention.
How it works
Background
Simple Log Service decouples storage from computing: the shard-based storage layer handles data storage and management, while the computing layer uses SQL for query and analysis.
To improve analysis performance, enhance either or both layers. The following sections compare common approaches.

Solution 1: Split a shard
Manually split a shard to expand storage capacity and indirectly increase computing throughput.
Limitations:
-
This method applies only to newly written data.
-
Active shards incur charges. Billing.
-
A single query is limited by concurrency and data volume.
-
You must manually split or merge shards.
Solution 2: Divide and conquer queries
Break a large query into multiple subqueries and aggregate the results.
Limitations:
-
Requires maintaining secondary aggregation logic and intermediate storage. Use Scheduled SQL for this.
-
Changing analysis dimensions requires reconstructing the aggregation logic.
-
Computing bottlenecks can still occur with very large data volumes.
Solution 3: Use SQL Enhancement
SQL Enhancement dynamically scales storage and computing resources based on data volume, delivering faster analysis without manual tuning.

|
Comparison |
Solution 1: Split a shard |
Solution 2: Divide and conquer queries |
Solution 3: Use SQL Enhancement |
|
Resource isolation |
Independent storage resources, shared computing resources |
Independent storage resources, shared computing resources |
Independent storage resources and elastic dedicated computing resources |
|
Scaling granularity |
Storage layer scaling |
Computing layer scaling |
Elastic scaling for both storage and computing layers |
|
Maintenance overhead |
Requires manual intervention. |
You must break down large queries into subqueries. |
Fully automated scheduling. |
|
Query complexity |
Supports native SQL. |
Requires custom development. |
Supports native SQL. |
Prerequisites
A Standard logstore is created. For more information, see Create a basic LogStore.
-
Logs are collected. For more information, see Data collection.
-
Indexes are configured. For more information, see Configure indexes.
Procedure
Enable SQL Enhancement in one of the following ways:
-
Enable for a single query: applies only to the current query in the Logstore.
-
Enable by default: applies to all queries in the Project, including alerts and dashboards.
Console
Enable for a single query
Log on to the Simple Log Service console.
In the Projects section, click the one you want.

On the tab, click the logstore you want.
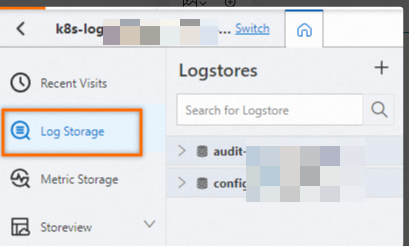
-
Click
 > SQL Enhancement.
Enable by default
Log on to the Simple Log Service console.
In the Projects section, click the one you want.
-
Click the
 icon.
icon.Click the Home icon in the top navigation bar to return to the Project list or switch Projects.
-
Hover over CUs of SQL-dedicated Instance and click Settings.
-
In the Modify CUs of SQL-dedicated Instance panel, turn on the Enable by Default switch, and then click OK.
API
Enable for a single query
-
GetLogs (returns uncompressed results) - Query logs in a Logstore
Configure one of the following parameters.
-
The
powerSqlparameter: set to true for SQL Enhancement, or false (default) for Standard SQL. -
The
queryparameter: prependset session parallel_sql=true;to your SQL statement. For example,* | select count(*) as pvbecomes* | set session parallel_sql=true; select count(*) as pv.
-
-
GetLogsV2 (returns compressed results) - Query log data in a Logstore
Configure one of the following parameters.
-
The
powerSqlparameter: set to true for SQL Enhancement, or false (default) for Standard SQL. -
The
queryparameter: prependset session parallel_sql=true;to your SQL statement. For example,* | select count(*) as pvbecomes* | set session parallel_sql=true; select count(*) as pv.
-
Enable by default
In the Create a Dedicated SQL instance operation, set useAsDefault=true to enable SQL Enhancement by default for the Project.
SDK
The following examples use the Java SDK.
Prerequisites
Enable for a single query
-
GetLogs() method
Configure one of the following parameters.
-
The
powerSqlparameter: set to true for SQL Enhancement, or false (default) for Standard SQL. -
The
queryparameter: prependset session parallel_sql=true;to your SQL statement. For example,* | select count(*) as pvbecomes* | set session parallel_sql=true; select count(*) as pv.
import com.aliyun.openservices.log.Client; import com.aliyun.openservices.log.exception.LogException; import com.aliyun.openservices.log.response.GetLogsResponse; import java.util.Date; public class CreateSqlInstance { public static void main(String[] args) throws LogException { // This example shows how to obtain an AccessKey ID and an AccessKey secret from environment variables. String accessId = System.getenv("ALIBABA_CLOUD_ACCESS_KEY_ID"); String accessKey = System.getenv("ALIBABA_CLOUD_ACCESS_KEY_SECRET"); // The endpoint for Simple Log Service. This example uses the endpoint for the China (Hangzhou) region. Replace it with the actual endpoint. String host = "https://cn-hangzhou.log.aliyuncs.com"; // Create a Simple Log Service client. Client client = new Client(host, accessId, accessKey); // The Project name. String projectName = "aliyun-project-test"; // The Logstore name. String logstore = "request_log"; // Specifies whether to enable SQL Enhancement by default. Default value: false. boolean useAsDefault = true; // The SQL query statement. String query = "* | select count(1)"; // The maximum number of logs to return. This parameter is valid only when the query parameter is a search statement. Value range: 0 to 100. Default value: 100. int line = 3; // The line number from which to start the query. This parameter is valid only when the query parameter is a search statement. Default value: 0. int offset = 0; // Specifies whether to return logs in reverse chronological order of log timestamps, accurate to the minute. // true: Returns logs in reverse chronological order. // false (default): Returns logs in chronological order. boolean reverse = false; // Specifies whether to use SQL Enhancement. // true: Use SQL Enhancement. // false (default): Use Standard SQL. boolean powerSql = true; int from = (int) (new Date().getTime() / 1000 - 600); int to = (int) (new Date().getTime() / 1000); GetLogsResponse getLogsResponse = client.GetLogs(projectName, logstore, from, to, "", query, line, offset, reverse, powerSql); System.out.println(getLogsResponse.getCpuSec()); } } -
Enable by default
Set boolean useAsDefault = true to enable SQL Enhancement by default for the Project.
import com.aliyun.openservices.log.Client;
import com.aliyun.openservices.log.exception.LogException;
import com.aliyun.openservices.log.request.CreateOrUpdateSqlInstanceRequest;
public class CreateSqlInstance {
    public static void main(String[] args) throws LogException {
        // This example shows how to obtain an AccessKey ID and an AccessKey secret from environment variables.
        String accessId = System.getenv("ALIBABA_CLOUD_ACCESS_KEY_ID");
        String accessKey = System.getenv("ALIBABA_CLOUD_ACCESS_KEY_SECRET");
        // The Project name.
        String projectName = "aliyun-test-project";
        // The endpoint for Simple Log Service. This example uses the endpoint for the China (Hangzhou) region. Replace it with the actual endpoint.
        String host = "https://cn-hangzhou.log.aliyuncs.com";
        // Create a Simple Log Service client.
        Client client = new Client(host, accessId, accessKey);
        int cu = 100;
        boolean useAsDefault = true;
        client.createSqlInstance(new CreateOrUpdateSqlInstanceRequest(projectName, cu, useAsDefault));
    }
}FAQ
-
How do I check the CPU time?
After running a query, hover over Analysis Results to view the CPU time. The Consumed CPU Time field in the upper-right statistics panel displays the CPU time in seconds.
-
Cost of a Dedicated SQL query
Cost varies by data volume and query complexity.
Query statement
Data volume (rows)
Cost per execution (USD)
* | select avg(double_0) from stress_s1_mil14 billion
0.004435
* | select avg(double_0), sum(double_0), max(double_0), min(double_0), count(double_0) from stress_s1_mil14 billion
0.006504
* | select avg(double_0), sum(double_1), max(double_2), min(double_3), count(double_4) from stress_s1_mil14 billion
0.013600
* | select key_0 , avg(double_0) as pv from stress_s1_mil1 group by key_0 order by pv desc limit 10004 billion
0.011826
* | select long_0, avg(double_0) as pv from stress_s1_mil1 group by long_0 order by pv desc limit 10004 billion
0.011087
* | select long_0, long_1, avg(double_0) as pv from stress_s1_mil1 group by long_0,long_1 order by pv desc limit 1000300 million
0.010791
* | select avg(double_0) from stress_s1_mil1 where key_0='key_987'4 billion
0.00007