Simple Log Service supports SQL analysis of search results.
Basic syntax
-
SLS Query Skill: Intelligently query and analyze logs: SLS provides an Agent Skill that lets you query and analyze log data using natural language in a local AI agent.
A query consists of a search statement and an analytic statement, separated by a pipe character (|). The format is as follows:
Search statement|Analytic statementA search statement runs independently. An analytic statement must follow a search statement. Log analysis processes search results or all data in a Logstore.
-
We recommend that you specify up to 30 search conditions per search statement.
-
Without a FROM or WHERE clause, an analytic statement analyzes all data in the current Logstore by default. Analytic statements are case-insensitive, do not support offset syntax, and do not require a trailing semicolon (;).
|
Statement |
Description |
|
Search statement |
A search statement specifies one or more conditions: a keyword, numeric value, numeric range, space, or asterisk (*). A space or asterisk (*) matches all logs without conditions. |
|
Analytic statement |
An analytic statement aggregates or analyzes search results or all data in a Logstore. SLS supports the following functions and syntax: |
Example:
* | SELECT status, count(*) AS PV GROUP BY statusSQL functions and SQL clauses
SQL functions calculate, convert, and format data — for example, computing sums, manipulating strings, and processing dates. SQL functions are typically embedded in SQL clauses.
SQL clauses build complete query and processing statements — specifying data sources, conditions, grouping, and ordering.
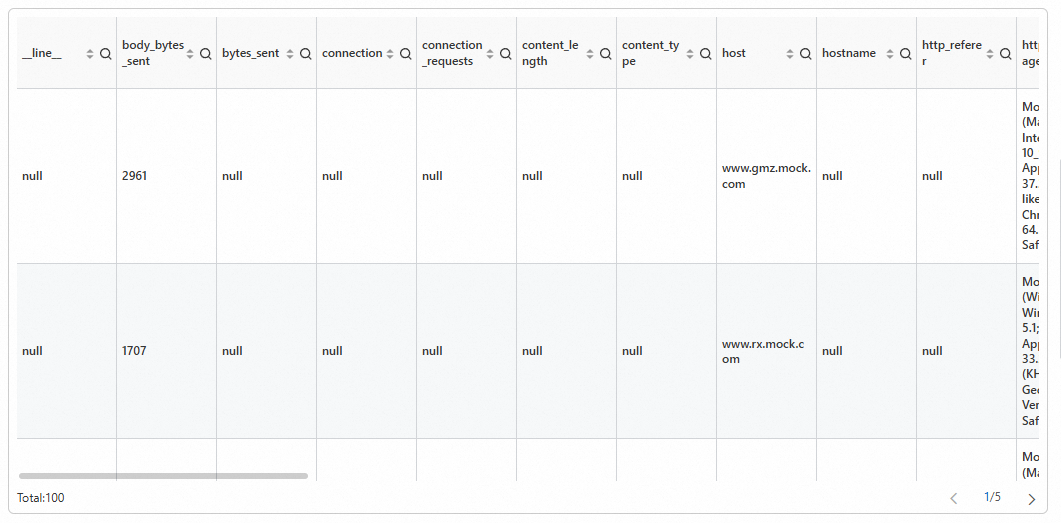
Example 1. Query logs of the previous day
Uses current_date to get today's date and date_add to subtract an interval. Results display in a table. (Demo)
-
Query statement
* | SELECT * FROM log WHERE __time__ < to_unixtime(current_date) AND __time__ > to_unixtime(date_add('day', -1, current_date)) -
Results
Example 2. Query the distribution of source IP addresses for logs
Uses the ip_to_province function to resolve provinces from IP addresses, groups by address with group by, and counts occurrences with the count function. Results display in a pie chart. (Try Demo)
-
Query statement
* |
select
  count(1) as c,
  ip_to_province(remote_addr) as address
group by
  address
limit
  100
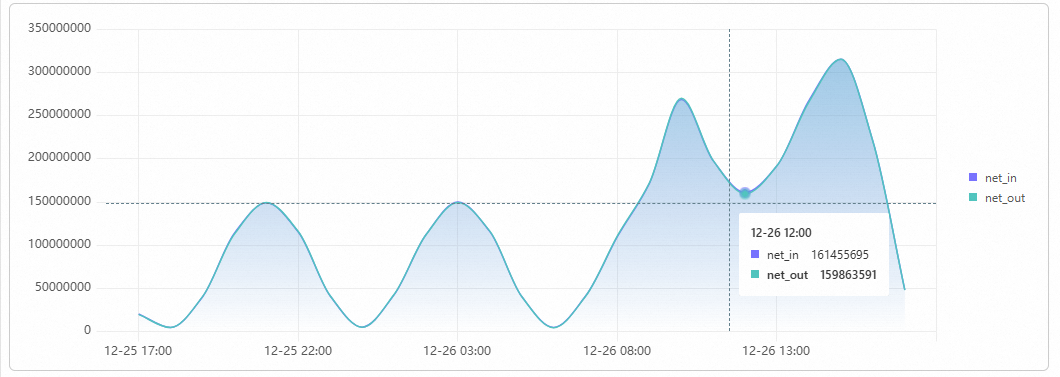
Example 3. Query the inbound and outbound NGINX traffic
Uses date_trunc to align __time__ to the hour. __time__ is a system field for log ingestion time (Unix timestamp). The query uses date_format to format timestamps, group by to group by time, and sum to total hourly traffic. Results display as a line chart with time on the X-axis and net_out/net_in on the left Y-axis. (Try Demo)
-
Query statement
* | select sum(body_bytes_sent) as net_out, sum(request_length) as net_in, date_format(date_trunc('hour', __time__), '%m-%d %H:%i') as time group by date_format(date_trunc('hour', __time__), '%m-%d %H:%i') order by time limit 10000 -
Results
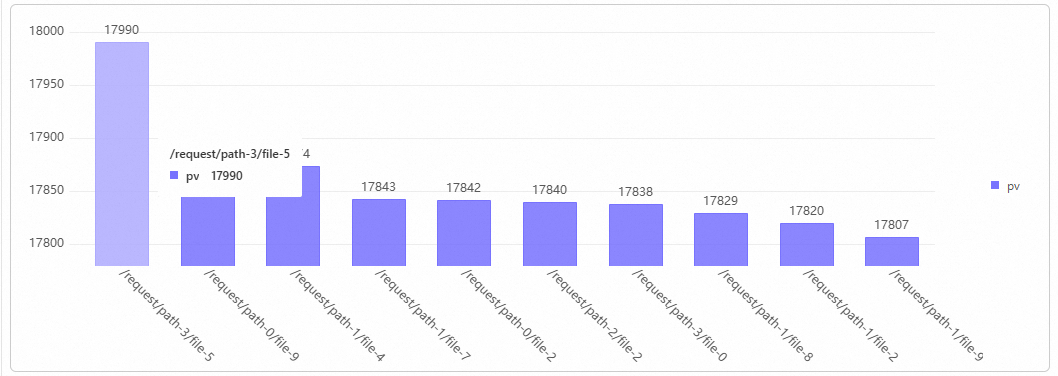
Example 4. Query the top 10 most accessed URLs in NGINX
Uses the split_part function to split request_uri by ?. The first array element is the request path. Groups by path with GROUP BY, counts visits with the count function, and sorts by ORDER BY DESC. Results display in a column chart. (Try Demo)
-
Query statement
* | select count(1) as pv, split_part(request_uri, '?', 1) as path group by path order by pv desc limit 10 -
Results
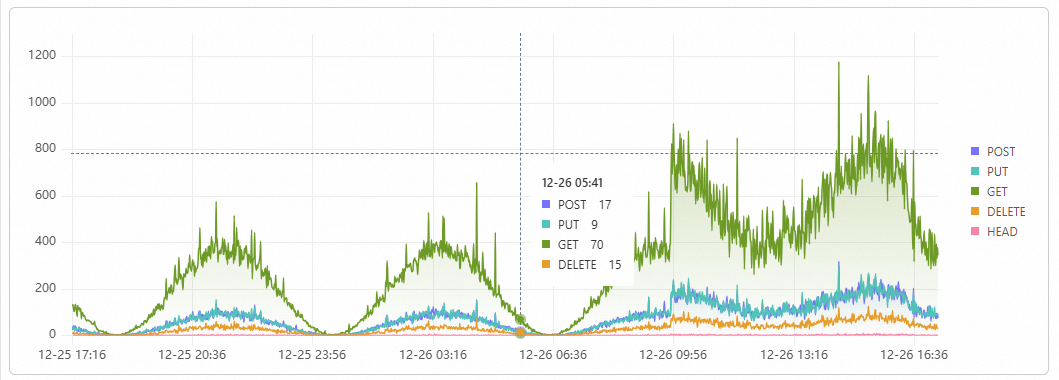
Example 5. Query request method categories and PV trends
Uses date_trunc to align timestamps to the minute, groups by time and request_method to calculate PV, then sorts by time. Results display as a stacked area chart with time on the X-axis, PV on the Y-axis, and request_method as the series. (Try Demo)
-
Query statement
* | select date_format(date_trunc('minute', __time__), '%m-%d %H:%i') as t, request_method, count(*) as pv group by t, request_method order by t asc limit 10000 -
Results
Example 6. Compare today's and yesterday's PV
Uses the count function for today's PVs and the compare function for day-over-day comparison. (Demo)
-
Query statement
* | select diff [1] as today, round((diff [3] -1.0) * 100, 2) as growth FROM ( SELECT compare(pv, 86400) as diff FROM ( SELECT COUNT(1) as pv FROM log ) ) -
Results

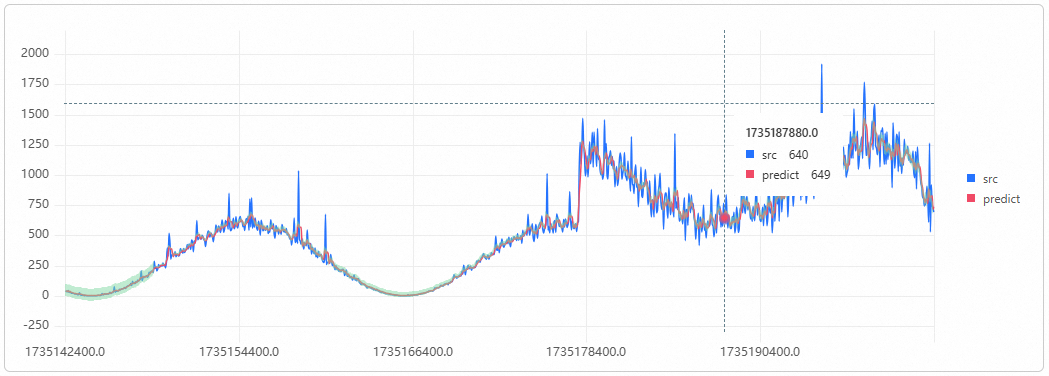
Example 7. Forecast the number of PVs based on NGINX access logs
The expression time - time % 60 aligns timestamps to the minute as stamp. The query groups by stamp with group by and counts events per minute using the count function. This subquery feeds the ts_predicate_simple function to forecast six data points. Results display as a time series chart. (Try Demo)
-
Query statement
* | select ts_predicate_simple(stamp, value, 6) from ( select __time__ - __time__ % 60 as stamp, COUNT(1) as value from log GROUP BY stamp order by stamp ) LIMIT 1000 -
Results
Example 8. Aggregate and rank requests by user agent
Groups by http_user_agent to count requests and sum response traffic. Uses the round function to convert byte values to MB. A case when expression classifies status codes into 2xx, 3xx, 4xx, and 5xx and calculates each percentage. Results display in a table. (Try Demo)
-
Query statement
* |
select
  http_user_agent as "User agent",
  count(*) as pv,
  round(sum(request_length) / 1024.0 / 1024, 2) as "Request traffic (MB)",
  round(sum(body_bytes_sent) / 1024.0 / 1024, 2) as "Response traffic (MB)",
  round(
    sum(
      case
        when status >= 200
        and status < 300 then 1
        else 0
      end
    ) * 100.0 / count(1),
    6
  ) as "Percentage of status code 2xx (%)",
  round(
    sum(
      case
        when status >= 300
        and status < 400 then 1
        else 0
      end
    ) * 100.0 / count(1),
    6
  ) as "Percentage of status code 3xx (%)",
  round(
    sum(
      case
        when status >= 400
        and status < 500 then 1
        else 0
      end
    ) * 100.0 / count(1),
    6
  ) as "Percentage of status code 4xx (%)",
  round(
    sum(
      case
        when status >= 500
        and status < 600 then 1
        else 0
      end
    ) * 100.0 / count(1),
    6
  ) as "Percentage of status code 5xx (%)"
group by
  "User agent"
order by
  pv desc
limit
  100
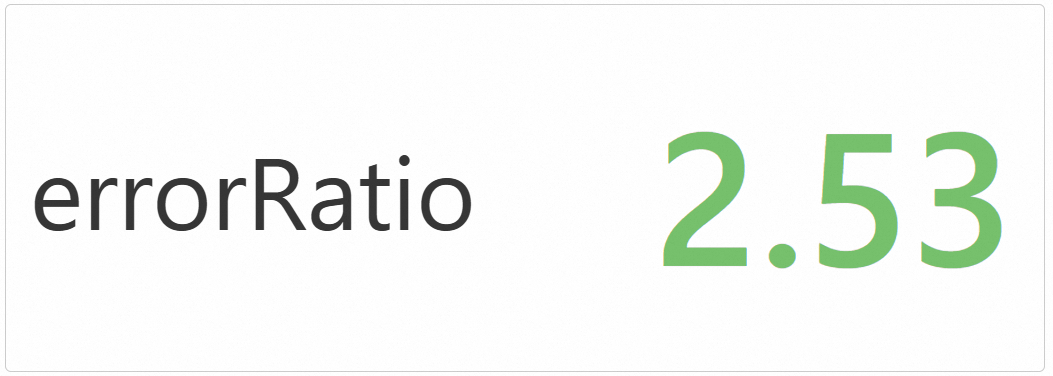
Example 9. Calculate the error request ratio in NGINX logs
Counts requests with status codes 400 and above, divides by total requests to get the error ratio. Results display in a statistical chart. (Demo)
-
Query statement
* | select round((errorCount * 100.0 / totalCount), 2) as errorRatio from ( select sum( case when status >= 400 then 1 else 0 end ) as errorCount, count(1) as totalCount from log ) -
Results