The completely accurate mode ensures precise, complete query results by allowing queries to run longer instead of being truncated when resource limits are reached.
Limitations
The completely accurate mode is not supported for the following features:
How it works
The completely accurate mode converts various resource constraints, such as I/O and CPU, into a single time-based limit. If a query encounters a resource limit, the system throttles it to a sustainable rate instead of terminating it, allowing it to run to completion or until the timeout is reached. The mode uses task allocation in isolated resource pools, user-based queue prioritization, and load balancing to schedule resources efficiently.

Standard queries run in a standard compute pool and are immediately truncated when a resource limit is reached, which can lead to inaccurate results. With the completely accurate mode enabled, queries run in a dedicated compute pool where the system keeps the task running at a sustainable rate until all data is loaded and the computation is complete.

Prerequisites
A Standard logstore is created. For more information, see Create a basic Logstore.
-
Logs are collected. For more information, see Data collection.
-
Indexes are configured. For more information, see Configure indexes.
Procedure
You can enable the completely accurate mode for individual query and analysis operations within a specific Logstore.
You can configure the maximum timeout for the completely accurate mode by using the console, API, or SDK. The maximum timeout for an analytic statement is 55 seconds.
Console
Log on to the Simple Log Service console.
In the Projects section, click the one you want.

On the tab, click the logstore you want.

-
Click
 > Completely Accurate.Important
You can adjust the timeout by setting the
query_max_run_timeparameter.For example, if your analytic statement is
* | select count(*) as pv, you can addset session query_max_run_time=10s;to the statement. The full analytic statement becomes* | set session query_max_run_time=10s; select count(*) as pv.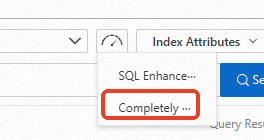
API
-
GetLogs (returns uncompressed results) - Queries log data in a Logstore
-
Parameter:
queryFor example, the analytic statement is
* | select count(*) as pv.-
Enable completely accurate mode: Prepend
set session allow_incomplete=false;to your analytic statement. For example,* | select count(*) as pvbecomes* | set session allow_incomplete=false; select count(*) as pv. -
Set the query analysis timeout: Add
set session query_max_run_time=10s;to the analysis statement. This sets the maximum execution time to10s. The analysis statement is:* | set session allow_incomplete=false; select count(*) as pv. -
To enable completely accurate mode and set a timeout, prepend the session commands to your analytic statement. For example:
* | set session allow_incomplete=false; set session query_max_run_time=10s;select count(*) as pv.
-
-
-
GetLogsV2 (returns compressed results) - Queries log data in a Logstore
-
Parameter:
queryFor example, the analytic statement is
* | select count(*) as pv.-
Enable completely accurate mode: Prepend
set session allow_incomplete=false;to your analytic statement. For example,* | select count(*) as pvbecomes* | set session allow_incomplete=false; select count(*) as pv. -
Set the query analysis timeout: Add
set session query_max_run_time=10s;to the analysis statement. This sets the maximum execution time to10s. The analysis statement is:* | set session allow_incomplete=false; select count(*) as pv. -
To enable completely accurate mode and set a timeout, prepend the session commands to your analytic statement. For example:
* | set session allow_incomplete=false; set session query_max_run_time=10s;select count(*) as pv.
-
-
SDK
This section uses the Simple Log Service SDK for Java as an example.
Prerequisites
You have installed the Simple Log Service SDK for Java. For more information, see Install the Simple Log Service SDK for Java.
-
GetLogs() method
-
Parameter:
queryFor example, the analytic statement is
* | select count(*) as pv.-
Enable completely accurate mode: Prepend
set session allow_incomplete=false;to your analytic statement. For example,* | select count(*) as pvbecomes* | set session allow_incomplete=false; select count(*) as pv. -
Set the query analysis timeout: Add
set session query_max_run_time=10s;to the analysis statement. This sets the maximum execution time to10s. The analysis statement is:* | set session allow_incomplete=false; select count(*) as pv. -
To enable completely accurate mode and set a timeout, prepend the session commands to your analytic statement. For example:
* | set session allow_incomplete=false; set session query_max_run_time=10s;select count(*) as pv.
-
-
Parameter:
session-
Enable completely accurate mode:
request.SetSession("allow_incomplete=false");. -
Set the query timeout:
request.SetSession("query_max_run_time=10s");. -
Enable completely accurate mode and set a timeout:
request.SetSession("allow_incomplete=false;query_max_run_time=10s").
-
import com.aliyun.openservices.log.Client; import com.aliyun.openservices.log.exception.LogException; import com.aliyun.openservices.log.request.GetLogsRequest; import com.aliyun.openservices.log.response.GetLogsResponse; public class CrearteLogStore { public static void main(String[] args) throws LogException { // This example obtains the AccessKey ID and AccessKey Secret from environment variables. String accessId = System.getenv("ALIBABA_CLOUD_ACCESS_KEY_ID"); String accessKey = System.getenv("ALIBABA_CLOUD_ACCESS_KEY_SECRET"); // Set the endpoint for Simple Log Service. This example uses the endpoint for the China (Beijing) region. Replace it with your actual endpoint. String host = "https://cn-beijing.log.aliyuncs.com"; // Create a Simple Log Service client. Client client = new Client(host, accessId, accessKey); // Specify the Project name. String projectName = "aliyun-test-project"; // Specify the Logstore name. String logstore = "request_log"; String query = "* | SELECT count(0)"; int from = (int)(System.currentTimeMillis()/1000) - 60; int to = (int)(System.currentTimeMillis()/1000); GetLogsRequest request = new GetLogsRequest(projectName, logstore, from, to, "", query); request.SetSession("allow_incomplete=false;query_max_run_time=10s"); GetLogsResponse response = client.GetLogs(request); System.out.println(response.getCpuSec()); } } -
FAQ
-
How do I check the CPU time?
After running a query, hover over Analysis Results to view the CPU time. The Consumed CPU Time field in the upper-right statistics panel shows the CPU time consumed, in seconds.
-
Cost of a Dedicated SQL query
Cost varies by data volume and query complexity. The following table shows examples.
Query statement
Data volume (rows)
Cost per execution (USD)
* | select avg(double_0) from stress_s1_mil14 billion
0.004435
* | select avg(double_0), sum(double_0), max(double_0), min(double_0), count(double_0) from stress_s1_mil14 billion
0.006504
* | select avg(double_0), sum(double_1), max(double_2), min(double_3), count(double_4) from stress_s1_mil14 billion
0.013600
* | select key_0 , avg(double_0) as pv from stress_s1_mil1 group by key_0 order by pv desc limit 10004 billion
0.011826
* | select long_0, avg(double_0) as pv from stress_s1_mil1 group by long_0 order by pv desc limit 10004 billion
0.011087
* | select long_0, long_1, avg(double_0) as pv from stress_s1_mil1 group by long_0,long_1 order by pv desc limit 1000300 million
0.010791
* | select avg(double_0) from stress_s1_mil1 where key_0='key_987'4 billion
0.00007