Operation Center provides the following modules: Overview, RealTime Task Maintenance, Cycle Task Maintenance, Manual Task Maintenance, Alarm, Intelligent Diagnosis, Resource, and Engine Maintenance. You can use these modules to perform O&M operations on nodes, engines, and resources.

Modules of Operation Center

After you develop nodes in DataStudio and commit and deploy the nodes to the production environment, you can perform O&M operations on the nodes. On the Cycle Task Maintenance and Manual Task Maintenance pages, you can view auto triggered nodes, data backfill instances, test instances, and manually triggered nodes. You can also view the running details of auto and manually triggered nodes, and monitor the status of the nodes and the resources used by the nodes. On the RealTime Task Maintenance page, you can manage the running of real-time nodes, view the running details of these nodes, and configure alert rules for the nodes. On the Workbench Overview tab of the Overview page, you can view key O&M metrics of auto and manually triggered nodes. On the Data Integration tab of the Overview page, you can perform O&M operations on batch and real-time synchronization nodes. Logic of Operation Center
The following table describes how to use the modules in Operation Center.
Module Description Supported environment
View the statistics on the Overview page This module displays the key O&M metrics of nodes in charts and tables. On the Workbench Overview tab of the Overview page, you can view key O&M metrics of batch synchronization nodes. On the Data Integration tab of the Overview page, you can perform O&M operations on batch and real-time synchronization nodes. This module is not available in Operation Center in the development environment.
Manage real-time synchronization nodes This module allows you to start, stop, and undeploy real-time nodes. This module also allows you to configure alert rules for the nodes. -
View and manage auto triggered nodes This module displays the auto triggered nodes that are committed to the scheduling system and the auto triggered node instances that are generated for the nodes. By default, the Cycle Task page displays all existing auto triggered nodes. On this page, you can modify information such as the resource group or owner of an auto triggered node.

DataWorks automatically generates auto triggered node instances that are scheduled to run on the next day for an auto triggered node every night. You can also click Patch Data or Test in the Actions column of an auto triggered node to generate a data backfill instance and a test instance. You can view the status of the generated data backfill instance and test instance.

Nodes cannot be automatically scheduled to generate auto triggered node instances in Operation Center in the development environment.
Manual Task Maintenance This module displays the manually triggered nodes or workflows that are committed to the scheduling system and the manually triggered instances that are generated after the nodes or workflows are manually triggered. By default, the Manual Task page displays all existing manually triggered nodes. On this page, you can modify information such as the resource group or owner of a manually triggered node.

On the Manual Task page, you can manually trigger nodes to run after you set Type to Manually Triggered Workflow. Then, the nodes generate manually triggered node instances. You can view the running details of the generated manually triggered node instances.

-
Alarm
  • Monitoring objects: auto triggered nodes, real-time computing nodes, and resource usage

    You can configure alert rules for auto triggered nodes. You can also monitor the status of auto triggered node instances, usage of exclusive resource groups, and the status of real-time computing nodes.

  • Monitoring methods: custom alert rules and intelligent baseline

    This module allows you to configure alert rules for a specified object, such as a node, a workflow, a workspace, a baseline, a real-time computing node, an exclusive resource group for scheduling, or an exclusive resource group for Data Integration. This module also allows you to configure an intelligent baseline for an entire line-of-business. The system sends alert notifications by using the method that you specify.

  • Notification methods: text messages, emails, DingTalk group messages, and webhook URLs. The system sends alert notifications to on-duty staff based on a shift schedule at the specified point in time.
    Note

    Alert notifications can be sent by text message only in the Singapore, Malaysia (Kuala Lumpur), and Germany (Frankfurt) regions.

This module is not available in Operation Center in the development environment.
Resource O&M This module monitors the usage of exclusive resource groups for scheduling and exclusive resource groups for Data Integration and automatically performs O&M operations. You can view the nodes that are using or are waiting to use resource groups, and the trend of the resource group usage. -
Use the engine O&M feature This module is available only for the E-MapReduce (EMR) compute engine. A DataWorks node instance that runs on the EMR compute engine contains multiple EMR jobs. These EMR jobs are run based on a specific sequence. You can use the Engine Maintenance module of DataWorks to view details about each EMR job, and identify and remove the jobs that fail to be run. This prevents failed jobs from affecting the running of both the DataWorks node instance to which the jobs belong and the descendant nodes of the node that generates the node instance. This module is not available in Operation Center in the development environment.
Intelligent diagnosis This module helps you track the running of nodes and identify issues. This module is not available in Operation Center in the development environment.
If you want to use Operation Center of DataWorks, take note of the following items:
  • In a DataWorks workspace in standard mode, you can click the switch icon to the right of Operation Center in the top navigation bar to switch between the development and production environments.
  • Automatic scheduling is supported only in Operation Center in the production environment. You can view auto triggered node instances only on the Cycle Instance page in Operation Center in the production environment.

Running logic of production nodes

Production nodes include auto triggered nodes, manually triggered nodes, and real-time nodes.

  • Auto triggered nodes

    After you commit and deploy an auto triggered node to Operation Center in the production environment, you can perform O&M operations on the node in Operation Center. On the Cycle Task page, you can view the auto triggered node. DataWorks automatically generates auto triggered node instances that are scheduled to run on the next day for the auto triggered node every night. You can also click Patch Data or Test in the Actions column of an auto triggered node to generate a data backfill instance and a test instance.

    Instance type Scenario Relationship with an auto triggered node

    (How an instance is generated)

    Instance trigger method

    (How an instance is triggered to run)

    Node running condition
    Auto triggered node instances You want to perform periodic extract, transform, load (ETL) operations. Every night, DataWorks automatically generates auto triggered node instances that are scheduled to run on the next day based on the snapshot information of an auto triggered node at the specified point in time.
    Note Nodes cannot be automatically scheduled to generate auto triggered node instances in Operation Center in the development environment.
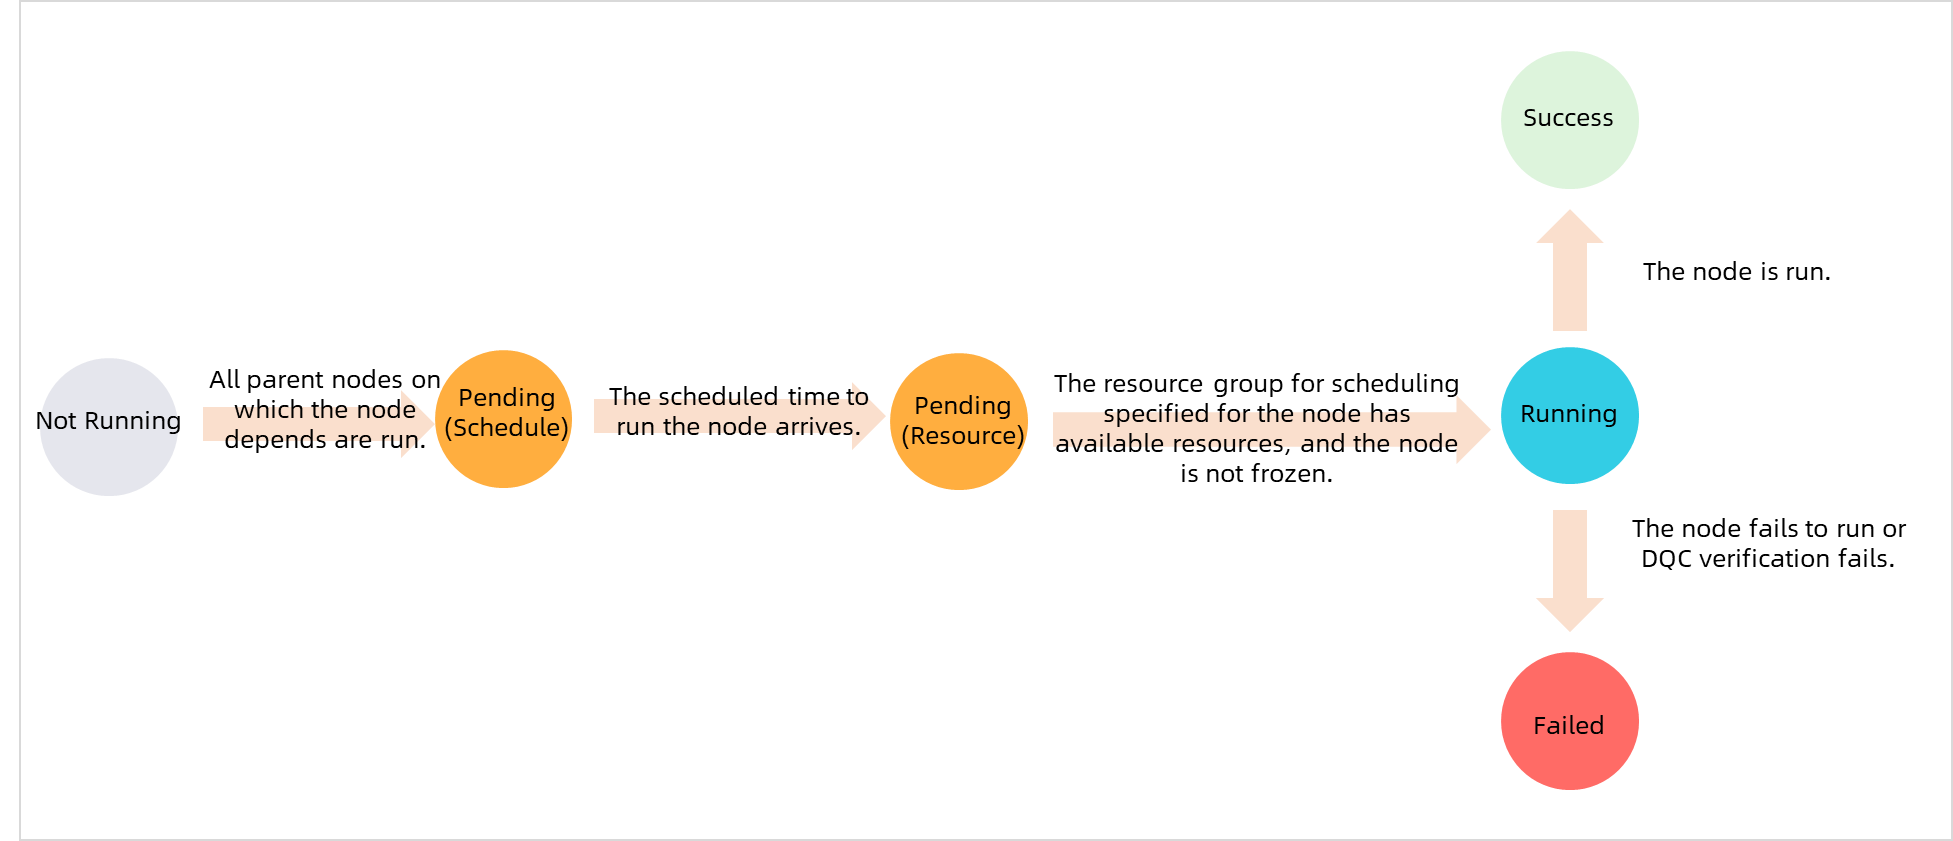
    DataWorks automatically triggers an auto triggered node instance to run. An auto triggered node is used as an example. The following prerequisites must be met before an auto triggered node starts to run:
    • All the instances of the ancestor nodes on which the auto triggered node depends are successfully run.
    • The point in time when the auto triggered node is scheduled to run is reached.
    • The scheduling resources that are required when the auto triggered node is run are sufficient.
    • The auto triggered node is not frozen.
    Flowchart
    Note In Operation Center, the color of an instance varies based on the status of the instance. For more information, see Appendix: Instance status.
    Data backfill instance You want to backfill data of a period of time in the past or in the future for the current node and descendant nodes of the current node. This means that you must perform ETL operations on the data of that period of time. You must manually backfill data for the current auto triggered node to generate data backfill instances for the node. After you backfill data, the data backfill instances are generated and triggered to run.
    Test an auto triggered node and view test instances generated for the node You want to test the current auto triggered node to check whether the node can be run as expected.
    Note The test instance of the current auto triggered node is run based on the code logic of the current node.
    You must manually test the current auto triggered node to generate test instances for the node. After you perform the test, the test instances are generated and triggered to run.

    You can view the status of auto triggered node instances on the Cycle Instance page, the status of data backfill instances on the Patch Data page, and the status of test instances on the Test Instance page. You can check whether the data output of an instance is normal based on the status of the instance. For more information about instance statuses, see Appendix: Instance status.

    Note
    • Auto triggered node instances are automatically generated in the period of time from 23:30 to 24:00 every night for an auto triggered node. Test instances are generated and run at the time when you test an auto triggered node. Data backfill instances are generated and run at the time when you backfill data for an auto triggered node. Therefore, test and data backfill instances are generated based on the latest configurations of an auto triggered node.
    • After you deploy an auto triggered node to the production environment, auto triggered node instances that are scheduled to run on the next day are automatically generated at night on the current day for the auto triggered node by default. If you want auto triggered node instances to be immediately run after an auto triggered node is deployed, you can change the value of the Instance Generation Mode parameter to Immediately After Deployment in the Schedule section on the Properties tab when you configure scheduling parameters for the auto triggered node. For more information, see Configure time properties.
  • Manually triggered nodes

    After you commit and deploy a manually triggered node or workflow to Operation Center in the production environment, you can perform O&M operations on the manually triggered node or workflow in Operation Center. On the Manual Task page, you can view the manually triggered node or workflow. If you want to run the manually triggered node or workflow, click Run in the Actions column. Manually triggered node instances are generated for the manually triggered node or workflow. You can view details about the manually triggered node instances on the Manual Instance page.

  • Real-time nodes

    After you commit and deploy a real-time node to Operation Center in the production environment, you can perform O&M operations on the real-time node in Operation Center. On the Real Time DI page, you can perform operations on real-time synchronization nodes. For example, you can start or undeploy real-time synchronization nodes, and then configure alert rules for the nodes. On the Stream Task page, you can manage real-time computing nodes. For more information, see Manage real-time computing nodes and Manage real-time synchronization nodes.

Intelligent Monitoring: Monitor node status

Intelligent Monitoring allows you to monitor the status of auto triggered nodes, auto triggered node instances of auto triggered nodes, and real-time computing nodes. After the custom alert rule or intelligent baseline that you configured is triggered, the system sends alert notifications to you by using the specified notification method such as emails, text messages, or DingTalk group messages. This way, you can handle exceptions at the earliest opportunity.
  • Auto triggered nodes

    DataWorks automatically generates auto triggered node instances that are scheduled to run on the next day for an auto triggered node every night. DataWorks provides built-in alert rules to periodically monitor and scan auto triggered nodes and ensure that auto triggered node instances of the auto triggered nodes are generated and scheduled as expected. If an exception occurs, DataWorks automatically sends an alert notification.

    DataWorks provides built-in global alert rules to monitor the status of auto triggered nodes. The built-in global alert rules are not workspace-level alert rules. Alert rules include the isolated node alert rule and cyclic node alert rule.

    Note
    • DataWorks scans the status of auto triggered nodes at 9:00:00, 12:00:00, and 16:00:00 every day. If an exception is detected, an alert notification is automatically sent by using the specified method. However, exceptions that are generated within the 10 minutes before a scan are not included in the current scanning cycle. These exceptions are included in the subsequent scanning cycle.
    • Global alert rules are built-in rules that are automatically created in DataWorks. If an alert is triggered based on a global alert rule, an alert notification is sent to a node owner by text message or email by default. On the Rule Management page, you can change the recipient of alert notifications for global alert rules.
    • Isolated node alert rule
      An isolated node is a node that does not have an ancestor node. No ancestor node appears when you right-click an isolated node and select Show Ancestor Nodes on the Cycle Task or Cycle Instance page. This type of node cannot be triggered in the automatic scheduling scenario. If an isolated node has a large number of descendant nodes, the descendant nodes may fail to be run. An alert notification is automatically sent when an isolated node is generated. We recommend that you handle the alert at the earliest opportunity.
      Note In DataWorks, except the root node in a workspace, the auto triggered node that you created must have ancestor nodes. If you do not configure ancestor nodes for the auto triggered node, you cannot schedule the auto triggered node.
    • Cyclic node alert rule

      If a node serves as both the ancestor node and descendant node of another node, a node dependency loop is formed. This type of node cannot be triggered in the automatic scheduling scenario. An alert notification is automatically sent after a cyclic node dependency loop is formed. We recommend that you handle the alert at the earliest opportunity.

  • Auto triggered node instances

    In DataWorks, auto triggered node instances are generated when an auto triggered node is periodically scheduled. You can configure custom alert rules for auto triggered nodes, and then monitor the status of auto triggered node instances of the nodes based on the configured custom alert rules. You can configure a custom alert rule for a specified object. You can also configure an intelligent baseline for important nodes.

    • Custom alert rules

      You can configure a custom alert rule for a specified object.

      You can specify that an alert notification is sent if a node of a specified object such as baseline, workspace, or workflow, is in one of the following states: Completed, Uncompleted, Error, Uncompleted in Cycle, Overtime, and The error persists after the node automatically reruns. You can specify that an alert notification is sent if an error occurs when a real-time computing node runs. Alert notifications can be sent to a node owner, a specified owner, or on-duty staff based on a shift schedule by text message, email, DingTalk chatbot, or webhook URL. For more information, see Create a custom alert rule.

    • Intelligent baseline

      You can configure the priority of a baseline to ensure that nodes in this baseline are scheduled and data of the nodes is generated on time.

      If an auto triggered node is important and the dependencies between the auto triggered node and its ancestor nodes are complex, you can move the auto triggered node to a specific baseline. If data of an auto triggered node in a baseline is not generated within the specified period of time, the system can quickly locate the auto triggered node instance that blocks the auto triggered node from generating data, and then sends an alert notification at the earliest opportunity. This way, the node data can be generated within the specified period of time. If an auto triggered node in a baseline or an ancestor node of the auto triggered node has an exception or slows down, you receive an alert notification. Alerts are classified into baseline alerts and event alerts. Alert notifications can be sent to a node owner, a specified owner, or on-duty staff based on a shift schedule by text message, email, DingTalk chatbot, or webhook URL. For more information about how to use a baseline, see Manage baselines.

      • Baseline alerts

        If a baseline predicts that auto triggered nodes in the baseline cannot be completed within the specified period of time based on the parameters such as committed time and margin threshold, a baseline alert is triggered.

      • Event alerts

        If an auto triggered node in a baseline or an ancestor node of the auto triggered node has an exception or slows down, you receive an event alert notification.

    • Real-time computing nodes

      You can configure custom alert rules for real-time computing nodes, and then monitor the status of the nodes based on the configured rules. After an error occurs for a real-time computing node, the system sends an alert notification to a node owner, a specified owner, or on-duty staff based on a shift schedule by using the method that you specify, such as text messages, emails, DingTalk chatbots, or webhook URLs. For more information, see Create a custom alert rule.

Automatic: Monitor and perform O&M operations on resources used by nodes

You can create a custom alert rule on the Rule Management page of the Alarm page for an exclusive resource group, and specify the usage threshold of the exclusive resource group and the number of instances that are waiting for the exclusive resource group. After the custom alert rule that you configured is triggered, the system sends an alert notification to a node owner or a specified owner by text message, email, or DingTalk chatbot based on the automatic O&M feature. For more information about custom alert rules, see Create a custom alert rule.

The automatic O&M feature allows you to create a custom alert rule for an exclusive resource group, and then create an O&M rule for the exclusive resource group on the Rule Management tab of the Automatic page. This way, the specified O&M operation, such as the operation to terminate an instance that is running, is performed on the exclusive resource group, and important nodes that use the exclusive resource group can be run as expected. For more information, see Automated O&M.

Intelligent Diagnosis: Troubleshoot node running issues

  • Prerequisites for an auto triggered node to successfully run
    After you deploy an auto triggered node to Operation Center, the following prerequisites must be met before the auto triggered node starts to run:
    Note If the auto triggered node fails to start to run, you can use Intelligent Diagnosis to quickly identify and troubleshoot issues. For more information, see Intelligent diagnosis.
    1. All the instances of the ancestor nodes on which the auto triggered node depends are successfully run.
      Scheduling dependencies ensure that an auto triggered node can obtain valid data from its ancestor nodes. An auto triggered node obtains data only after DataWorks detects that its ancestor nodes are successfully run and generate the latest table data. This prevents the auto triggered node from obtaining invalid data before its ancestor nodes generate table data. If an auto triggered node has ancestor nodes, the node can be successfully run only after all instances of the ancestor nodes are successfully run. For more information, see Logic of same-cycle scheduling dependencies.
      Note
      • If the status of an ancestor node is not running, failed, frozen (suspended), or running, the ancestor node is considered not successfully run.
      • If a node is frozen, its descendant nodes are blocked from running.
    2. The point in time when the auto triggered node is scheduled to run is reached.
      In the Schedule section on the Properties tab, you can set the Run At parameter when you configure scheduling properties for the auto triggered node.
      • If all the ancestor nodes on which the auto triggered node depends are successfully run before the scheduling time that you specify, the auto triggered node starts to run when the scheduling time arrives.
      • If all the ancestor nodes on which the auto triggered node depends are successfully run after the scheduling time that you specify, the auto triggered node is immediately run if the scheduling resources that are required by the auto triggered node are sufficient.
    3. The scheduling resources that are required when the auto triggered node is run are sufficient.

      In the Resource Group section on the Properties tab, you can set the Resource Group parameter to an exclusive resource group for scheduling when you configure scheduling properties for the auto triggered node. On the Cycle Task page in Operation Center, you can change the exclusive resource group for scheduling that you specified on the Properties tab.

      If all the ancestor nodes on which the auto triggered node depends are successfully run and the scheduling time that you specify arrives, but no resources are available in the exclusive resource group for scheduling that you specified for the auto triggered node, the auto triggered node does not start to run until the resource is released.

    4. The auto triggered node is not frozen.

      If the preceding prerequisites are met but the auto triggered node is frozen, the auto triggered node and its descendant nodes cannot be run. For more information about how to unfreeze an auto triggered node, see Node freezing and unfreezing.

  • Diagnosis of node running failure

    You can use Intelligent Diagnosis and the upstream analysis feature of a directed acyclic graph (DAG) to diagnose nodes that fail to start.

    If a node fails to start, you can use this feature to check whether the prerequisites for the node to run are met. If a node fails to run, you can use this feature to analyze the cause and obtain diagnostic suggestions.

    Capabilities of Intelligent Diagnosis:
    • This allows you to track the running of nodes and identify issues. You can view the following information: the status of the ancestor nodes of a node, the scheduling time that you specified for the node, the details about the scheduling resources, including the trend of resource usage of resource groups for scheduling for the node and the number of nodes that are waiting for resources in resource groups for scheduling, and the nodes that occupy resources in resource groups for scheduling. You can also view the running details about the node. The details provide cause analysis and diagnostic advice when the node fails to run.
    • You can view the basic information about an instance and the following key points of time of the instance: the point in time when each ancestor node of the node that generates the instance is completed, the scheduling time that you specified for the node that generates the instance, the point in time when the node starts to wait for scheduling resources, the point in time when the node starts to run, and the point in time when the node successfully runs.
    • You can view the baselines for which a node fails to generate data and the status of the instances that are generated by the node in the baseline on the current day.
    • You can view the average running duration of a node, the point in time when the node starts to run, the trend chart of the time consumed by the node to wait for resources, and the instances that are generated for the node on the current day, the previous day, and the day before the previous day.
    For more information about Intelligent Diagnosis, see Intelligent diagnosis.

Data Quality: Monitor table data generated by nodes

You can use Data Quality to monitor data of tables that are generated by auto triggered node instances, data backfill instances, and test instances.

In the production environment, auto triggered node instances are generated by an auto triggered node. Data backfill instances are generated after you click Patch Data in the Actions column of an auto triggered node. Test instances are generated after you click Test in the Actions column of an auto triggered node. You can configure data quality monitoring rules for auto triggered nodes to monitor the status of the generated instances, including auto triggered node instances, data backfill instances, and test instances, and check whether data of tables generated by the instances is valid.

Data Quality uses the partition filter expression that you specified for a table to search for an auto triggered node that generates tables whose partitions match the expression. After you associate a data quality monitoring rule with an auto triggered node, the data quality monitoring rule is triggered to verify the node after the node is run. In Operation Center, table data is generated after test instances, data backfill instances, or auto triggered node instances are run or an auto triggered node is rerun. You can configure a strong rule to terminate an auto triggered node after it fails. This prevents dirty data records from blocking descendant nodes. You can subscribe to data quality monitoring rules to get notified at the earliest opportunity if an exception is detected in table data generated by an auto triggered node. For more information, see Data Quality.

Appendix: Instance status

In Operation Center, different colors and icons are used to mark the stage and status of an instance. The following table describes the mappings between icons in different colors and states of instances. For more information about the prerequisites for a node to run, see Intelligent Diagnosis: Troubleshoot node running issues.

No. Status Icon Flowchart
1 Successful Successful Flowchart
2 Not running Not running
3 Failed Failed
4 Running Running
5 Waiting Waiting
6 Suspended or frozen Suspended or frozen