The Operations and Maintenance (O&M) dashboard displays the O&M stability assessment for auto triggered tasks, key O&M metrics, an overview of schedule resource usage, and the running details of one-time tasks and data integration sync tasks. This dashboard helps you obtain a high-level overview of all tasks in your workspace, quickly find and handle abnormal tasks, and improve your O&M efficiency.
Limitations
-
The O&M dashboard is not supported in the development environment of a standard mode workspace. To switch between the Production and Development environments, click the toggle in the top menu bar of the Operation Center.
-
Auto Triggered Task tab: Covers only auto triggered tasks and their instances.
-
One-time Task tab: Covers only manually triggered workflows and their inner node instances.
-
Data Integration Task tab: Covers only offline and real-time data integration sync tasks.
Workspace scope
The data available depends on the workspace scope you select:
|
Scope |
What you can view |
|
Specific project |
O&M overview for the selected workspace, including both the workspace overview and data integration sync tasks. |
|
All Projects |
O&M overview of all workspaces in the current account. Data Integration sync task details are not available in this view. |
Open the O&M dashboard
Log on to the DataWorks console. In the top navigation bar, select the region. In the left-side navigation pane, choose Data Development and O&M > Operation Center. Select the workspace from the drop-down list and click Go to Operation Center.
View O&M information for auto triggered tasks
On the Auto Triggered Task tab, the dashboard surfaces five areas: O&M stability assessment, key concerns, recurring instance status distribution, recurring instance completion status, and scheduling resource group usage.
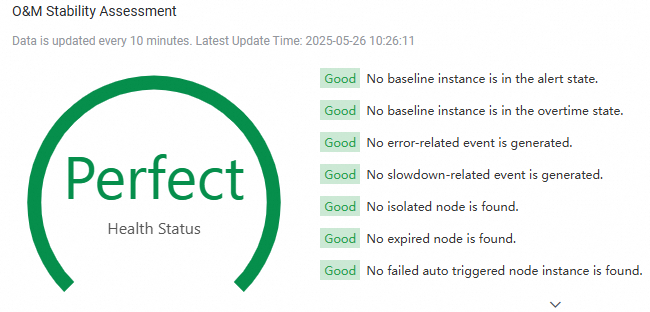
O&M stability assessment
Workspace stability is scored based on the overall running status of tasks.
|
Workspace |
Single workspace |
All my workspaces |
|
Stability diagram |
|
|
|
Stability description |
Health status has four levels: Excellent, Good, Fair, and Poor. A high-risk or low-risk tag indicates poor health that requires immediate optimization. |
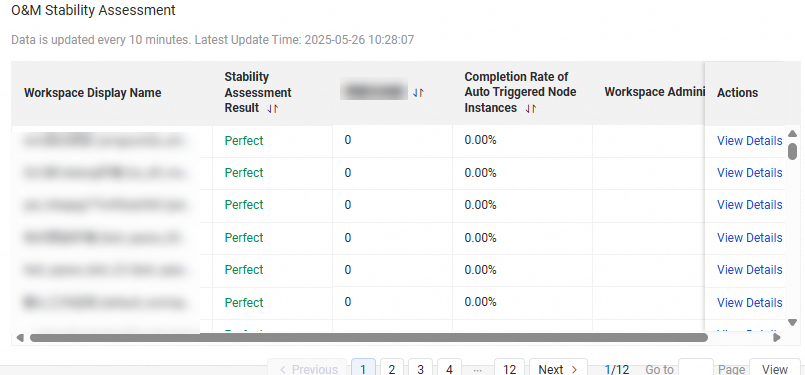
Switch to the All my workspaces view to see the O&M stability, recurring instance count, and completion status across all workspaces you have joined. Click View Details in the Operation column for a specific workspace to drill into its stability details. |
Key concerns
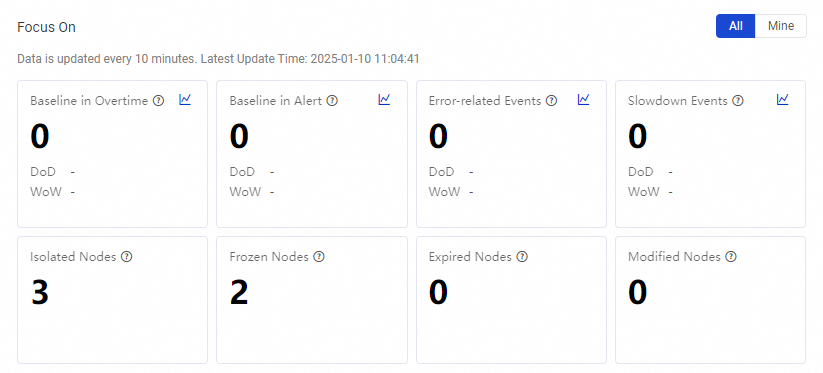
The Key Concerns section aggregates abnormal items based on smart baselines and auto triggered task exceptions. Toggle between the workspace view and the My view to see issues across the entire workspace or only for tasks you own. Address flagged items promptly to prevent downstream impact.
|
Issue type |
Description |
Reference |
|
Baseline instance breach |
Number of baseline instances that exceeded their committed completion time today. A breach means the estimated completion time exceeds the committed time, triggering an alert. |
|
|
Baseline instance warning |
Number of baseline instances with active warnings today. Exceeding the warning margin risks missing committed completion times. |
|
|
Error event |
Number of error events today. When a baseline-monitored task fails, an error event is generated. Failed tasks can block all downstream nodes. |
|
|
Slowdown event |
Number of slowdown events today. A slowdown event is triggered when a baseline-monitored task runs significantly longer than its historical average. |
— |
|
Isolated task |
Number of auto triggered tasks with no upstream dependencies. Isolated nodes cannot be automatically scheduled. |
|
|
Frozen task |
Number of paused auto triggered tasks. Frozen tasks generate instances in the Frozen state, which do not run and block downstream nodes. |
|
|
Expired task |
Number of auto triggered tasks whose scheduling validity period has expired. Expired tasks cannot generate recurring instances. |
— |
|
Modified task |
Number of recurring schedule tasks modified today. Modifications include code changes, scheduling configuration changes, node status changes, and owner changes. Covers both changes published from Data Studio and direct changes made in the production environment. When viewing My tasks, only modifications to nodes you own are counted. |
— |
Recurring instances and auto triggered tasks
|
Section |
Description |
|
Recurring instance status distribution |
Shows the status distribution of recurring instances in the current workspace (or those you own) for a specified data timestamp, reflecting the state at the time of the page request. Click a segment in the pie chart to see the count and percentage for that status. Pay close attention to Failed instances (may block downstream nodes), Frozen instances (will not run and block downstream nodes), and Running slow instances (runtime is more than 15 minutes above the 10-day average; if fewer than 4 historical instances exist, the threshold is 30 minutes). Only Normal tasks are included — dry-run and frozen tasks are excluded. |
|
Recurring instance completion status |
A line chart comparing yesterday's, today's, and the 10-day historical average completion status (successful and not-run instance counts) from 00:00 to 23:00 on the current day. Filter by task type using the selector. Significant deviation between the three lines indicates an anomaly worth investigating. |
|
Recurring instance and auto triggered task trends |
Change trends in the number of auto triggered tasks and recurring instances in the production environment over a specified data timestamp range. Data covers up to the last year. |
|
Auto triggered task distribution |
Distribution of auto triggered tasks by node type and scheduling cycle at the time of the page request. The pie chart merges categories when the number of types exceeds the display limit. In the All my workspaces view, tasks are grouped by workspace instead. |
Scheduling resource group usage
This section shows the resource usage rate — the percentage of resources consumed by instances running on the selected scheduling resource group — and the trend in concurrent running instances over a specified period (up to 7 days).
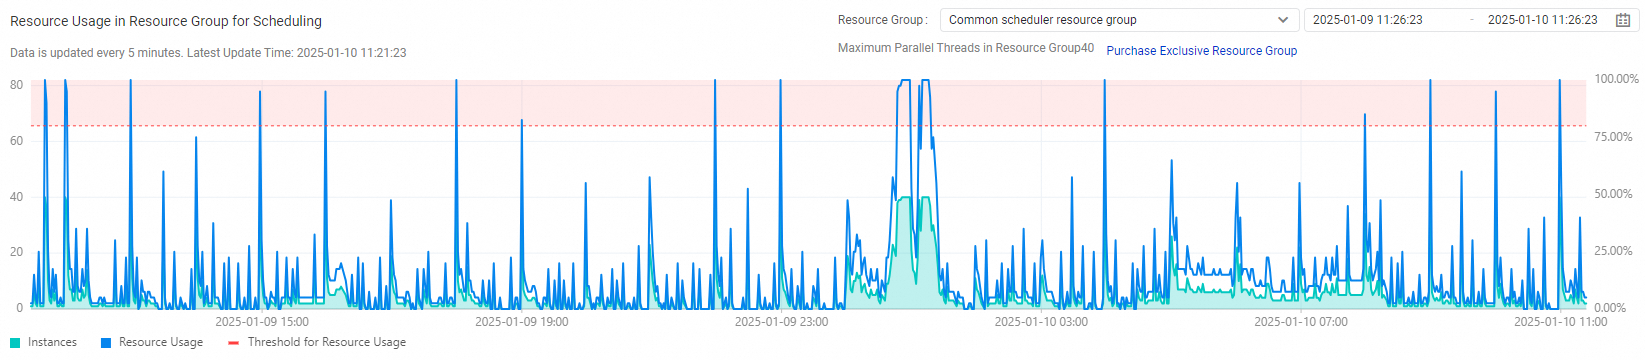
If resource group usage exceeds 80%, scale out the resource group to prevent resource shortages from affecting task execution. Usage statistics are at the resource group level: if the exclusive resource group is shared across multiple workspaces, the chart reflects the total resource usage rate and instance number trend for that resource group across all those workspaces.
Recurring instance runtime and error rankings

Yesterday's recurring instance rankings
Ranks the top 30 recurring instances from the previous day by runtime, resource wait time, and slowdown duration (the difference between yesterday's runtime and the historical average, in descending order). Click an instance ID to open the instance details page and run diagnostics.
Recurring instance error rankings for the last month
Ranks the top 30 recurring instances with the most errors over the last month. Use this list to identify high-error-rate tasks, view task details, and trace root causes.
View O&M information for one-time tasks
On the One-time Task tab, monitor the running status of manually triggered workflows and inner node instances.
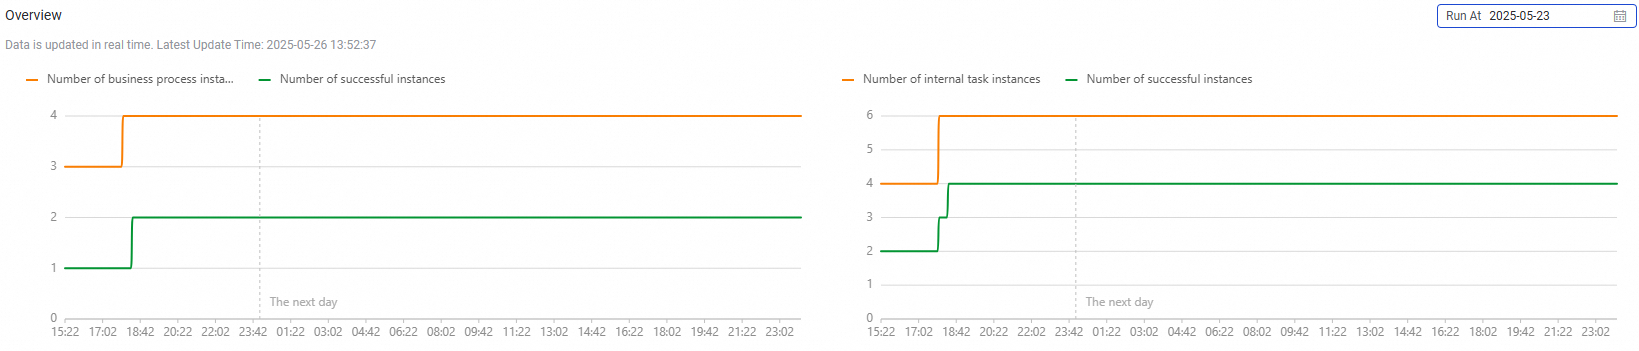
One-time task overview
Shows the total number of manually triggered workflows and inner node instances that have run since a specified date, along with the percentage of successful runs.
Workflow instance status
|
Section |
Description |
|
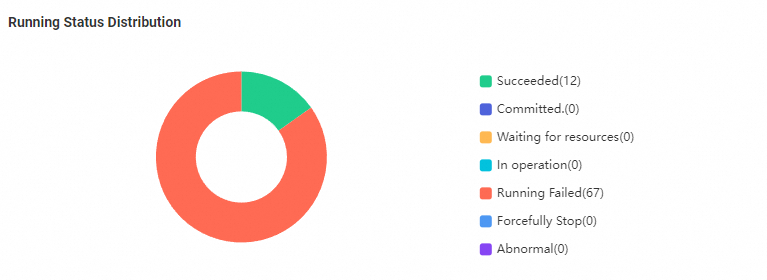
Workflow instance status distribution |
A pie chart showing the status distribution of manually triggered workflow instances for the specified run date (up to 7 days of data). Click a segment to go to the details page for tasks in that state. In the My view, only workflow instances you own are shown. Pay close attention to Failed tasks. |
|
Workflow rankings |
Ranks workflows by runtime and failure rate for the specified run date. Only the top 30 workflows are shown. Click a Task ID to open the Manually Triggered Workflow Instance details page, then check Run Diagnostics for specific instances in the workflow DAG. |
Internal task instance status
|
Section |
Description |
|
Internal Task Distribution |
A real-time pie chart showing the distribution of inner node instances by Node Type and Owner. |
|
Internal Task Leaderboard |
Ranks inner node instances by runtime and failure rate for the specified run date. Only the top 30 instances are shown. Click a Task ID to open the Manually Triggered Workflow Instance details page and view Run Diagnostics for the relevant DAG. |
View O&M information for data integration tasks
On the Data Integration tab, review the O&M overview and resource group usage for data integration sync tasks from Yesterday or Today.
This tab collects O&M statistics only for exclusive resource groups for Data Integration, not for Serverless resource groups. For operations on exclusive resource groups, see Billing for exclusive resource groups for Data Integration. For Serverless resource groups, see Use a Serverless resource group.
Data Integration resource group usage
Shows resource details for all data integration tasks in the current workspace: Running Tasks, Resource Usage, and Expired At. Use this information to decide whether to scale resources based on current usage and task volume.

Data Integration sync task status distribution
A pie chart showing the status distribution of sync tasks in the current workspace. Click a segment to go to the details page for tasks in that state. Prioritize Abnormal and Failed tasks — these typically block downstream task execution.
Offline sync task status
|
Section |
Description |
|
Data synchronization progress |
Total data volume and total traffic usage for offline synchronization within the selected data timestamp. |
|
Data synchronization volume statistics |
Data pull and write curves broken down by data source type for the selected data timestamp. Use this to identify DPI engine tasks with large sync volumes and allocate resources accordingly. |
|
Latest Top 10 rankings |
The 10 most recent Latest Failed Instances and Latest Successful Instances, providing a quick snapshot of current sync task status. Use the error messages to trace and resolve instance failures. |
|
Data synchronization task execution details |
Filter by Commit Time, Task Status, or Task Name to find specific task instances and review their running details. |
Real-time sync task status
|
Section |
Description |
|
Data synchronization overview |
The sum of data speed and record speed across all real-time sync tasks in the current workspace. |
|
Top 10 task latency |
The 10 real-time sync tasks with the highest latency, ranked for quick identification and optimization. |
|
Alert information |
Recent alerts generated by real-time sync tasks, so you can catch and resolve exceptions quickly. |
|
Failover information |
|