Resource O&M lets you monitor the health and usage of the exclusive resource groups that run your DataWorks nodes. When a resource group is overloaded or a node falls behind schedule, this page gives you the usage data and entry points you need to act quickly—without navigating across multiple consoles.
On the Resource page, you can:
Check current usage, running node instances, and queued node instances for each resource group
Review historical usage trends with the usage curve
Jump directly to alarm rule management and automated O&M
Supported resource group types
Resource O&M supports only:
Exclusive resource groups for scheduling
Exclusive resource groups for Data Integration
Supported regions
China (Hangzhou), China (Shanghai), China (Beijing), China (Zhangjiakou), China (Shenzhen), China (Hong Kong), Japan (Tokyo), Singapore, Malaysia (Kuala Lumpur), Indonesia (Jakarta), Germany (Frankfurt), US (Silicon Valley), US (Virginia), and UAE (Dubai)
Go to the Resource page
Log on to the DataWorks console. In the top navigation bar, select the desired region. In the left-side navigation pane, choose Data Development and O\&M > Operation Center. On the page that appears, select the desired workspace from the drop-down list and click Go to Operation Center.
In the left-side navigation pane, click Resource. The list of exclusive resource groups used by DataWorks nodes appears.
View the resource group list
The Resource page shows the exclusive resource groups associated with DataWorks nodes. The status of the resource groups shown is Running.
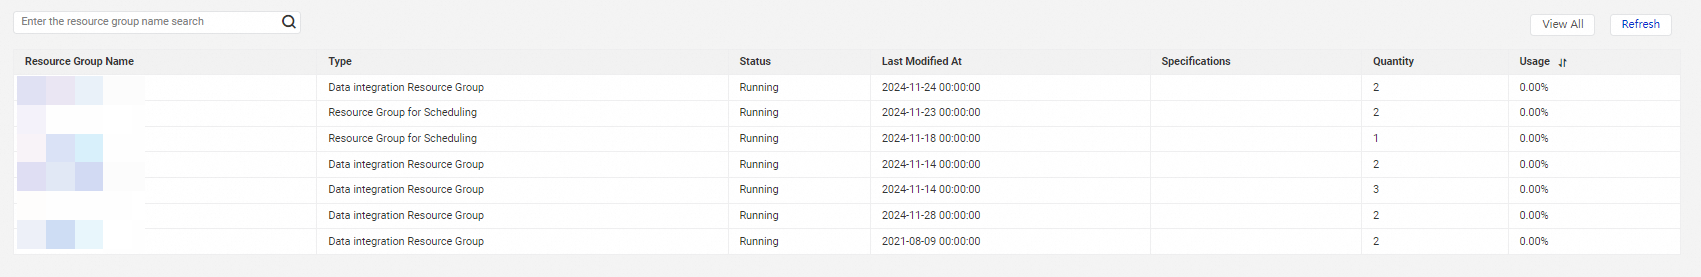
You can perform the following operations on this page:
Search for a resource group: Enter a resource group name in the search box and click the
 icon. The search uses fuzzy match.
View all resource groups: Click View All in the upper-right corner to open the Overview page, then click Resource Groups.
The following table describes the columns in the resource group list.
| Column | Description |
|---|---|
| Resource group name | The name of the resource group. Click the name to open the resource group details page. |
| Type | The resource group type set at creation. Resource O&M supports exclusive resource groups for Data Integration and exclusive resource groups for scheduling only. |
| Status | The current status of the resource group. For details, see Resource group statuses. |
| Expiration time | The date and time when the resource group expires. |
| Specifications | The specifications defined when the resource group was created. |
| Quantity | The number of resources configured when the resource group was created. |
| Usage | The current usage of the resource group. Click the sort icon next to Usage to sort the list in ascending or descending order. |
Resource group statuses
| Status | What it means | Recommended action |
|---|---|---|
| Running | The resource group is operating normally. | No action needed. |
| Starting | The resource group is being started. | Wait for the startup to complete. |
| Updating | The resource group is being updated. | Wait for the update to complete. |
| Expired | The resource group has reached its expiration date. Nodes cannot run. | Renew or release the resource group. |
| Released | The resource group has been released and is no longer available. | Purchase a new resource group if needed. |
| Timed Out | An operation on the resource group exceeded the time limit. | Retry the operation or contact support. |
| Failed to perform the create operation | The resource group failed to be created. | Check the configuration and try again, or contact support. |
| Failed to perform the update operation | The resource group failed to be updated. | Retry the update or contact support. |
View resource group details
Click a resource group name to open its details page. The page is divided into four areas.
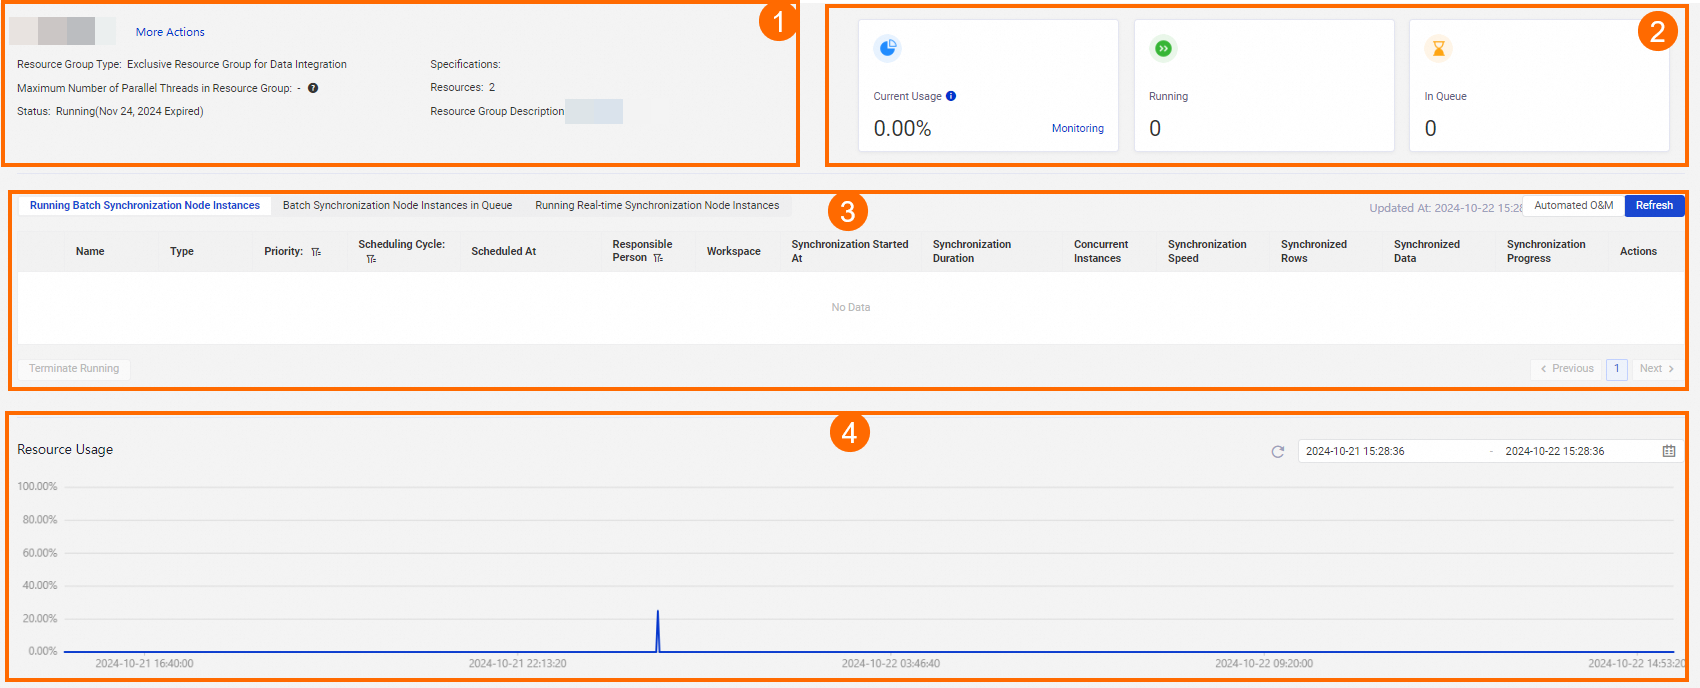
| Area | Content | Available actions |
|---|---|---|
| 1 | Basic information about the resource group. | Click More Actions to go to the Overview page, where you can click Resource Groups to manage resource groups (including scaling). |
| 2 | Current usage of the resource group, including the number of node instances in Running state and the number in In Queue state. | Click Monitoring to open the Rule Management page (Node Alarm > Alarm > Rule Management) and view or configure monitoring rules. |
| 3 | All node instances running on this resource group, grouped by status and synchronization mode: batch synchronization node instances that are running, batch synchronization node instances that are in the waiting state, and real-time synchronization node instances that are running. | Click Automatic to go to the Automatic page (O\&M Assistant > Automatic). For more information, see Automated O&M. |
| 4 | Usage curve showing historical resource usage over time. | Use the date and time picker to select a time range. Hover over any point on the curve to see the usage at that moment. |
What's next
To set up monitoring rules and alerts for a resource group, see Automated O&M.