The Real-Time Synchronization Nodes page lists the instances generated by real-time synchronization tasks after they are submitted to the scheduling system.
Access the real-time O&M page
-
Log on to the DataWorks console. In the target region, click in the left-side navigation pane. Select a workspace from the drop-down list and click Go to Operation Center.
-
In the navigation pane on the left, click the
 icon next to Real-time Task O&M.
 -
From the drop-down list, click Real-time Synchronization Tasks.
Real-time task list
On the Real-Time Synchronization Nodes page, you can manage scheduled instances. You can view basic information, check runtime details and properties, and perform actions such as starting or undeploying instances.
|
Area |
Description |
|
1 |
In this area, you can use filters to find specific instances. You can filter by Search by node name., Node Status, Owner, Source Type, Source Name, Last Operated By, Destination Type, Destination Name, or Data Integration Resource Group. Note
Only instances that match all active filter conditions are displayed. |
|
2 |
In this area, you can view the following information for each instance:
|
|
3 |
In this area, you can perform the following bulk operations on selected instances:
|
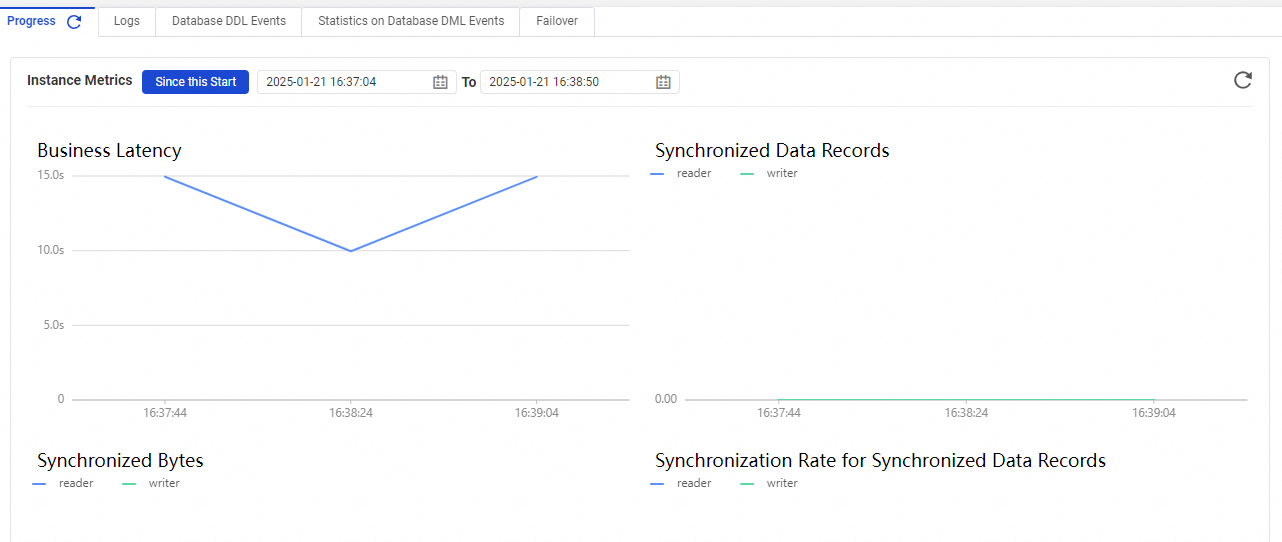
Real-time task details
In the task list, click Node Name to go to the task details page. At the top of the page, you can switch to different subpages to view the task's Progress, Log, Database DDL Events, Statistics on Database DML Events, Failover, and Run Diagnostics.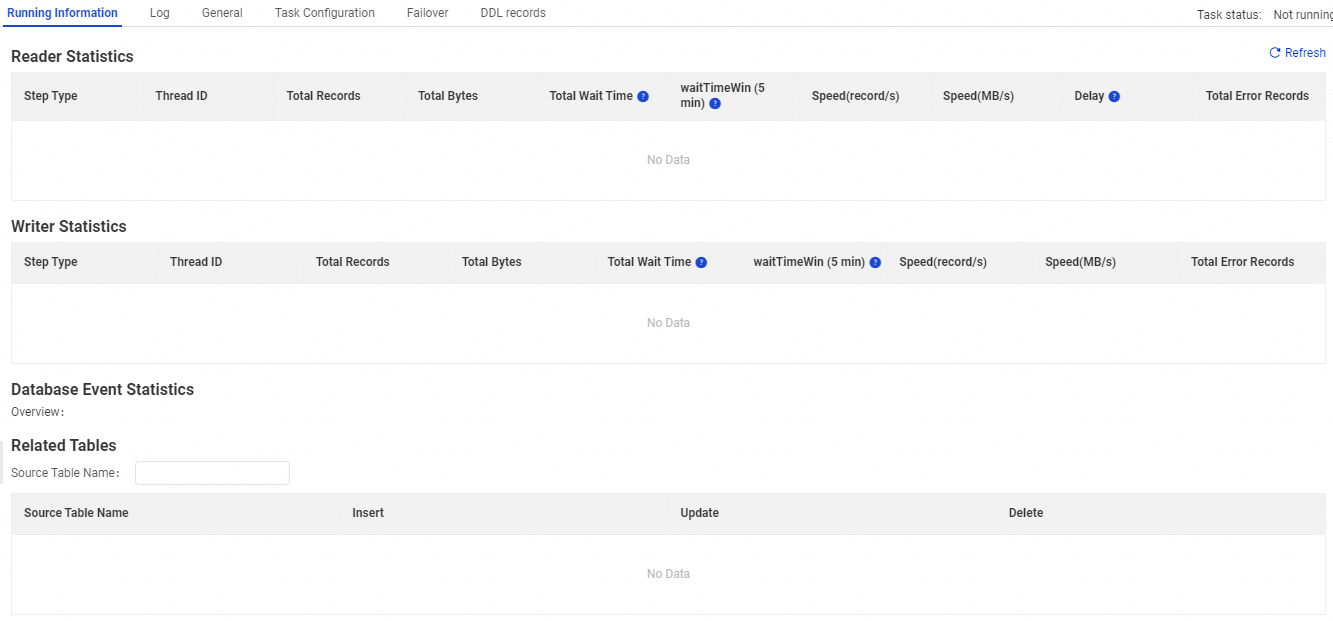
Synchronization task operations
-
Start a synchronization task
In the Actions column, click Start. In the dialog box that appears, configure the parameters and click OK to start the task.
If you select the Reset site option, the Time and Time Zone parameters are required.
-
Stop a synchronization task
In the Actions column, click Stop. In the confirmation dialog box that appears, click Stop again to stop the running task.
-
Undeploy a synchronization task
In the Actions column, click Undeploy. In the confirmation dialog box, click Undeploy again to undeploy the task.
-
Configure alerts
-
On the Alert Events tab, specify the Occurred At range, Alert Severity, and Rule to filter and view alert events.
-
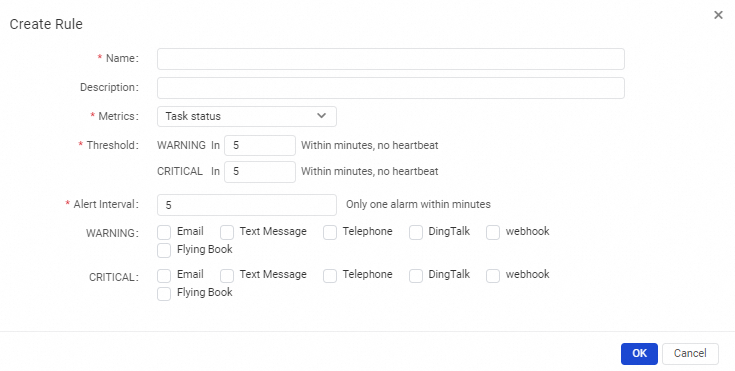
The Alert Rules page displays the alert rules created for the current synchronization task. You can view information about the created rules, such as their metrics and status, in the Alert Rules list. You can also perform actions on the rules in the Actions section, such as editing, pausing, deleting, and running simulated tests. To create a new rule, click Create Rule on the right.
Parameter
Description
Required
Name
The name for the new alert rule.
Yes
Description
A brief description of the new rule to help with troubleshooting.
No
Metric
The metric that triggers the alert. This must be configured along with a Threshold. Available metrics include Task Status, Business Delay, Failover, and DDL Not Supported.
Yes
Threshold
The condition that triggers the alert. This setting depends on the selected Metric.
-
For the Node Status metric, specify the minimum duration of an abnormal status before an alert is triggered.
-
For the Business Latency metric, set how long the business delay must be greater than or equal to a specified time before an alert is triggered.
-
For the Not Supported by DDL Statements metric, you only need to select an alert level.
-
For tasks running in non-distributed mode, set the number of Failover events within a specific time period that triggers an alert. For tasks in distributed mode, set the number of Failover events for a single sub-task within a specific time period that triggers an alert.
Yes
Alert Interval
The minimum time between two consecutive alerts. The default is 5 minutes, and the minimum is 1 minute.
Yes
WARNING
The notification method for WARNING-level alerts. Options include Email, SMS, and DingTalk.
Note-
Email: To allow a RAM user to receive alerts by email, an Alibaba Cloud account must specify an email address for the RAM user in their user information.
-
SMS: To allow a RAM user to receive alerts by SMS, an Alibaba Cloud account must specify a mobile number for the RAM user in their user information.
-
DingTalk: To receive alerts by using a custom DingTalk chatbot, the group must be a standard group, and the chatbot must be configured with the keyword "DataWorks".
No
CRITICAL
The notification method for CRITICAL-level alerts. Options include Email, SMS, and DingTalk.
No
Receiver (Not a DingTalk account)
The contacts to whom alerts are sent.
Yes
-
-