By Yang Zeqiang, Alibaba Cloud Technical Expert
Contributed by Alibaba Cloud ECS
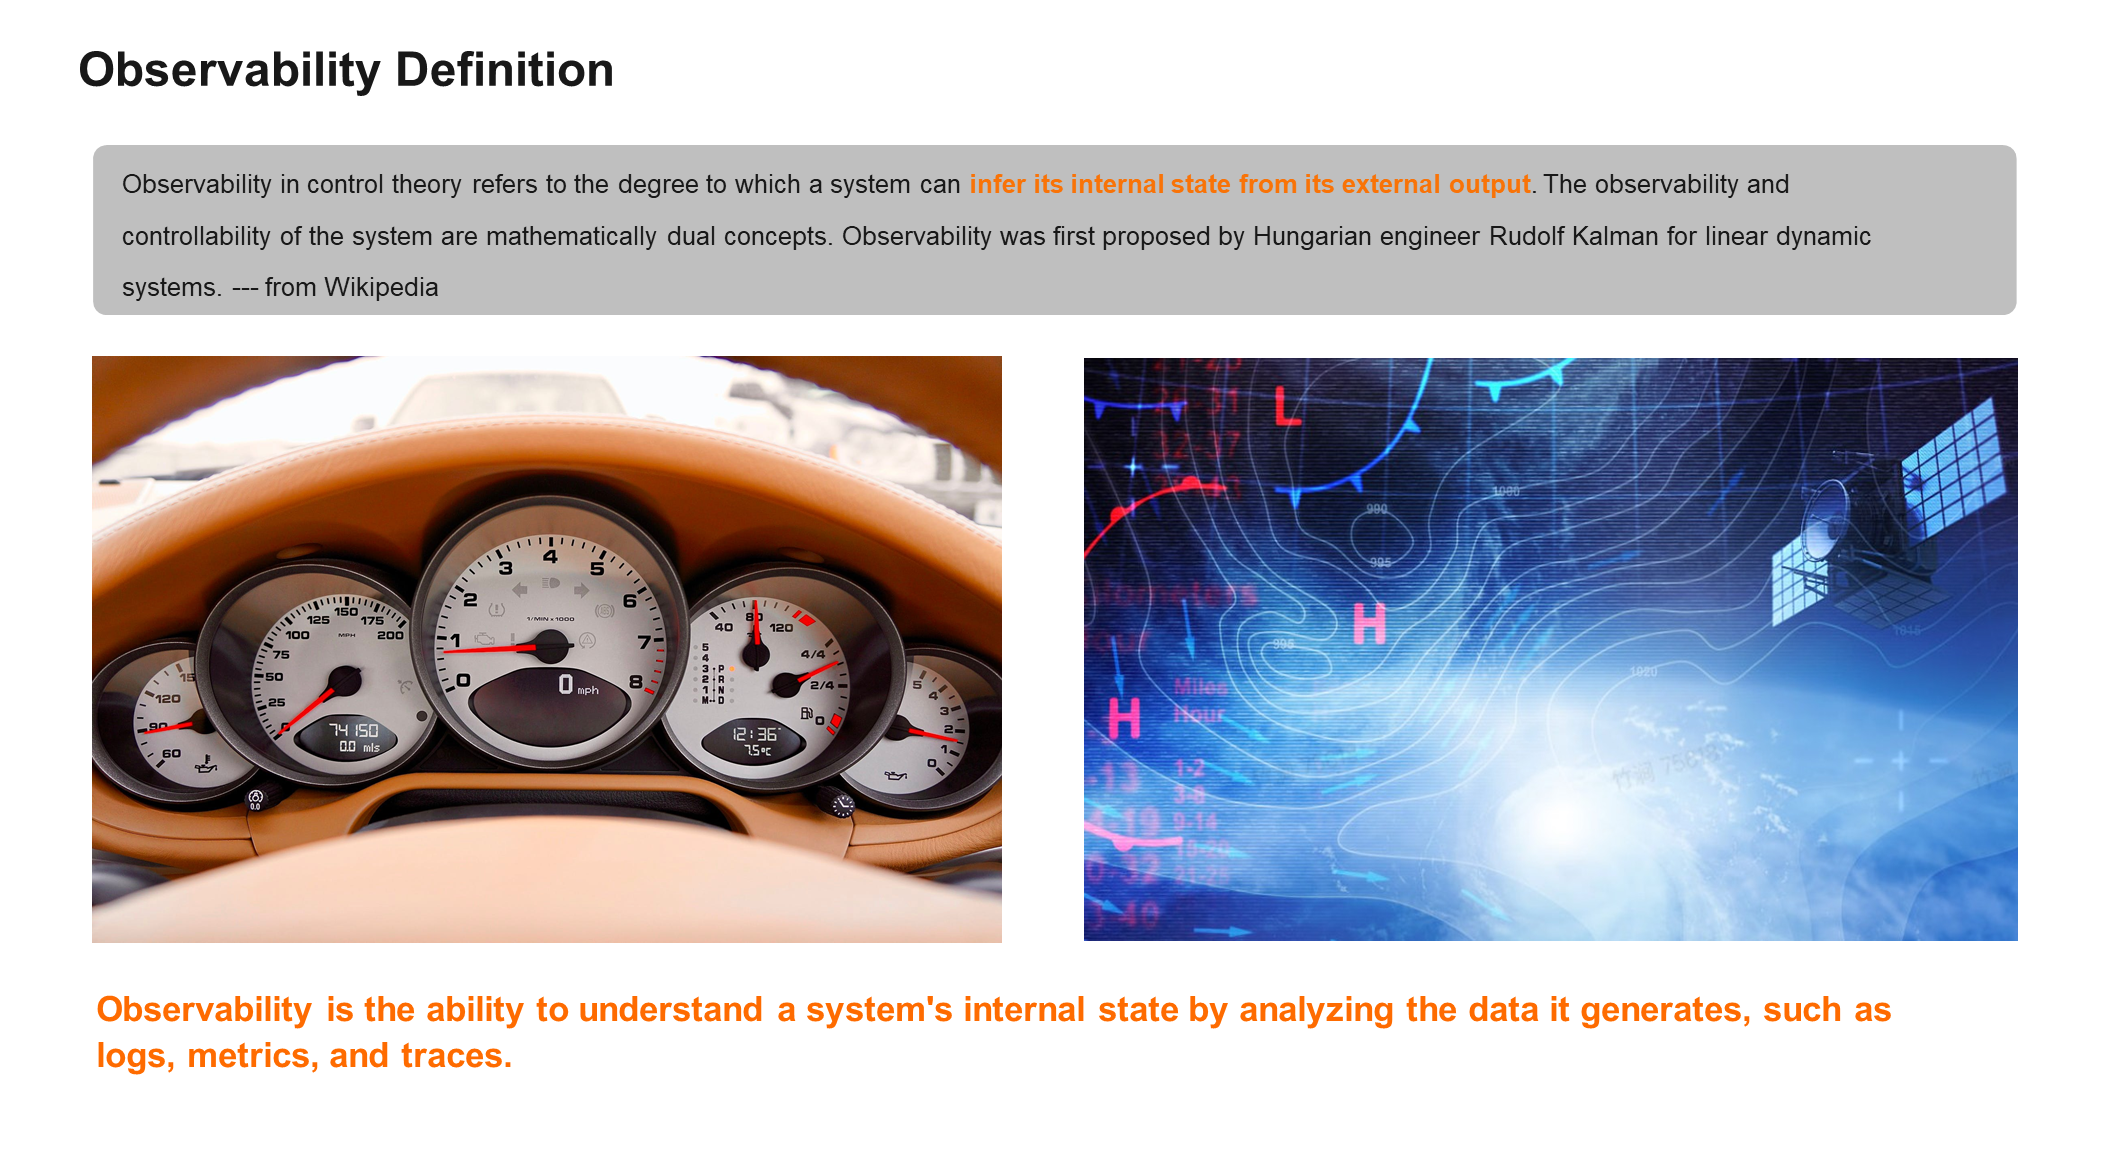
Observability originated from meteorological observation in the agricultural era, and there are observable products later in the electrical era and automation era. Observability in control theory refers to the degree to which a system can infer its internal state from its external output. The observability and controllability of a system are dual concepts in mathematics.
Taking a car as an example, we cannot directly sense the internal state of the car system during driving, but we can know the current engine speed, speed, fuel volume, and the operating state of other systems through the dashboard.
The system is observable in software engineering by collecting logs, metrics, and traces to understand the internal status of the system.
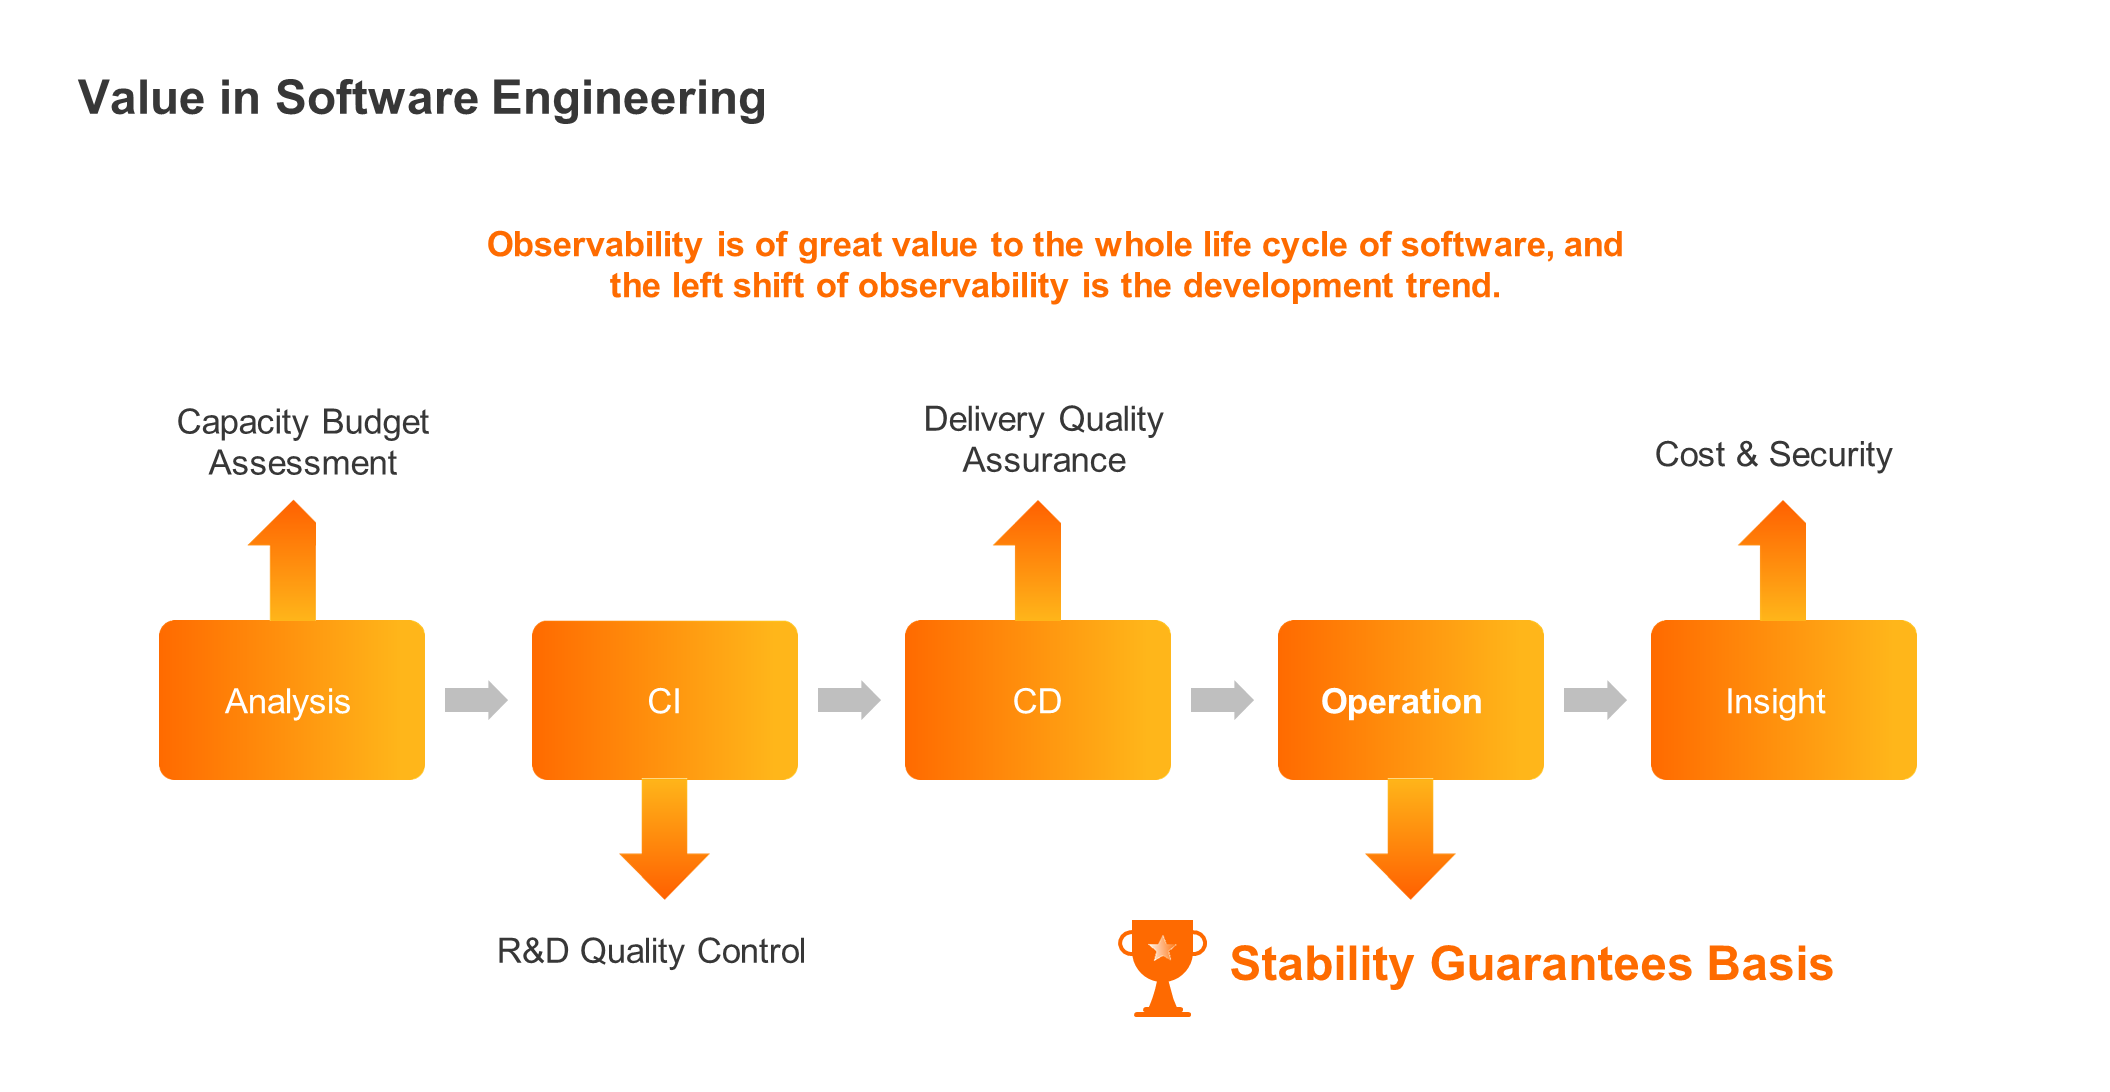
Observability is of great value to the entire software lifecycle. You can view the current system load, abnormal links, abnormal conditions, and alarms through observability. You can make early warnings based on observability and then make an analysis based on early warnings to minimize the fault perception time and location time and ultimately shorten the MTTR.
Observability is the foundation of software system stability. From the perspective of software engineering, observability can provide far more than stability.
In the earliest demand analysis stage of software engineering, capacity budget evaluation can be carried out through observability. R&D quality control can be carried out in the CI stage, such as successful construction rate and test coverage. Delivery quality can be guaranteed in the delivery process through observability. At the same time, cost and safety can be effectively managed through observability.
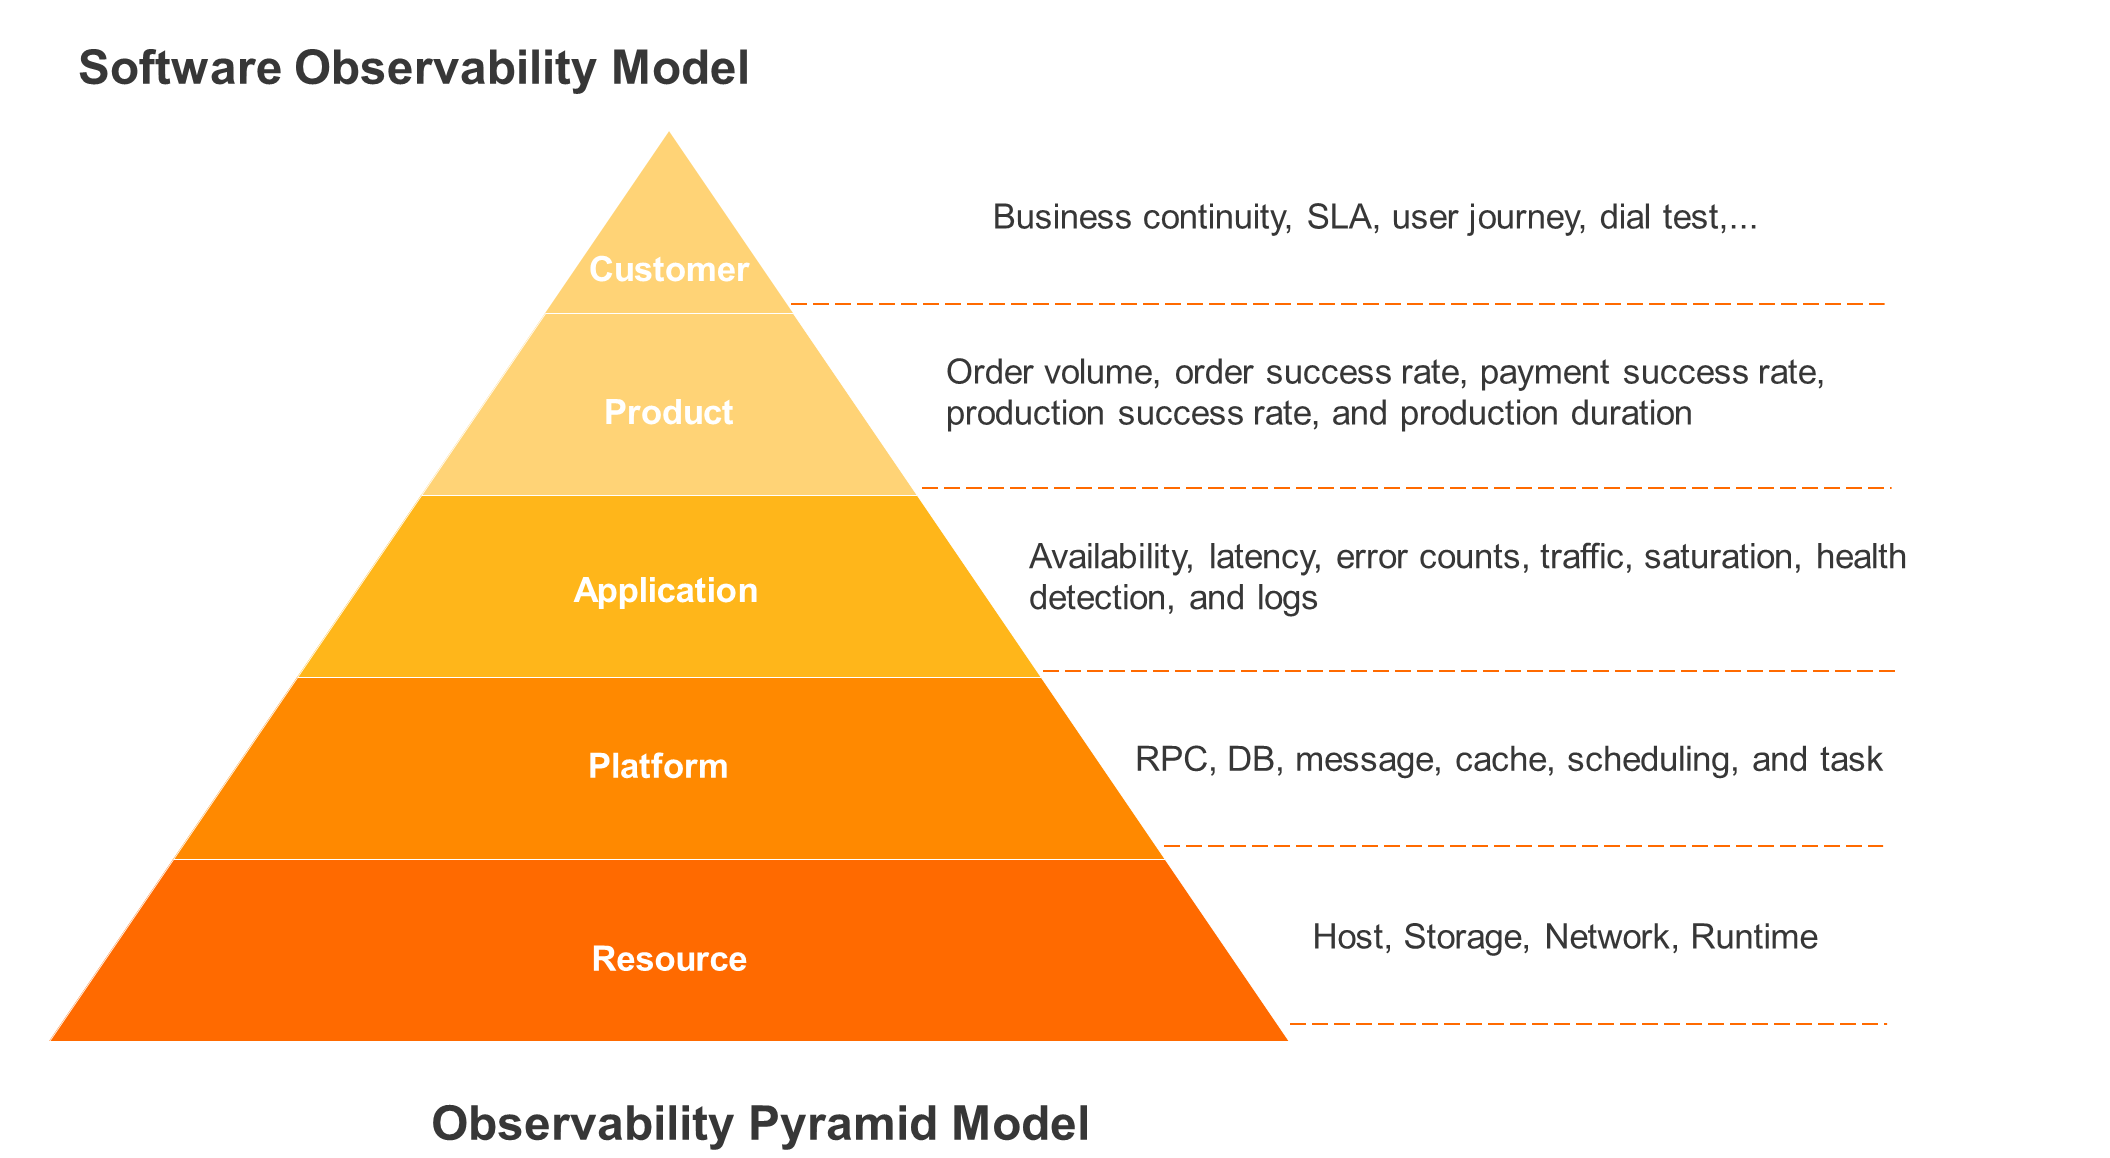
From the perspective of the entire lifecycle of software, there is no standard answer to how to build an ideal observability model. However, a standard model can be abstracted from the perspective of typical software architectures (such as monolithic applications or distributed applications to microservices). As shown in the figure above, it is divided into five layers from bottom to top:
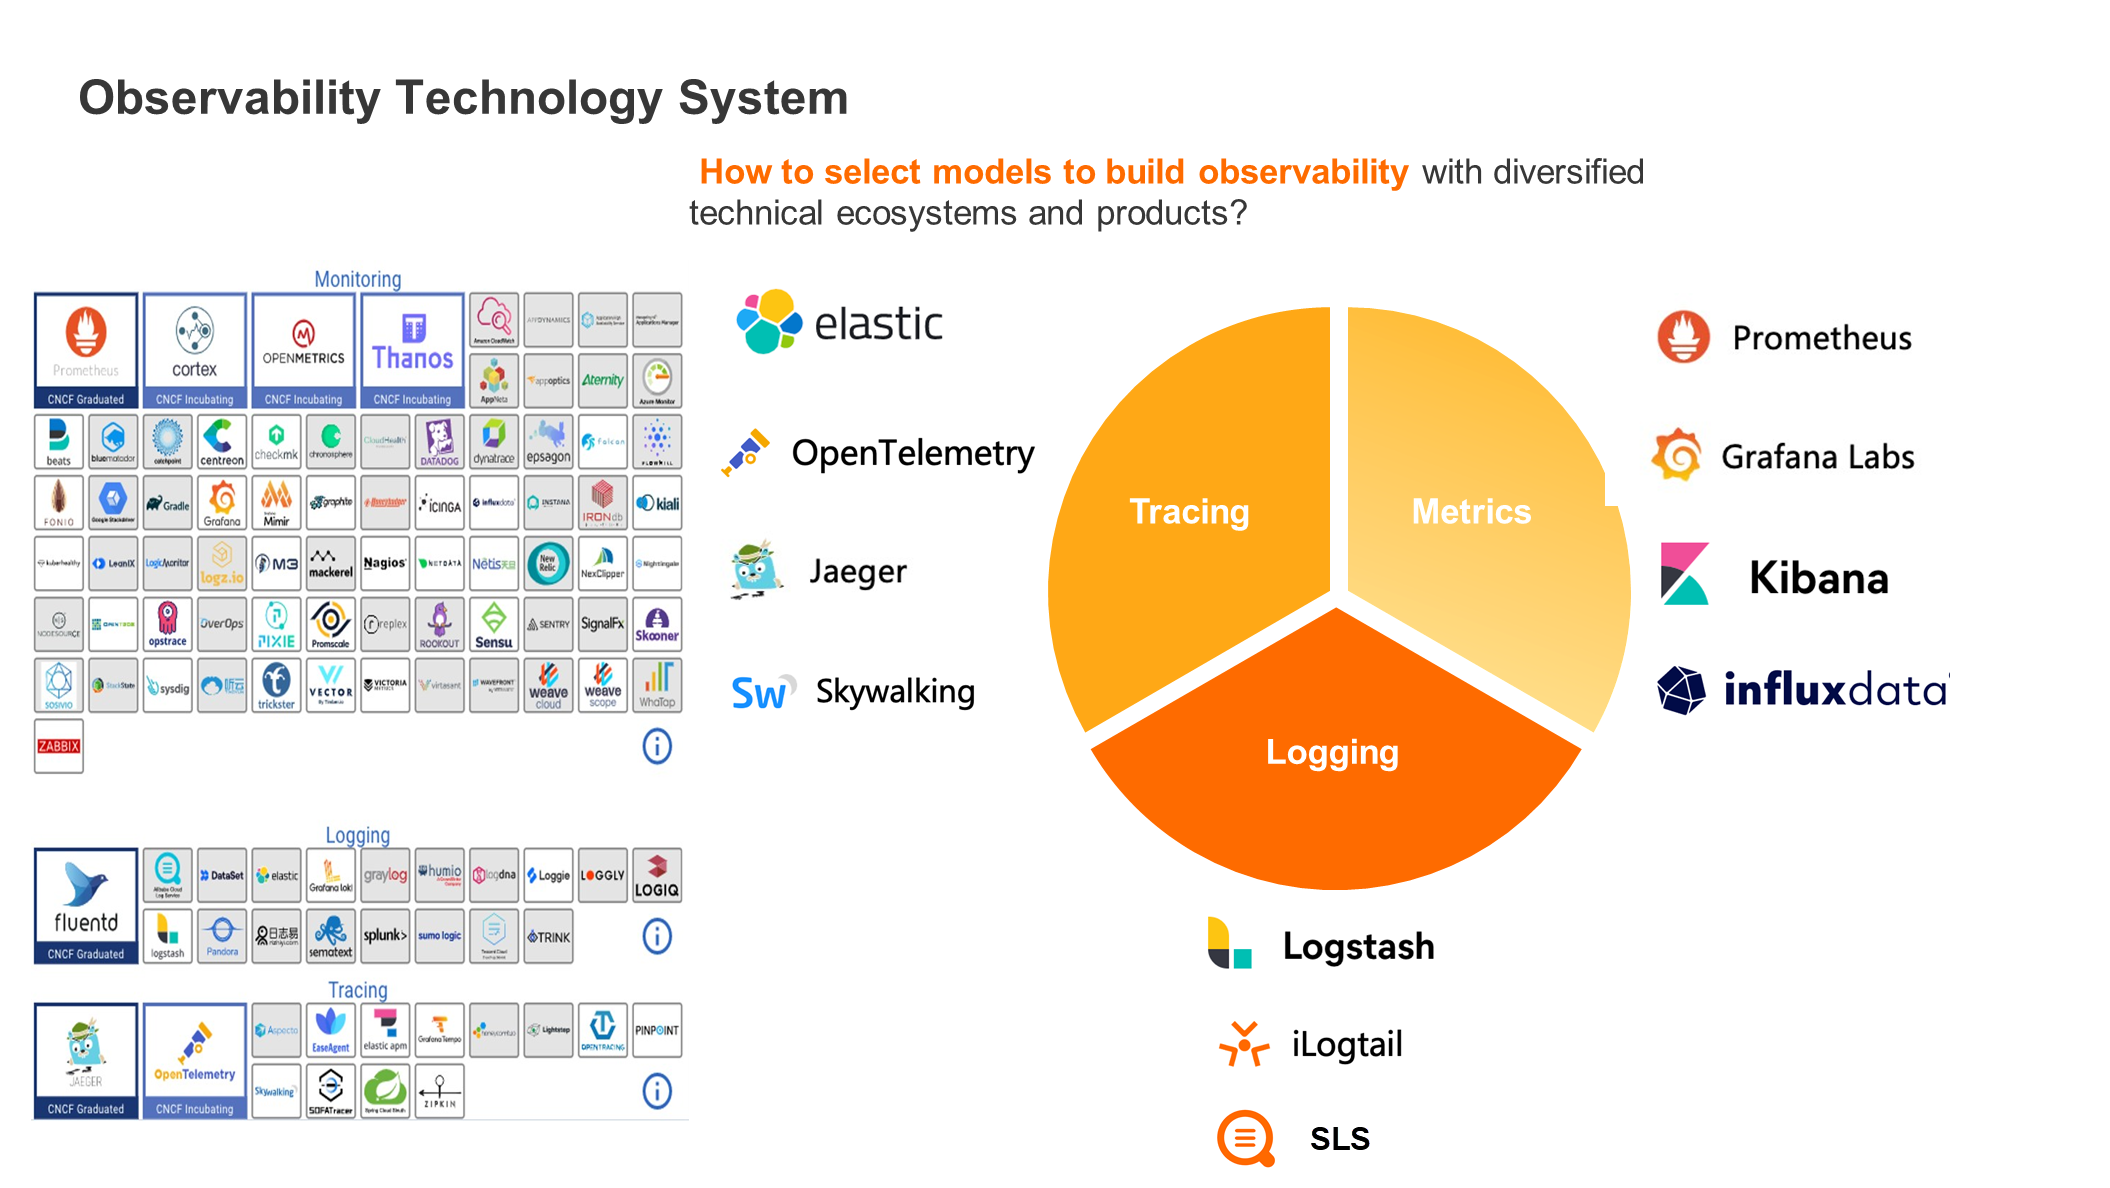
Currently, the ecology and products of observability technology systems are already very rich. The Logging side includes Logstash, iLogtail, and SLS. The Metrics side includes Prometheus, Grafana, and Kibana. The Tracing side includes Elastic, Opentemeletry, and Skywalking.
There is no standard answer to how to select the model in the process of constructing observability. It depends on your specific needs.
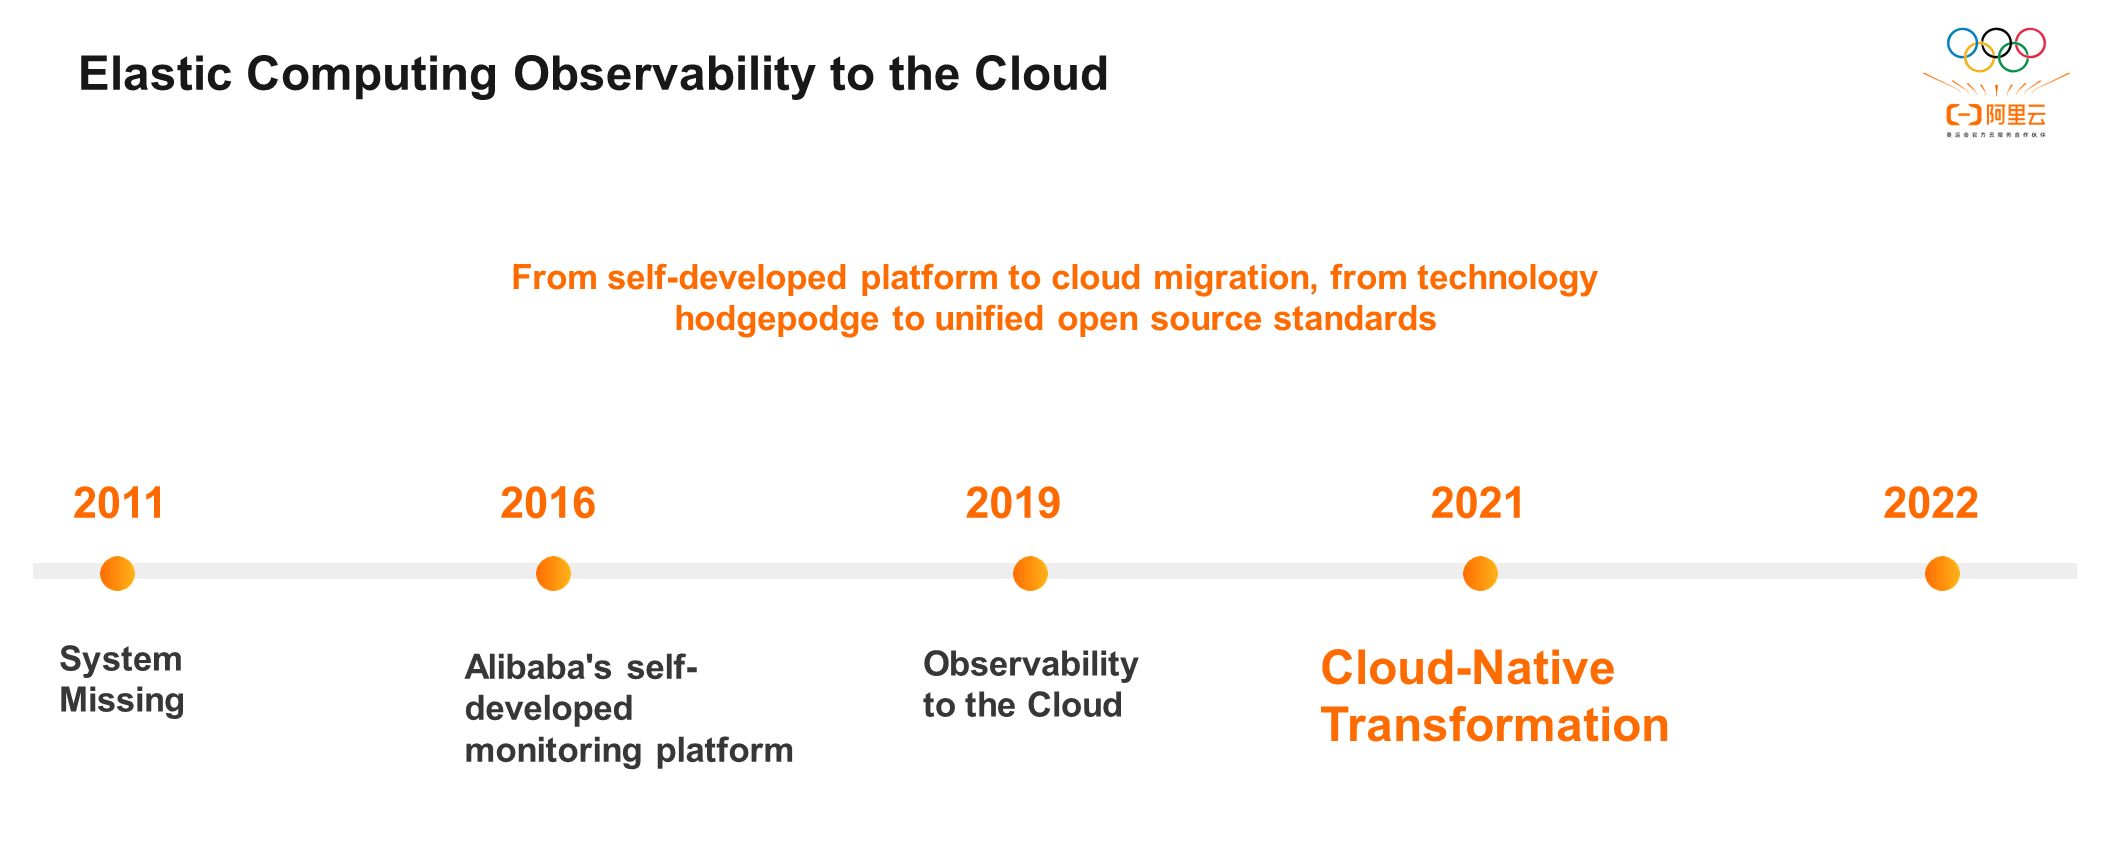
In 2011, the observability system was missing in the initial stage of elastic computing observability to the cloud, and the software architecture was mainly a monolithic application mode with only a few monitoring and early warning tools. In 2016, an early warning was connected to Alibaba's self-developed monitoring platform. The main implementation methods are traditional monitoring systems, metrics collection, and display systems based on the time series database. In 2019, Alibaba began to move ECS core applications to the cloud gradually and built systems based on the cloud, including CloudMonitor and SLS. In 2021, Alibaba started the cloud-native transformation and completed about 90% of the transformation. In addition, Alibaba changed the technical system to an open-source standard technical system based on cloud-native.
The elasticity and reliability of the cloud and the natural isolation of multiple regions provide huge advantages for the monitoring platform. In addition, the cloud-native technology has been closely following the latest open-source standards in the industry, and its solutions are versatile and advanced. This is also incomparable to the pace of research and development of self-developed platforms.
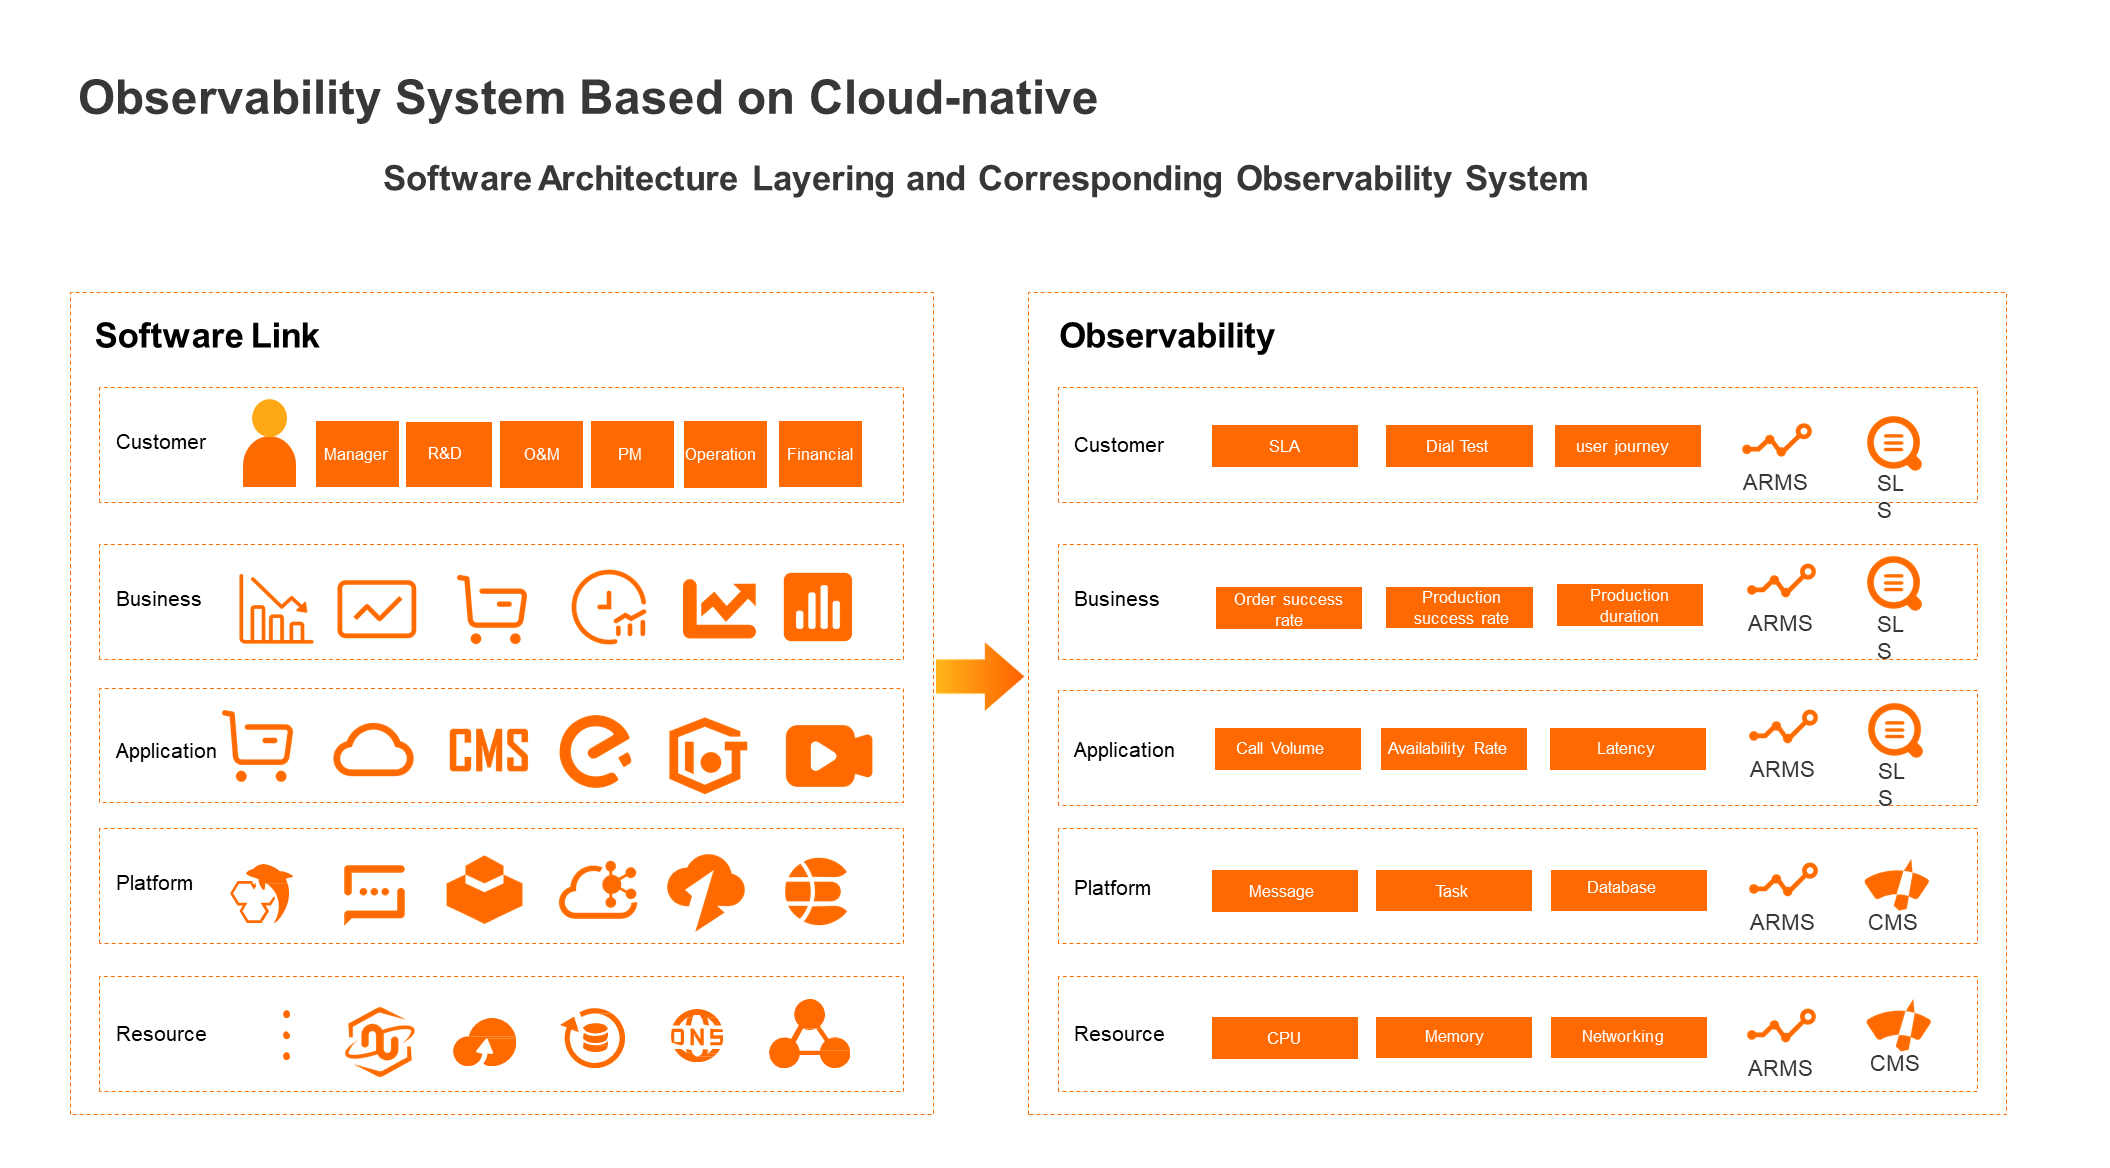
The infrastructure monitoring is mainly carried out with the CloudMonitor and ARMS products. ARMS is an APM tool that collects node metrics of machines.
The platform layer contains many middleware and databases. Previously, it was often necessary to connect to many different systems. The native technology eBPF provided by ARMS can seamlessly collect all metrics on the cloud, such as the golden three metrics, database, and MySQL, and finally generate standard metrics data.
The golden three metrics of the application layer, availability, latency, error rate, call count, etc., can be constructed by ARMS and SLS complementing each other.
The production success rate and time consumption of ECS instances at the business layer are built based on the trace and metrics capabilities of ARMS and SLS.
The customer layer is mainly built based on ARMS and SLS. We need to change cognition. Observability can be available to Project managers, operators, financial personnel, and managers. Its significance and value for different roles are also different, which is also the value of observability.
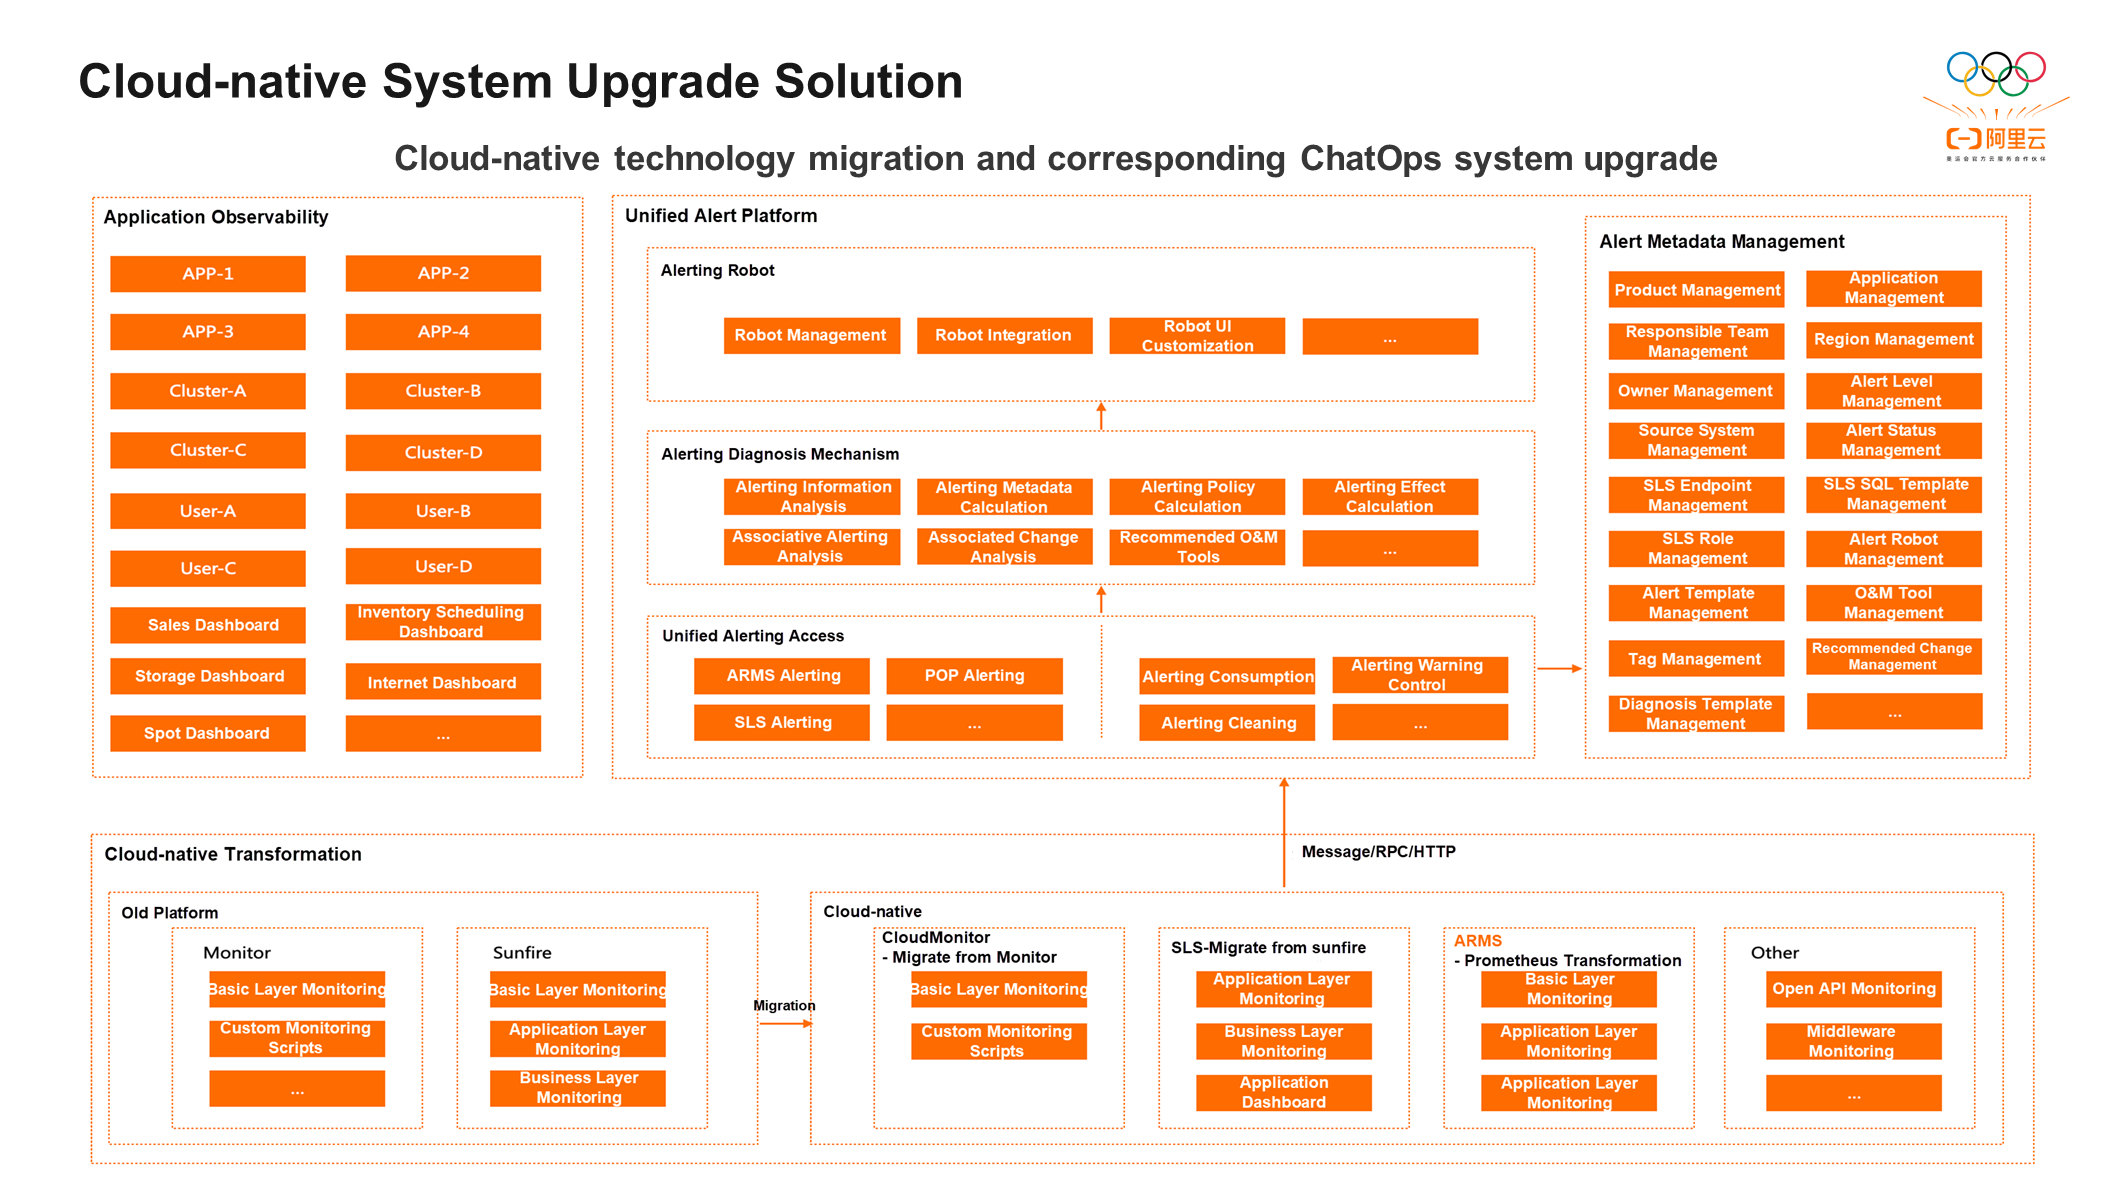
The preceding figure shows the overall upgrade plan of ECS.
Monitor and Sunfire of the old platform are migrated to cloud-native, mainly to move basic monitoring to CMS CloudMonitor and business monitoring and application monitoring to ARMS. Trace capabilities are also migrated from the original log orchestration service to ARMS trace and SLS-based logstore orchestration capabilities.
In addition to cloud-native open-source technical standards, we have developed automated O&M systems based on basic capabilities, such as alerts, fault diagnosis, and quick recovery. The underlying capabilities are built using SLS and ARMS Open API.
The observation perspective with better observability is the application perspective. In addition, we build observability from the business dimension based on some business particularities. For example, if ECS has clusters, we build observability based on the cluster dimension.
After building all observability, we also built a unified early warning platform and automated O&M capabilities.
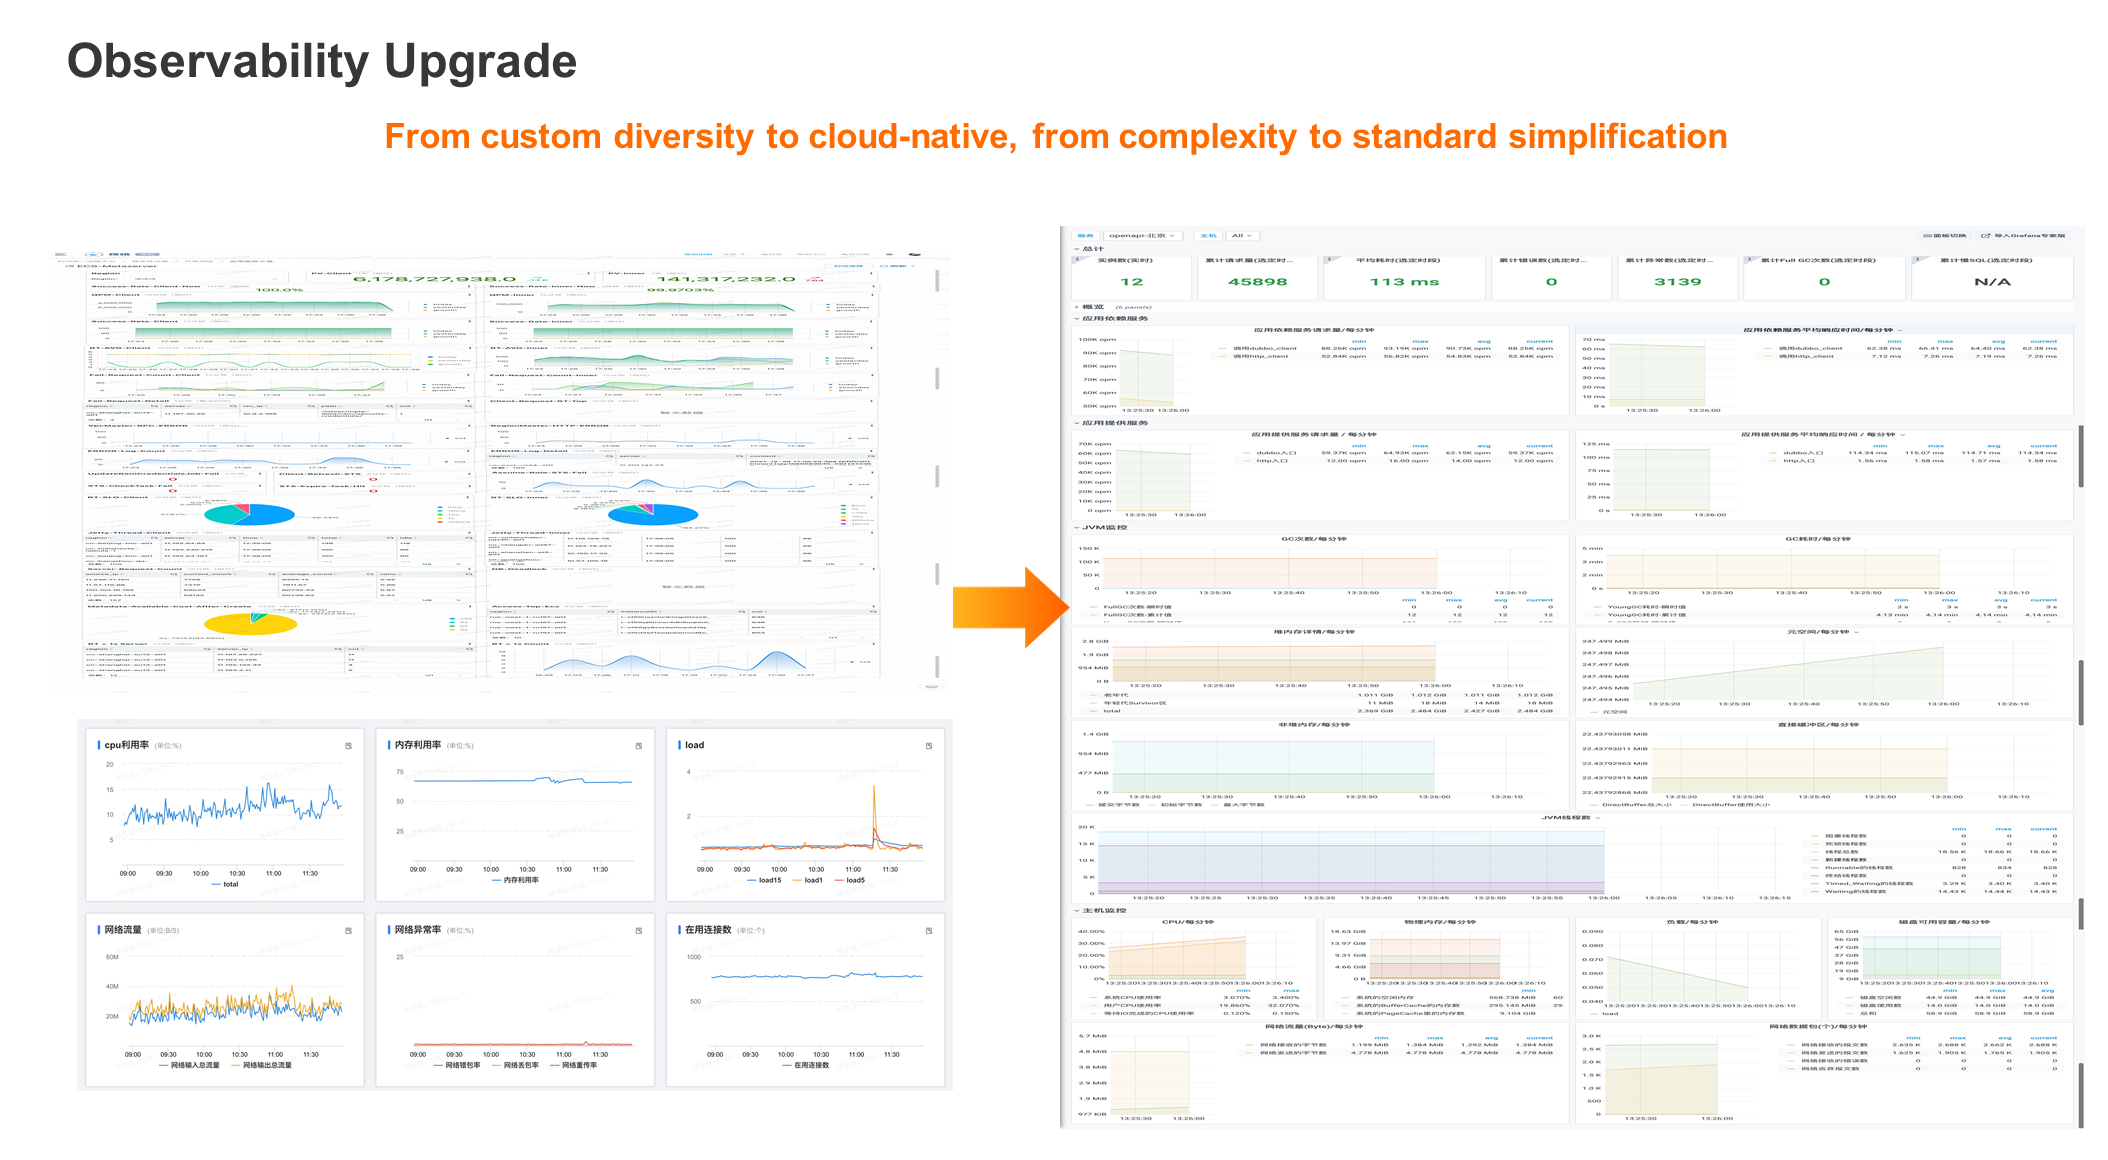
The original Monitor and Sunfire on the left are built based on logs, and the latest observability system on the right is built based on the open-source method of Prometheus and Grafana standards. It has realized the transformation from custom diversity to cloud-native and from complexity to standard simplification.
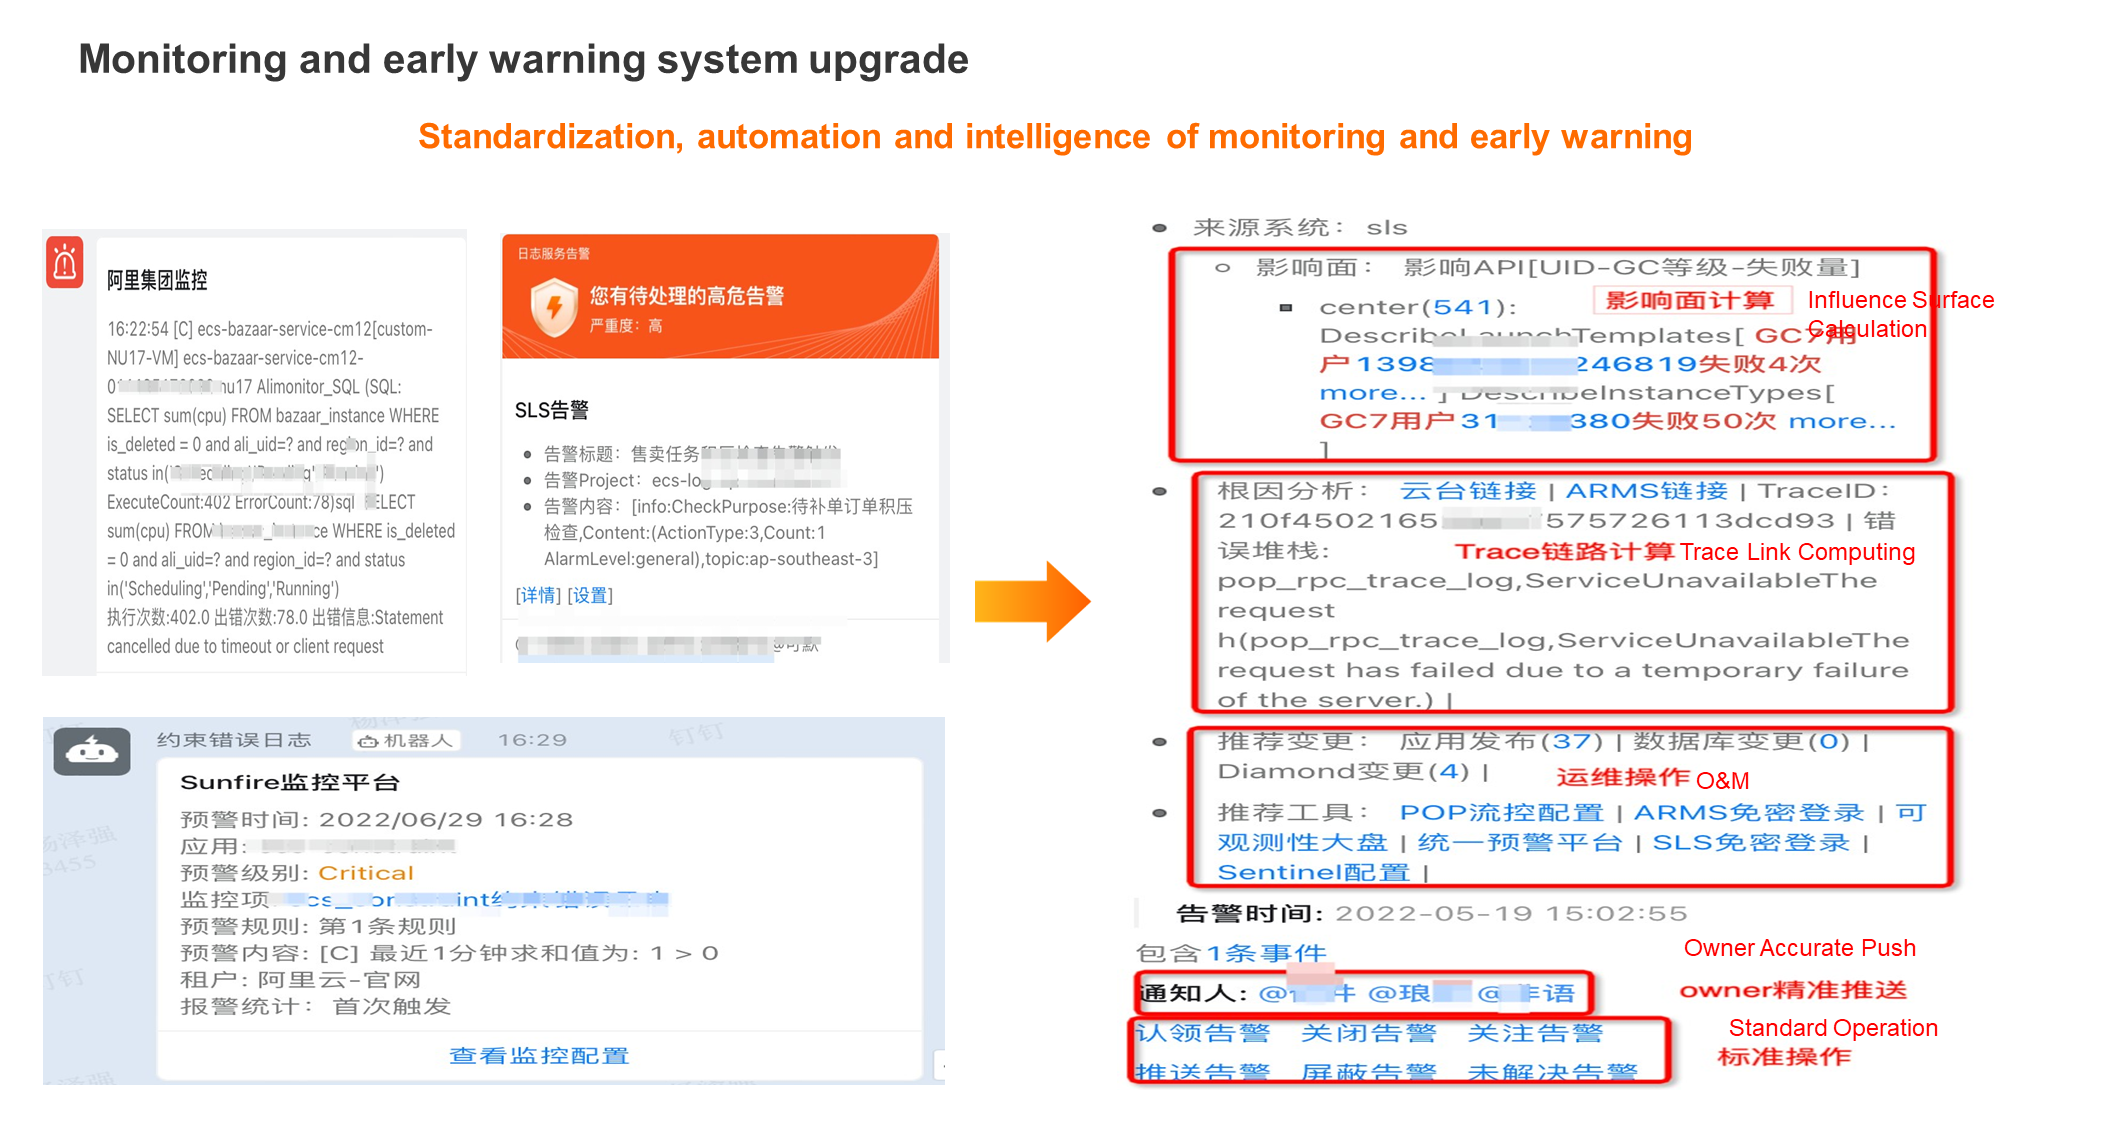
Let's take monitoring and early warning as an example. The left side of the preceding figure shows the monitoring and warning system before migrating to the cloud, which consists of Alibaba Group monitoring, the Sunfire monitoring platform, and the SLS alarm.
The monitoring and early warning system after cloud migration is shown on the right. You can generate standardized data calculations based on Metrics data, such as calculating impact surfaces. The data in O&M operations can also be calculated dynamically. You can view the original stack, key metrics on site, and changes. In addition, we built the capabilities of accurate owner push and standardized operations of early warning based on the native API.
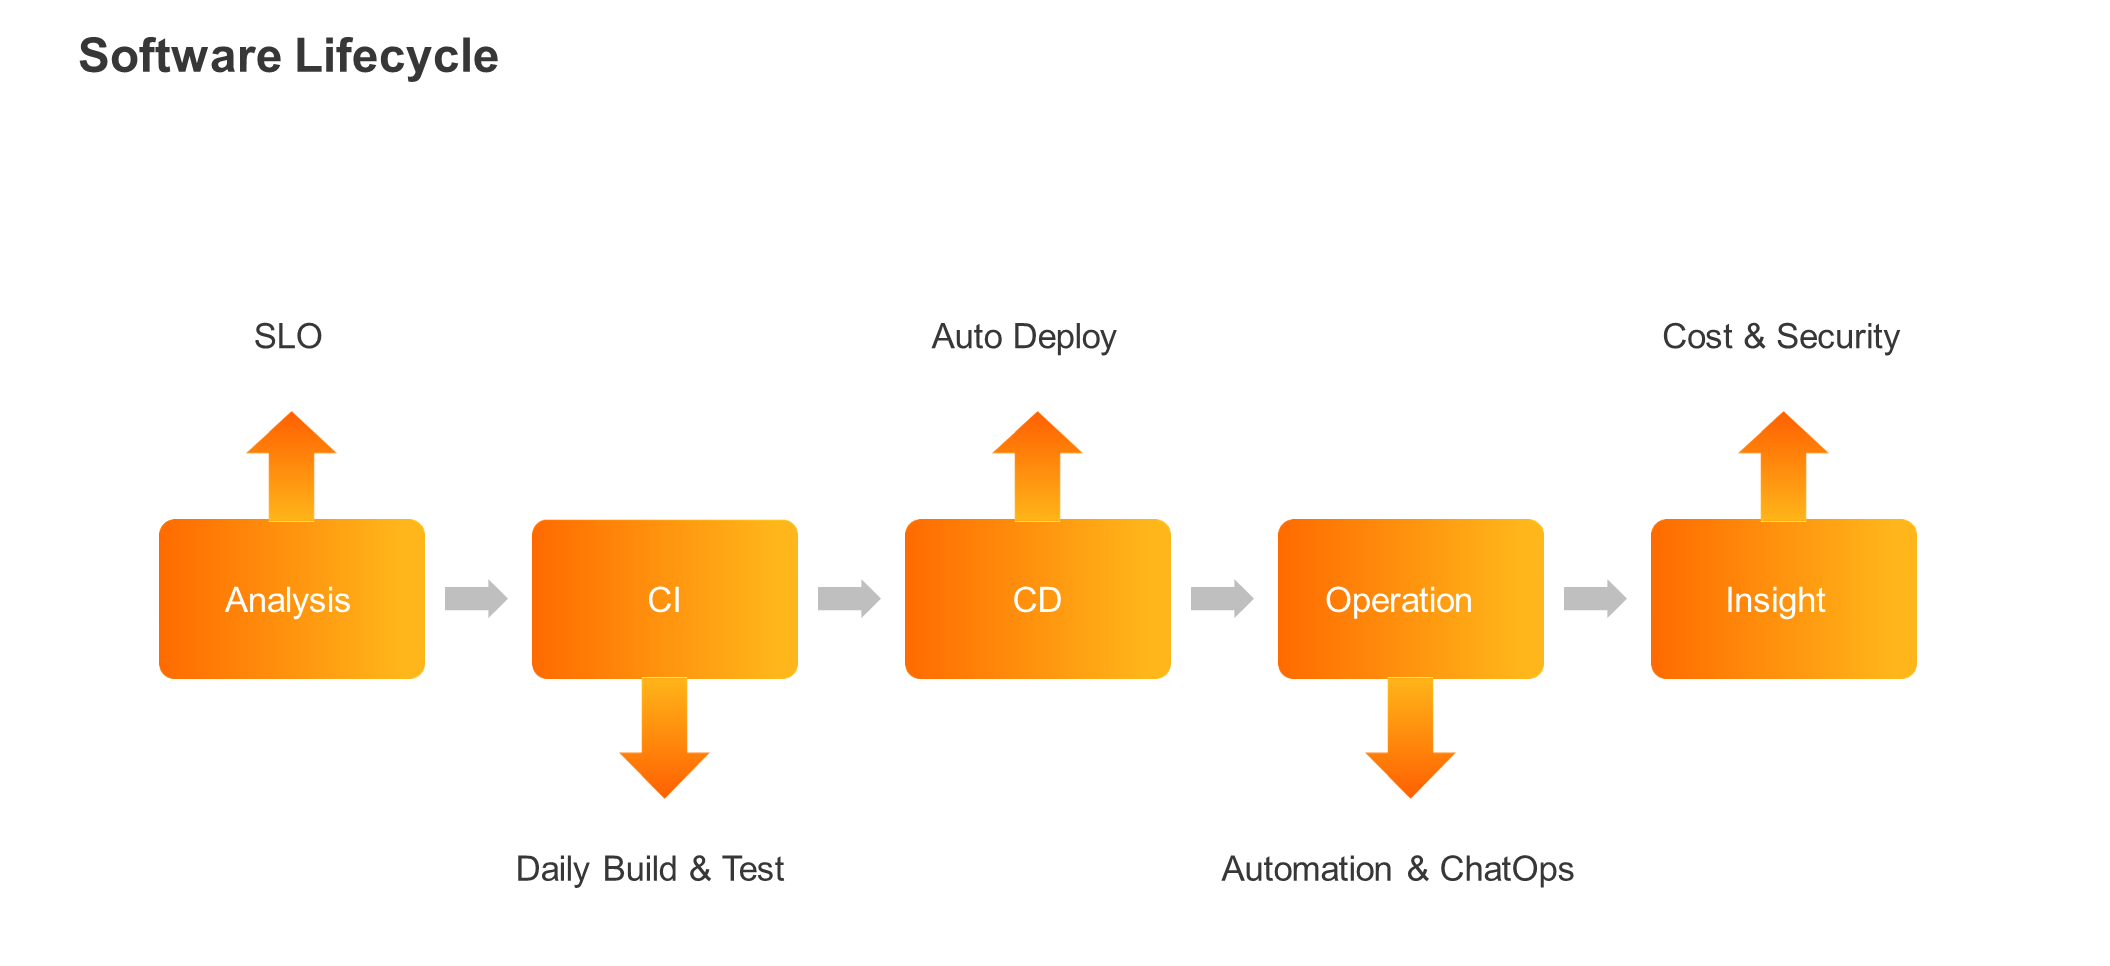
From the perspective of the software lifecycle, there will be daily construction and testing and real-time dashboard management during the CI process. The automated publishing provides automated verification based on the data format of Prometheus metrics. Automated operation and maintenance and Chat Ops are provided during the operation period. Currently, we are building security metrics and cost control based on observability.
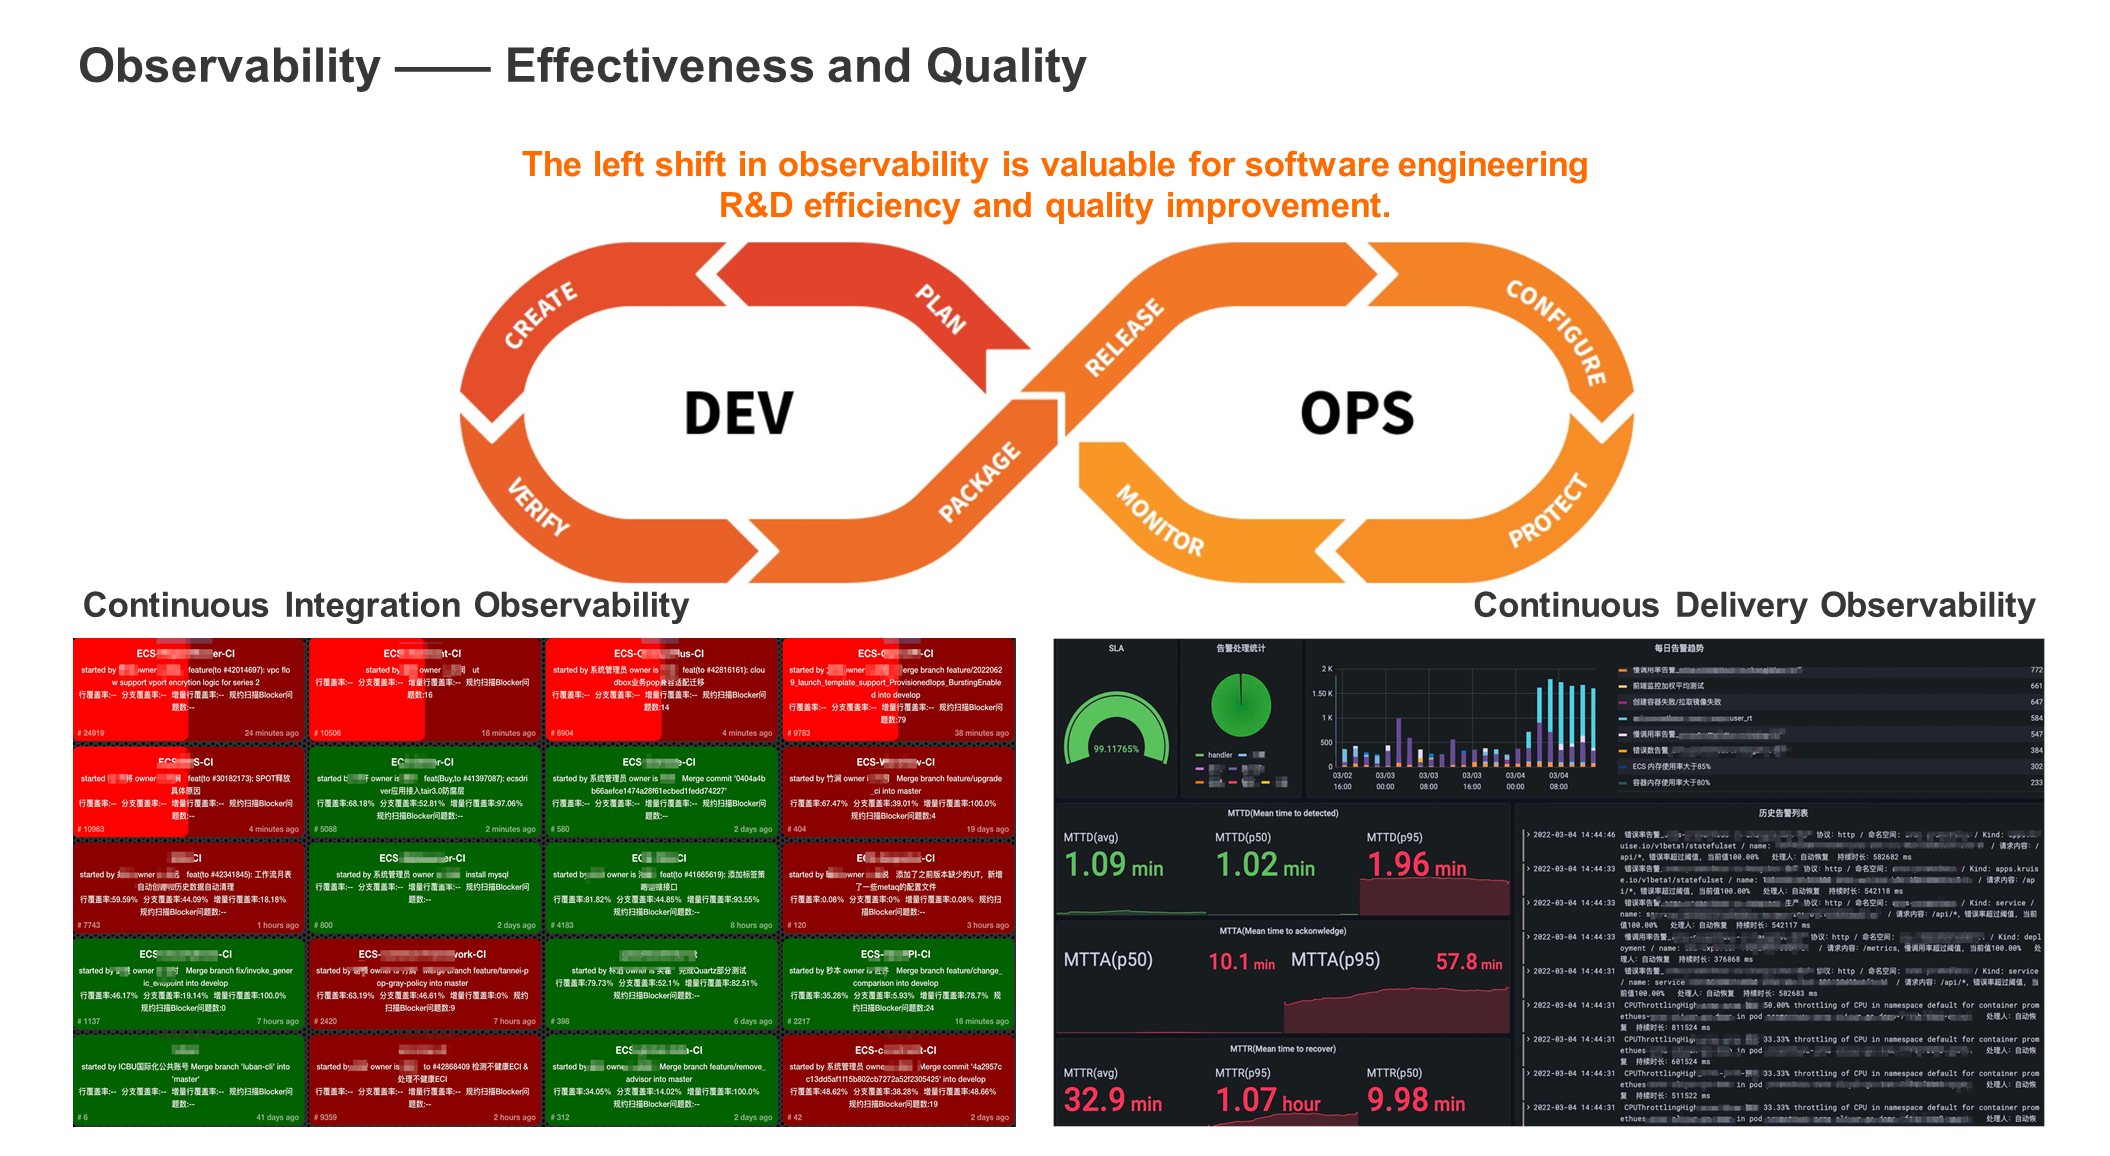
Let's take performance and quality as an example. Continuous integration and continuous delivery are the two core aspects of DevOps. These are also two factors that directly affect the quality of software engineering.
In terms of continuous integration, there is a CI Dashboard. Every time a code is entered, the CI is triggered to calculate the code line coverage, branch coverage, full complexity, and success or failure status, as shown on the right side of the preceding figure.
In terms of continuous delivery, the difficulty of automated publishing is how to grant credit, so we have implemented the canary release. In addition, we believe that observability is also needed during the release process. Therefore, we will display some core metrics during the release phase through the metrics Dashboard. We will provide atomic capabilities and release system verification in conjunction with metrics of application dimensions to implement automated release.
The essence of the function above is to do a left shift to the observability from the software engineering runtime to the code release and delivery stage to ensure the quality of the delivered code.
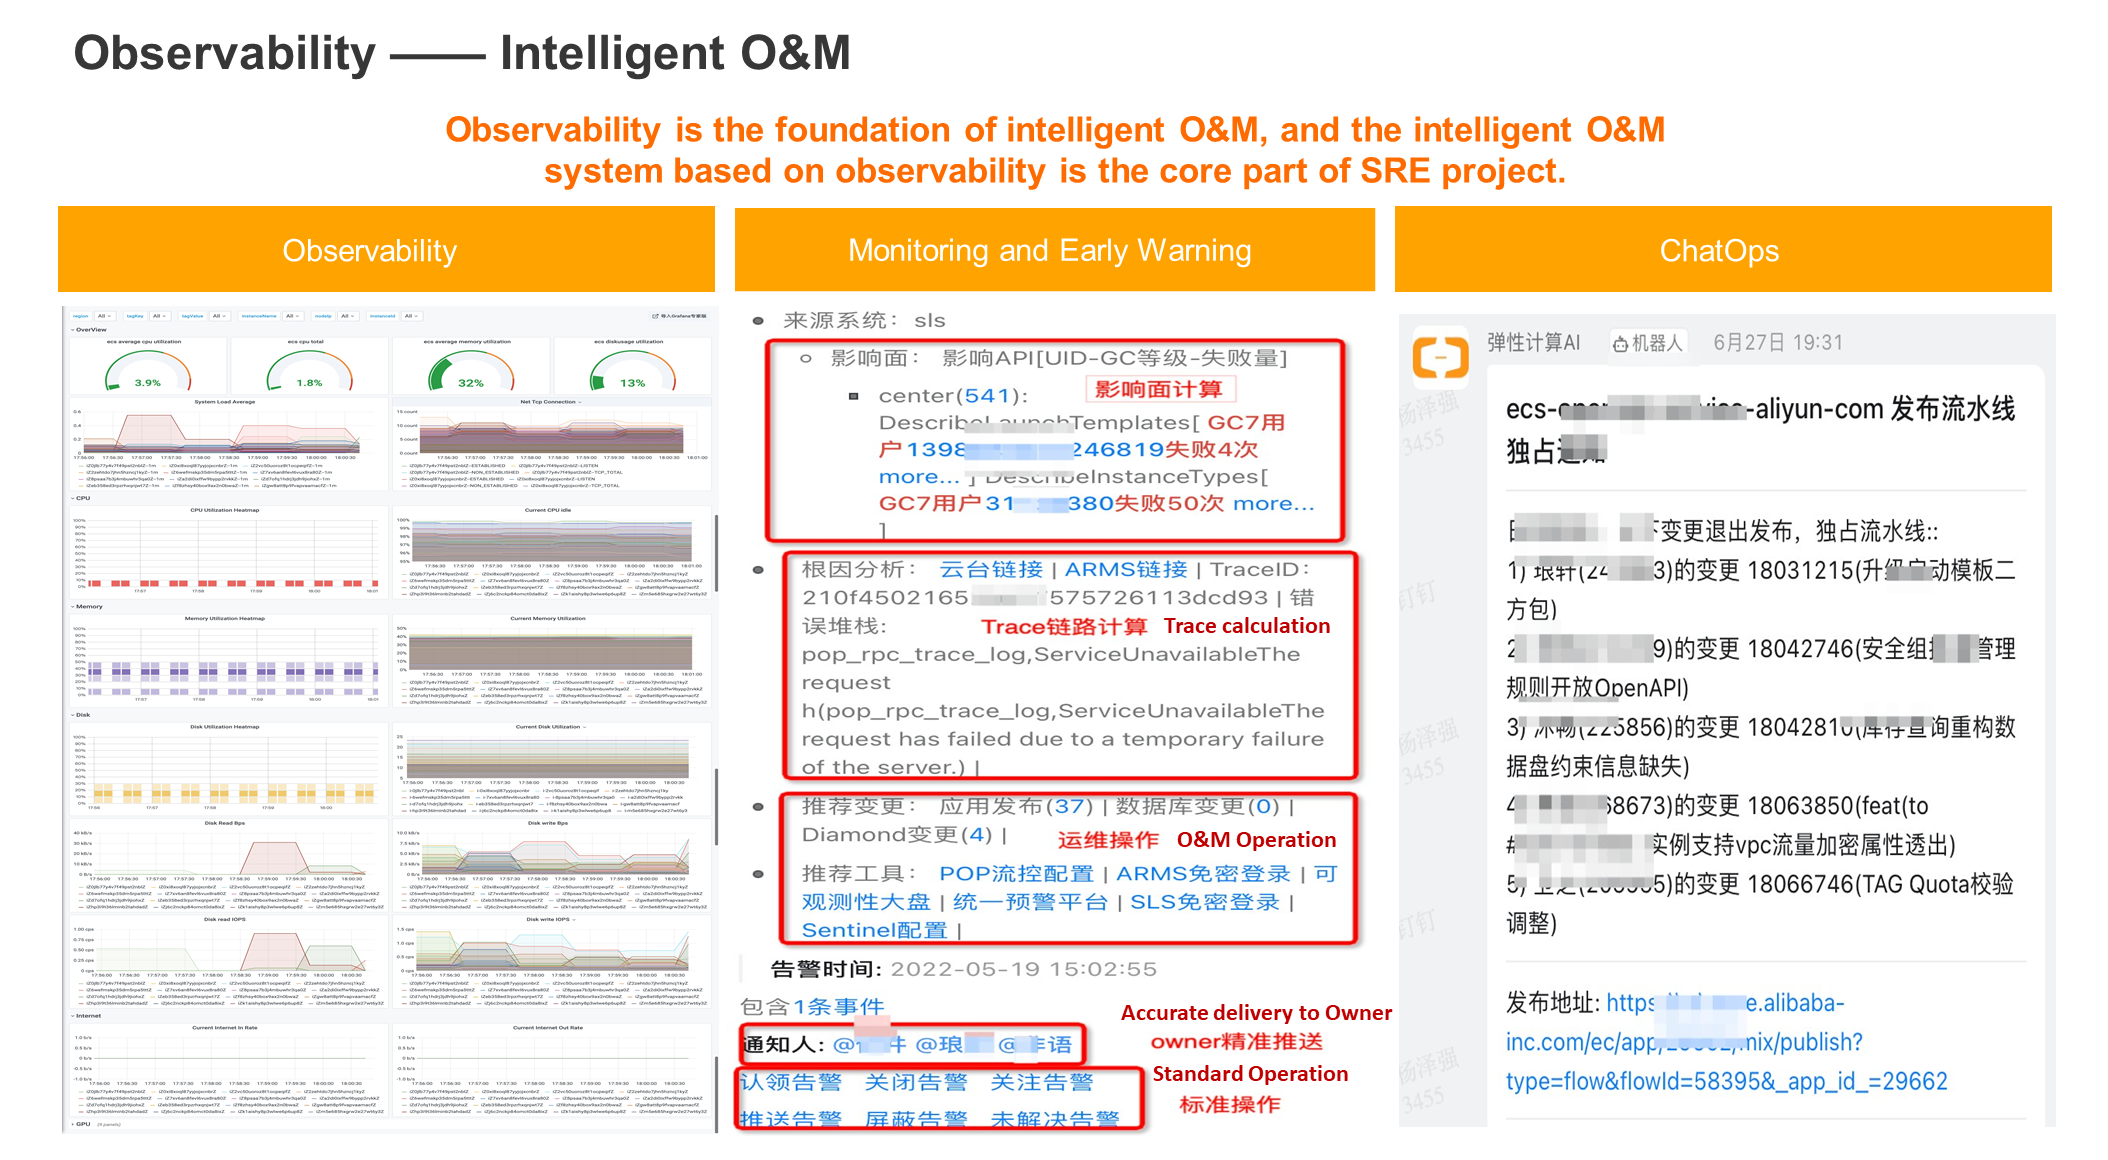
Most observability scenarios include O&M scenarios. For example, you can view metrics (such as capacity, water level, and alerts). The preceding figure shows the application of observability in O&M after cloud migration.
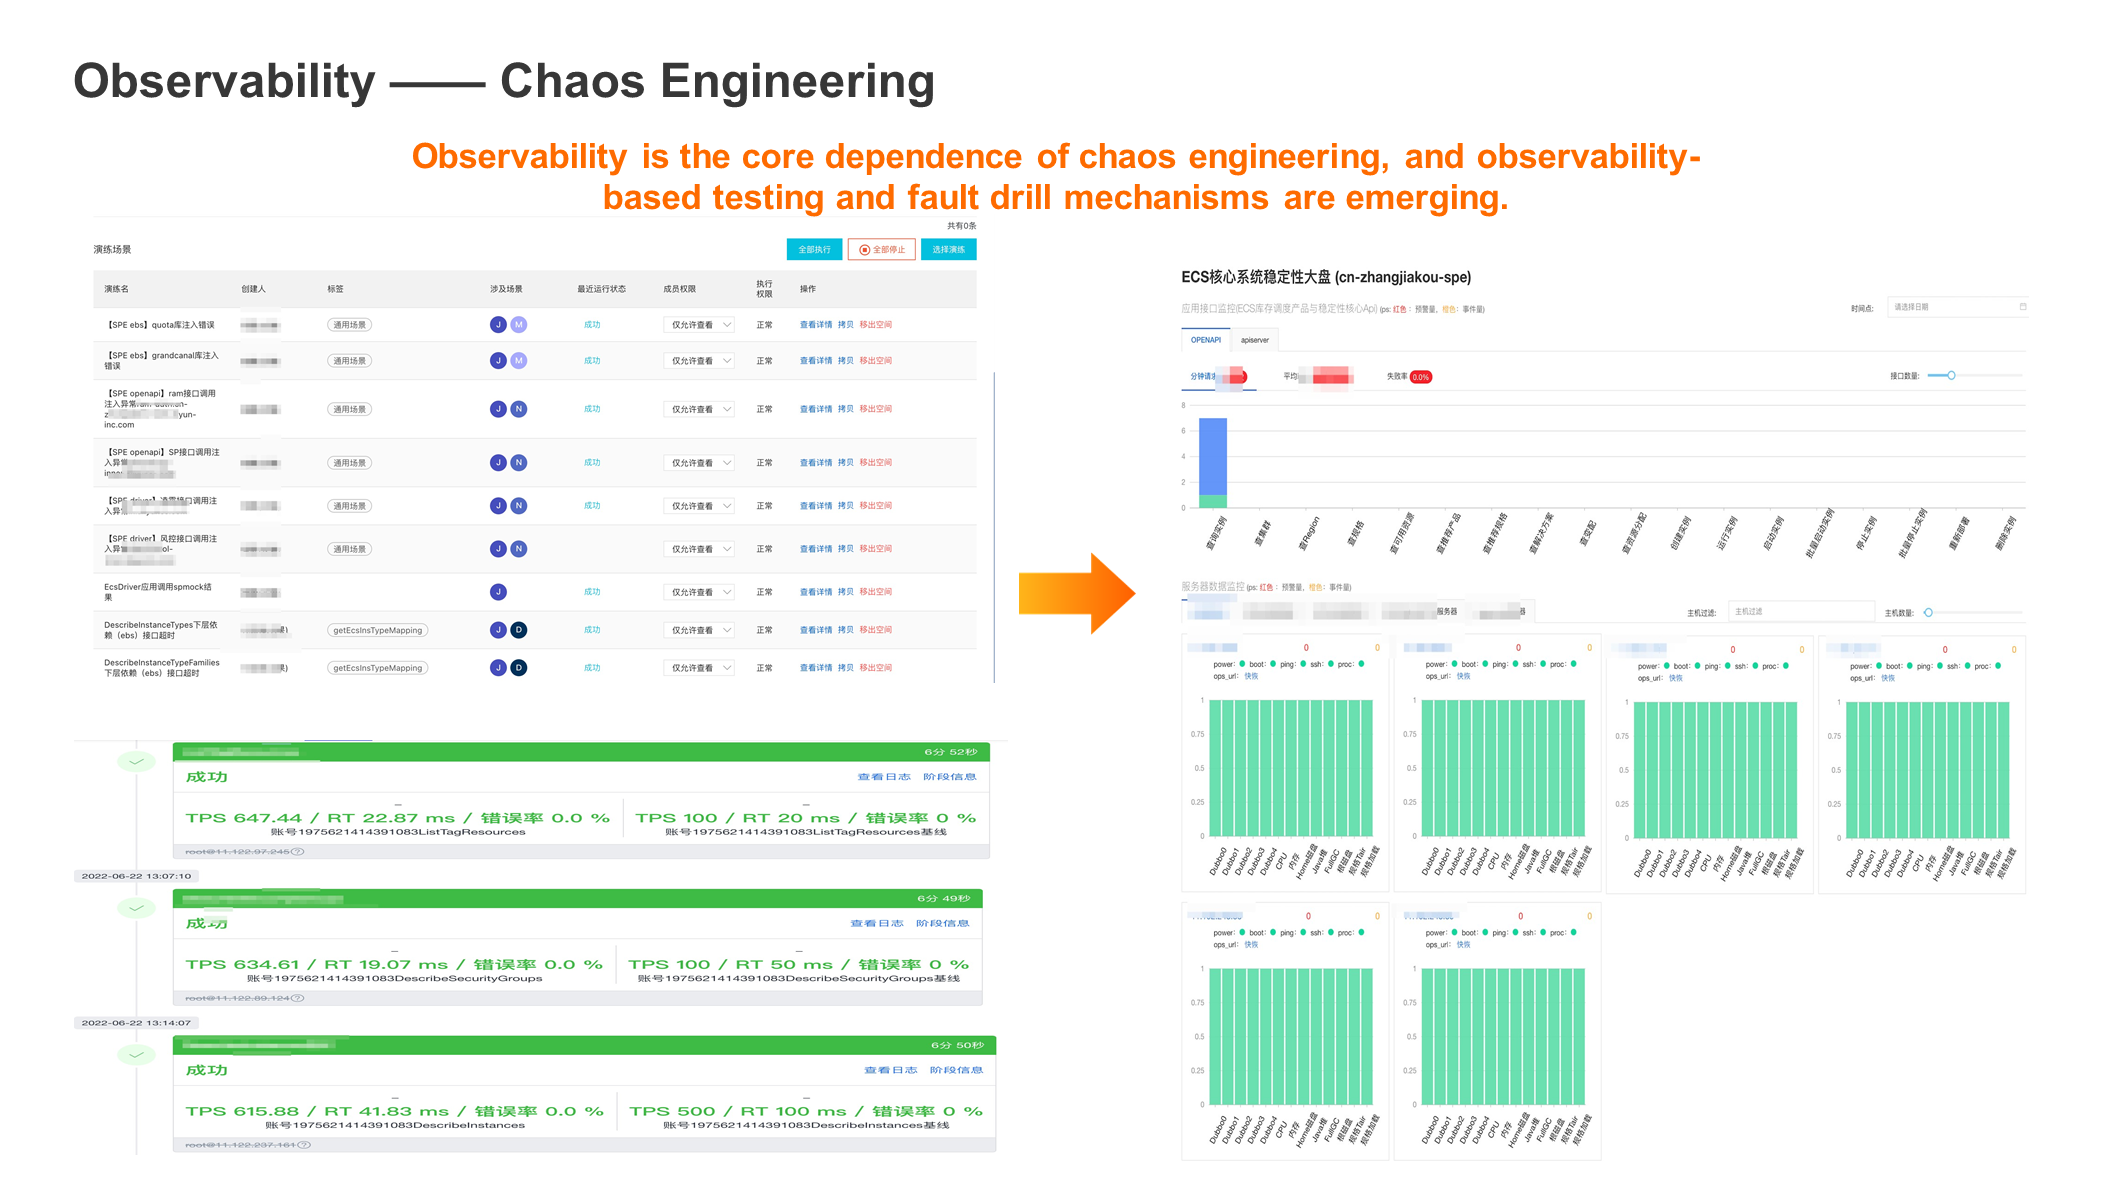
In addition, observability can be applied to chaos engineering. Observability is the core dependence of chaos engineering. The core of chaos engineering is the fault drill mechanism, which injects faults into services to check whether exceptions occur. The premise of injection failure is that the system is steady state, which needs to rely on the observability system to check the metrics. Secondly, when exploring factors that may lead to instability, it is necessary to compare the difference through observability and find out the real hidden dangers inside by looking at which systems and links are problematic to realize the excavation of hidden dangers in advance.
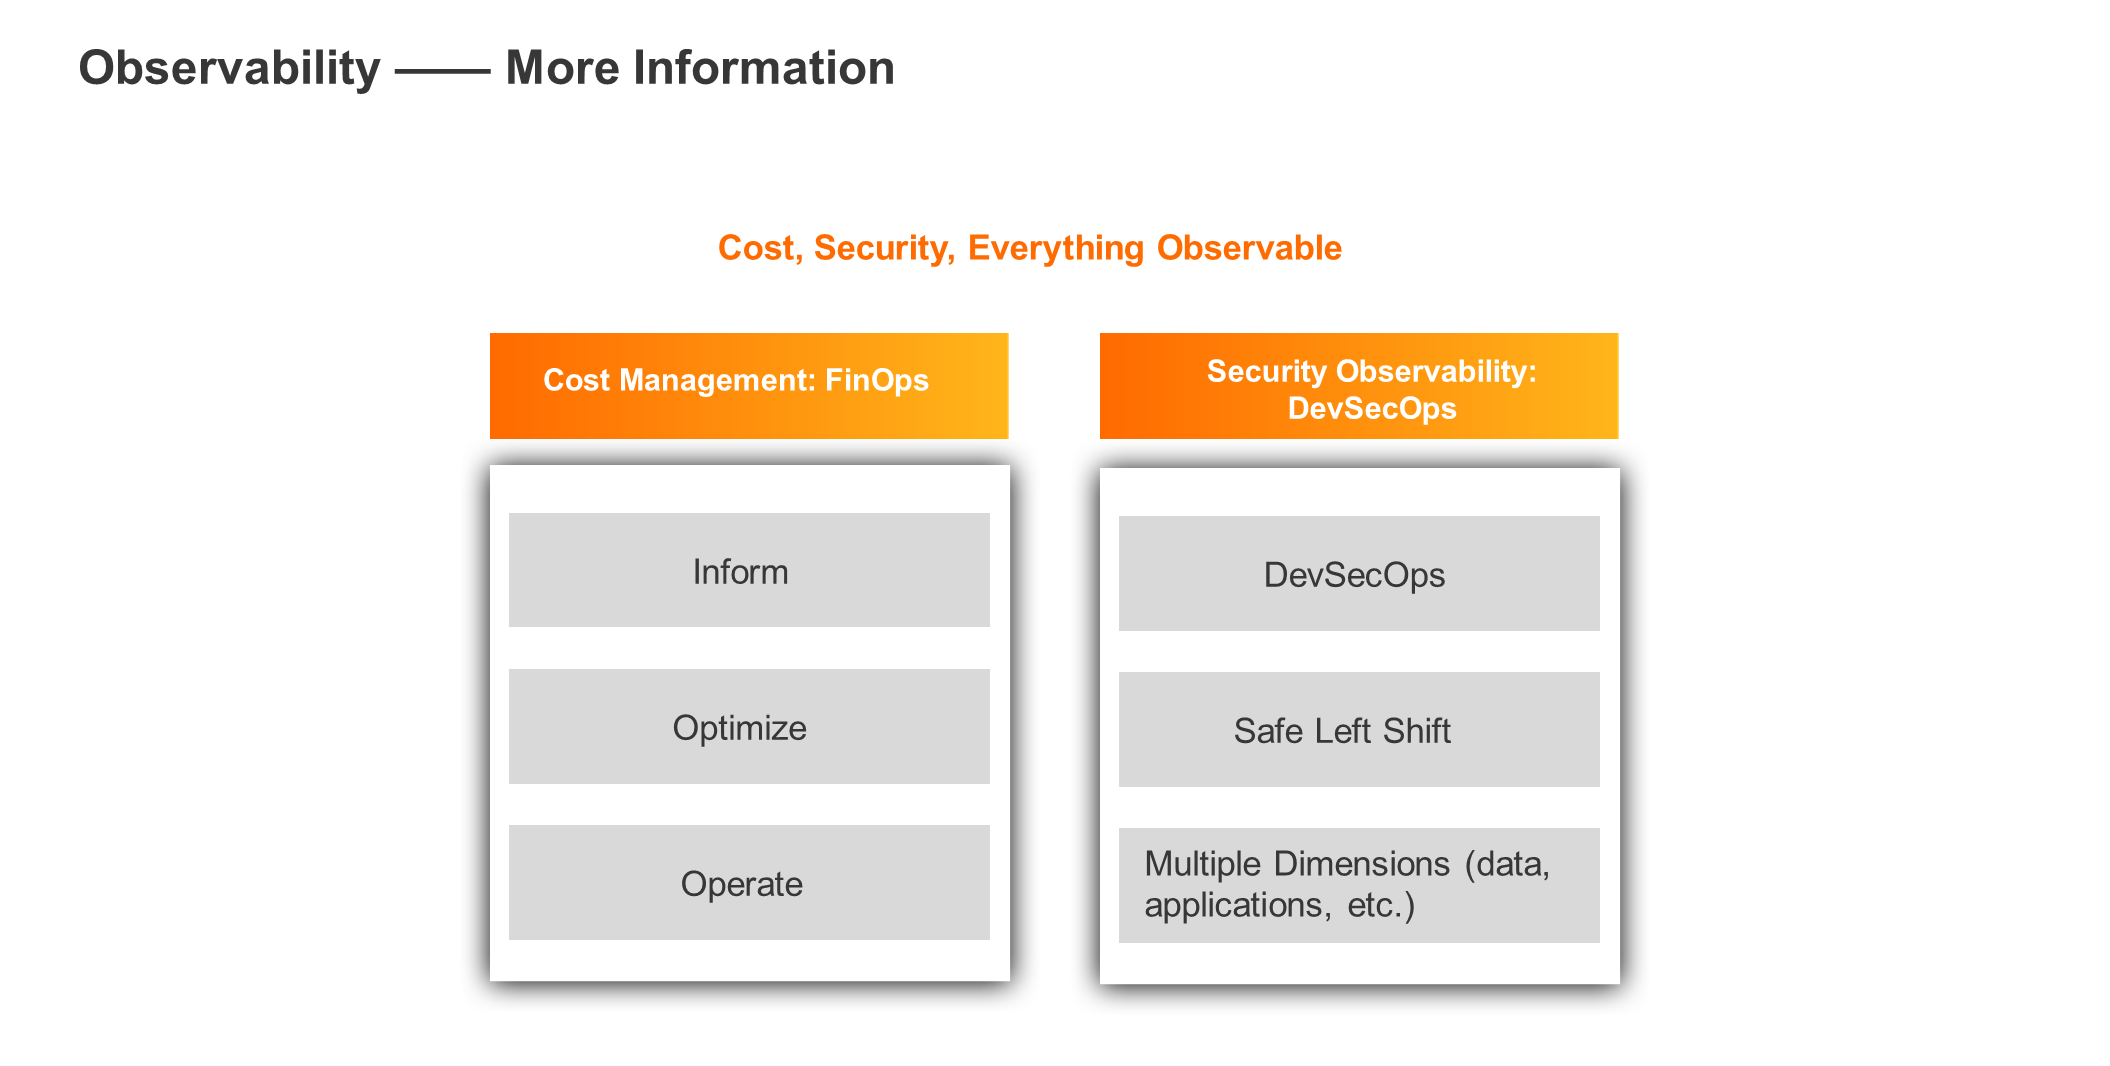
Cost management and security observability are two scenarios we are exploring.
How to reduce costs is one of the key concerns of managers. First, you need to specify the current cost. After cloud migration, there may be hybrid cloud scenarios or multi-cloud scenarios. You need to view financials and data from multiple places. The system water level and resource consumption can be obtained through observability for the next cost optimization. For example, there are many log storage when you use SLS. You can check the SLS usage and which indexes consume resources through observability.
Security observability requires that security should be preceded. Security risks (such as abnormal traffic and abnormal attacks) should be detected in advance through observability, and the security system should be improved through gradual iteration.
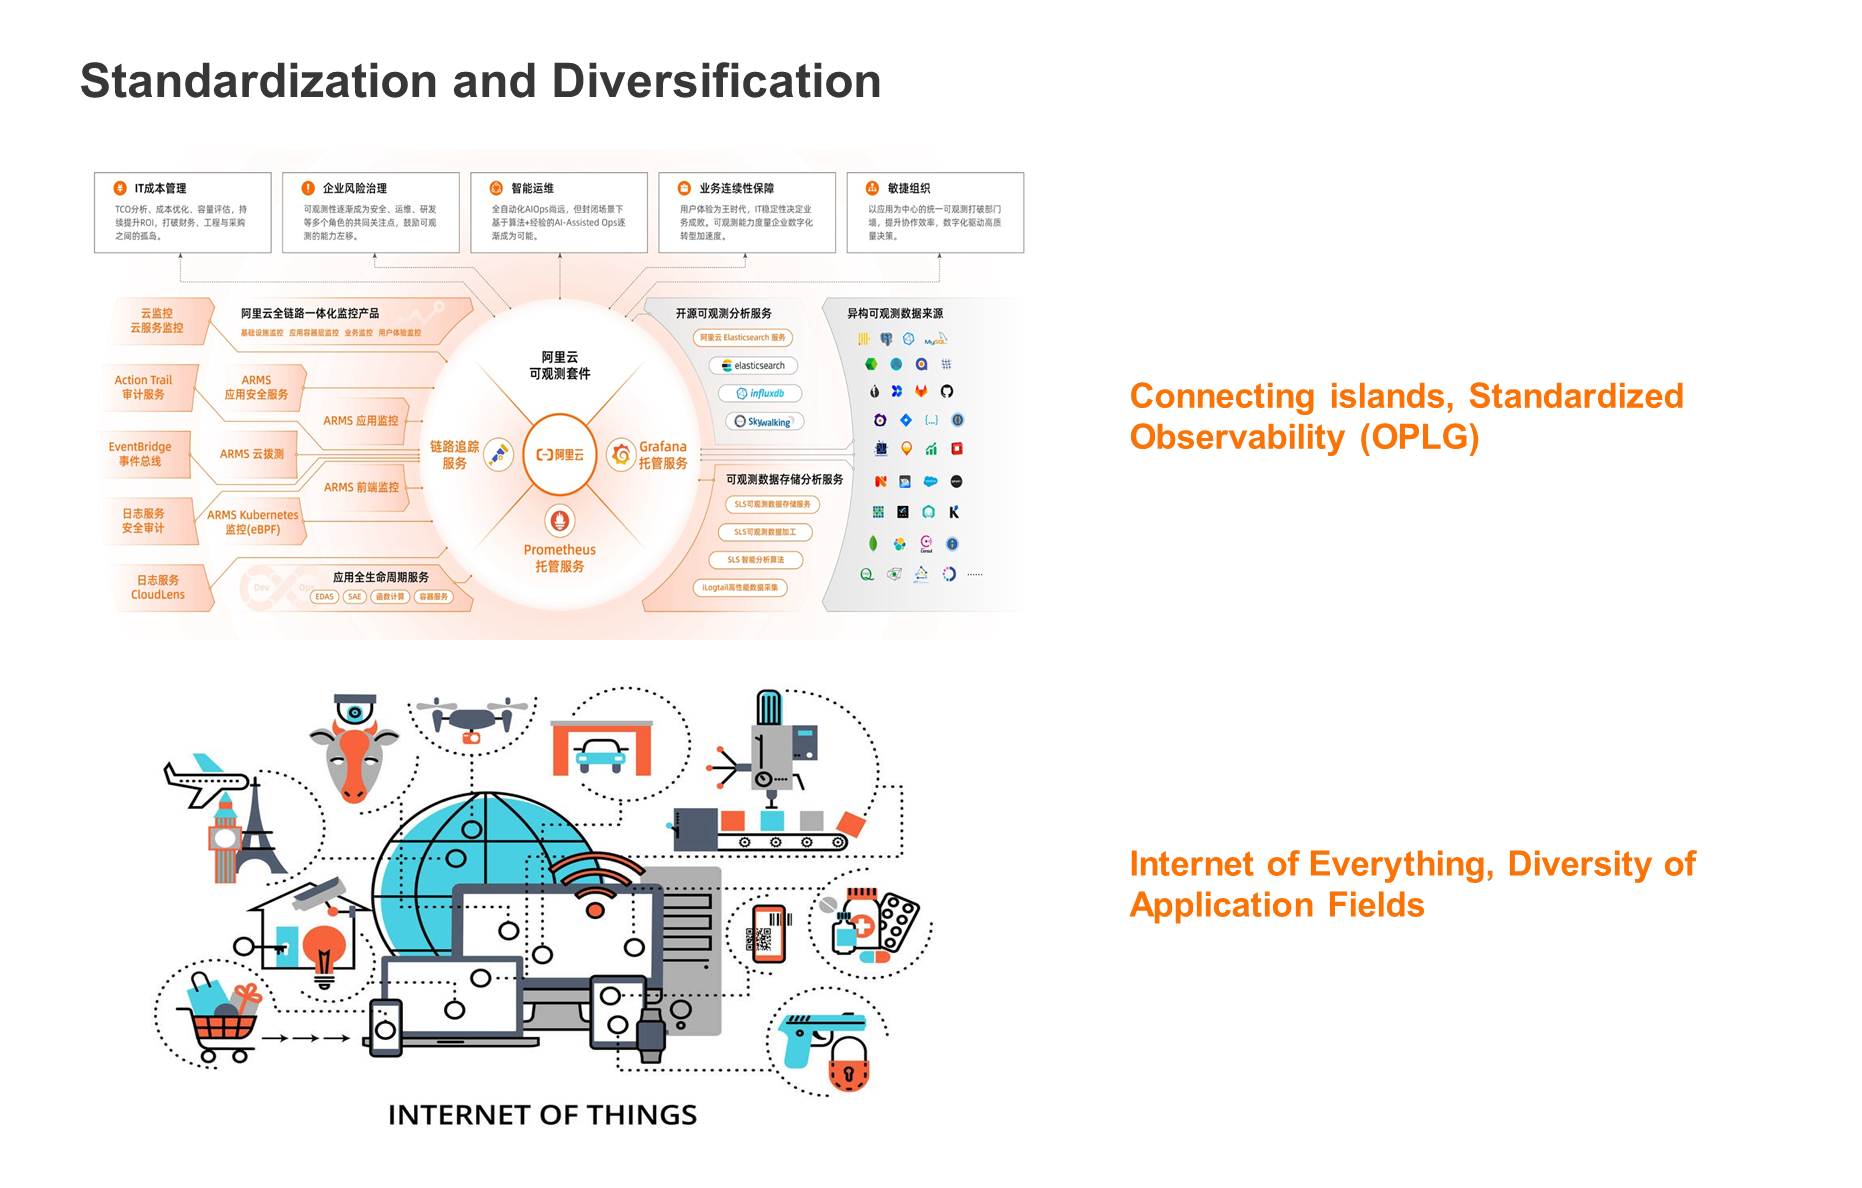
In the future, the development trend of observability will be standardization and diversification.
Observability will gradually shift from diversified products to standardized open-source standard models. The open-source and commercial products in logging, metrics, and tracing are already very rich. However, the more choices there are, the more difficult it is to make decisions or best practices. Therefore, we believe that we need to establish observability standards as soon as possible, such as OpenTelemetry for tracing, Prometheus for metrics, and Grafana for multi-data source display. Alibaba Cloud also proposed the OPLG model, where O is OpenTelemetry, P is Prometheus, L is Loki, and G is Grafana.
Diversification means the application areas of observability will be diversified. From the initial observation of monolithic applications to the later APM monitoring, various monitoring scenarios have gradually been derived to realize that everything can be monitored and observed.
Q1: Which stage of software development applies observability specifically?
A: Traditional observability is generally applied in the O&M phase, focusing on online system water levels and monitoring operations. Now, observability tends to left shift. It is applied in the architecture design of software, CI, and CD phases. For example, CI dashboards are provided. Metrics are obtained and automatically intercepted during delivery and release.
Q2: How can we get the data from different dimensions of observability?
A: The resource and platform layer and the open-source eBPF can collect data, such as MySQL, Redis, Kafka traffic, and node data. Data on the product side needs to be collected through certain development work.
Q3: What commercial products are used in the construction of Alibaba Cloud's observable system?
A: SLS and ARMS. SLS has both logging and trace features. In addition, it can build metrics and dashboards, providing a complete closed loop.
ARMS currently does not have a logging feature, only metrics and tracing features, but its advantage is that the cost is lower than SLS. In addition, ARMS provides a complete APM tool chain, including metric data and insight data (such as JVM metrics and analysis). It also provides the profile capability of Arthas and can intelligently identify system exceptions.
Q4: What is the relationship between Prometheus, Grafana links, and ARMS?
A: There is no direct relationship. ARMS provides services to host Prometheus and has commercial cooperation with Grafana. Some of Grafana's capabilities are directly hosted on Alibaba Cloud ARMS. Based on these two hosting capabilities and combined with its tracing analysis services, ARMS can combine the three to produce the effect of 1+1>2.
Q5: What metric systems need to be unified to achieve end-to-end monitoring?
A: First, the core metrics of the link, including resources, platforms, and applications, cannot be lost. Second, trace metrics are also necessary. An end-to-end link connection is a technical difficulty and can be implemented through products (such as OpenTelemetry and Skywalking). In addition, the golden three metrics, the dialing capability of the web service based on the user side, and the observability path of the user's perspective are also necessary. Let's take a shopping order as an example. The complete link from the user's perspective should be composed of gateway monitoring, payment monitoring, and order monitoring related to the whole link from the C end to the completion of the order payment. Then, these metrics can be displayed in a unified manner.
Best Practices for Cross-Zone Disaster Recovery and Multi-Site High Availability on the Cloud
Essential for Reliability Assurance – Performing Chaos Engineering on the Cloud

1,304 posts | 461 followers
FollowAlibaba Cloud Native Community - September 8, 2025
Alibaba Developer - January 5, 2022
Alibaba Cloud Native Community - July 26, 2022
Alibaba Cloud Native Community - October 22, 2025
Alibaba Clouder - November 23, 2020
Alibaba Container Service - June 23, 2025

1,304 posts | 461 followers
Follow Elastic High Performance Computing Solution
High Performance Computing (HPC) and AI technology helps scientific research institutions to perform viral gene sequencing, conduct new drug research and development, and shorten the research and development cycle.
Learn More ECS(Elastic Compute Service)
Elastic and secure virtual cloud servers to cater all your cloud hosting needs.
Learn More Function Compute
Alibaba Cloud Function Compute is a fully-managed event-driven compute service. It allows you to focus on writing and uploading code without the need to manage infrastructure such as servers.
Learn More Elastic High Performance Computing
A HPCaaS cloud platform providing an all-in-one high-performance public computing service
Learn MoreMore Posts by Alibaba Cloud Community