
By Binbin Yin and Ruiping Wan
Note: In this topic, SysOM is an O&M component of the Alibaba Cloud operating system console. The SysOM agent is an intelligent assistant of SysOM.
Over the past decade, O&M technology has been shortening the time to "find problems"-from manual inspection to automated monitoring, from threshold alerts to APM Tracing Analysis. However, there is a section of the road that has not changed: after the alarm goes off, the engineer logs on to the machine, runs the command manually, and analyzes the root cause by experience.
Today, the Alibaba Cloud OS console officially released OS O&M Skills, which completely hands over this journey to the agent.
What are Skills? In a word: Make any Operations Agent equipped with the diagnostic capabilities of an experienced kernel expert. You don't need to remember how the eBPF probe hangs, how the kernel call stack looks, and how the cgroup memory statistics are calculated-Agent uses Skill fusion analysis and monitoring, logs, and probe data to complete data collection, causal attribution, and repair decisions, and return to the complete root cause chain and repair scheme in a few minutes.
This is not an improvement in a monitoring metric, but a structural change in the O&M mode:
|
|
Old Paradigm | New Paradigm |
|---|---|---|
| Step 1 | Engineer receives alerts | Agent receives alerts |
| Step 2 | Open the Grafana/Prometheus panel | Agent Invokes Diagnostic Skill |
| Step 3 | Log on to the machine via Secure Shell and run commands one by one for troubleshooting. | Skill tells the agent how to troubleshoot the problem |
| Step 4 | Rely on experience-based cross-comparison to piece together the causal chain | Agent automates data collection and root cause analysis |
| Step 5 | Manually determine the fix solution | Agent outputs fix suggestions |
The role of engineers shifts from "a detective manually piecing together clues at 2 a.m." to "an architect who reviews diagnostic reports and decides on fix policies."
At 2 AM, an alert fires — an ECS instance hits 100% CPU. Grafana is a sea of red, and Prometheus tells you sys is at 95.8%. At this point, the job of "detecting the anomaly" is done.
But what comes next is where the real pain begins.
You log on to the machine, run top, and see CPU at 90% — then what? You need to determine which type of CPU usage is high: user, sys, or si (software interrupt)? Different indicators being high point to entirely different troubleshooting paths. For example, high sys could mean overly frequent syscalls, lock contention, page faults, or kernel reclamation, while high si is even more elusive. Even a seemingly basic O&M issue like this can leave you switching back and forth between top and ps for two hours. What Skill does is codify the analysis decision tree — equipping the Agent with extensive troubleshooting expertise.
This is the gap: monitoring systems address "anomaly detection," but from "detecting the anomaly" to "pinpointing the root cause," the process still relies entirely on engineer experience.
The OS O&M Skills introduced by SysOM are designed to bridge exactly this gap — releasing problem analysis capabilities from the hands of a few experts and delivering them to every O&M Agent.
After you install the SysOM O&M Skill, the O&M agent works as follows:
The CPU of an enterprise's core business server has periodic jitter -- sys soar above 45% every few seconds, but top cannot see any high CPU process and the business log is normal. The traditional troubleshooting method (top、strace、dmesg) 2 hours to no avail.
The engineer enters the following SysOM Agent: "The CPU utilization of my instance periodically jitters, and the sys is high." The Agent automatically calls CPU Profiling to collect the flame graph and finds that the native_queued_spin_lock_slowpath occupies more than 40% CPU-this is the slow path of the inner core spin lock. Further analyze the call stack, trace back to lookup_fast → try_to_unlazy_next → __legitimize_path, and confirm the root cause: business processes frequently access non-existent file paths, resulting in the accumulation of a large amount of Negative Dentry in the kernel Dentry Cache. When the system triggers a reclaim, the VFS path resolution is forced to downgrade from the RCU fast path to the slow path that needs to acquire the lock. A large number of concurrent threads break out severe contention on the dentry spinlock.
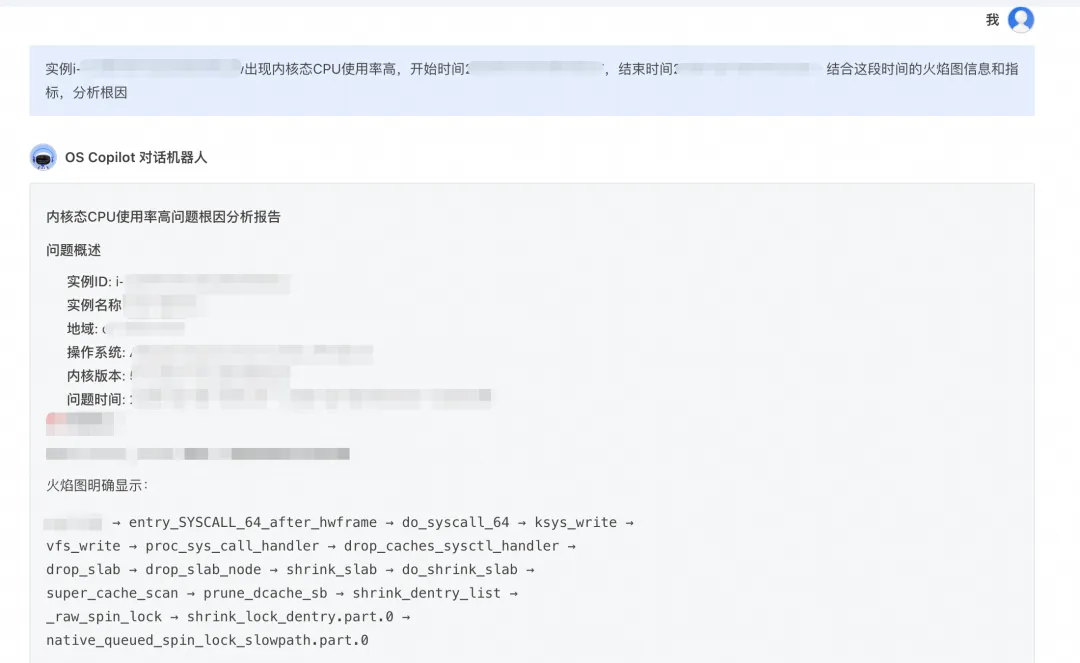
The hidden part of this problem is that high CPU processes cannot be seen at top/ps, and jitter is easily mistaken for "normal fluctuation". Traditional troubleshooting takes more than 4 hours on average. The SysOM agent takes 3-5 minutes to complete the positioning and provides a complete solution: emergency cache cleanup, repair the logic of accessing non-existent paths in the business code, and check the existence of cached files.
In a Kubernetes cluster, pods frequently trigger the WorkingSet High alert-the usage rate is 87.2% and continues to increase. However, the service runs normally without out-of-memory (OOM) or performance issues. The O&M team is caught in the dilemma of "whether to expand or ignore".
Traditional troubleshooting requires repeated switching between monitoring, nodes, and containers, starting in 1-2 hours, and the core pain point is: monitoring can see that WorkingSet and Cache are both increasing, but the question "which file occupies how much cache" cannot be answered.
After the engineer opens the SysOM agent and enters the problem description, the complete diagnostic result is returned in about 30 seconds: the /var/log/app/application.log occupies 4.88GB of cache, and four processes (one write process + three read processes) read the same log file repeatedly, pushing up the Active(file) to be included in the WorkingSet. The Agent also provides a combination of solutions: short-term log clearing to release cache to stop bleeding, long-term configuration of log rotation, and optimization of collection links to avoid the continuous waste of resource costs caused by "scaling without identifying the root cause".
Monitoring tools (Prometheus, Datadog, CloudMonitor) answer "what happened"-which indicator exceeded and when. This capability is very mature.
SysOM OS O&M Skills answers "why it happened" and "how to fix it". It does three things that traditional monitoring can't:
First, kernel-layer collection. It not only reads surface indicators from /proc, but also collects data on IO paths, scheduling latency, and memory allocation at kernel runtime. This relies on the maturity of kernel observability infrastructure such as eBPF.
Second, root cause inference. Traditional tools give you scattered indicators from iostat, vmstat, and top, requiring expert experience to analyze. Agent + Skills automatically fuses all data to complete the inference from indicators to causal chains.
Third, encapsulation as Skills. These capabilities are not buried in documents but encapsulated as Skills that agents can invoke. Any O&M agent that supports the Skill protocol — whether self-built or third-party — can obtain kernel expert-level diagnostics capabilities in a Plug and Play manner.
SysOM diagnostics is not "indicator exceeds threshold" style monitoring and alerting, but root cause analysis that dives deep into kernel runtime data. It covers analysis across 8 major scenarios:
| Subsystem | Diagnostics Capabilities |
|---|---|
| CPU | Kernel mode/user mode usage attribution, hot spot function locating, and CPU saturation analysis |
| Memory | Memory leak path tracing, out-of-memory kill trigger chain reversion, and slab assignment outlier detection |
| IO | IO latency attribution (down to the process and device level) and iowait root cause analysis |
| Network | Protocol stack layer identification for packet loss and network jitter source locating |
| Payload | Job queue depth analysis during load spikes |
| Latency | Scheduling latency attribution and real-time thread preemption behavior analytics |
| Breakdown | Automatic parsing of kernel panic call stacks |
| Parameter Tuning | Automatically tune high-frequency kernel parameters |
A single diagnosis addresses the scenario of "calling the Agent to check when something goes wrong." Going further, you can have the Agent automatically stand guard 24/7:
Management + Automatic Diagnosis: After the SysOM Agent is installed, kernel diagnosis is automatically triggered when an instance becomes abnormal, without any manual intervention. Supports single instances, ACK clusters, and batch management.
DingTalk Alerting Push: Configure the DingTalk group webhook. When an anomaly occurs, the diagnostic report is pushed directly to the team group — not just alerts, but root causes and fix solutions. What the team sees is no longer "CPU 100%", but "the dd process filled up the disk. Suggestion: kill it and adjust the log level."
This is the complete new O&M closed loop: alert triggered → Agent automatically invokes Skill for diagnosis → root cause + fix solution pushed to the group → engineer decides and executes. Humans only intervene at the last step.
Looking back at the ten-year evolution of O&M technology, each step has been about discovering problems faster. However, locating the root cause after discovering a problem has long been a craft that relies solely on people, experience, and time. It cannot scale, cannot work 7×24 online, and cannot be reused across teams.
The goal of SysOM O&M Skills is to standardize, automate, and encapsulate the craft of root cause analysis into Skills.
The value of O&M engineers will not disappear — it shifts from "executing troubleshooting" to "deciding on fix policies and designing system resilience." Skills free engineers from repetitive manual labor, giving them more time to think and do more valuable work.
If you want your O&M team to say goodbye to the "old master" dependency, try SysOM O&M Skills now.
Access the SysOM O&M Skill page to get started: https://skills.aliyun.com/skills/alibabacloud-sysom-diagnosis
You only need three things:
• An Agent
• An AccessKey ID and AccessKey secret with ECS RAM permissions, configured through Alibaba Cloud CLI
• ECS instance ID + region (for example, i-bp161qf*j5814r4, cn-hangzhou)
After installing Skill, simply tell it:
i-bp16*814r4 Hangzhou instance, CPU spiked to 100%
Skill automatically performs the environment check and diagnostic invocation, and returns complete root cause analysis and fix suggestions to you.
Alibaba Cloud Operating System Console - SysOM Agent URL:
https://alinux.console.aliyun.com/overview
If you have any questions or suggestions while using the operating system console, scan the QR code below or search for group ID : 94405014449 to join the DingTalk group for feedback and discussion.
Agents Bleeding Tokens? Agentic OS (ANOLISA) Shows You Every Line of the Token Bill

124 posts | 6 followers
FollowOpenAnolis - June 24, 2026
Alibaba Cloud Native Community - August 19, 2026
OpenAnolis - August 4, 2026
OpenAnolis - June 25, 2025
OpenAnolis - December 26, 2025
Alibaba Cloud Native Community - July 17, 2026
124 posts | 6 followers
Follow QwenWork
QwenWork is dedicated to helping employees strengthen their professional competitiveness in the AI era and to enabling enterprises to improve organizational effectiveness.
Learn More AgentCore
AgentCore unifies agent construction, governance, and execution capabilities so enterprises can deploy diverse agents with confidence.
Learn More Alibaba Cloud Linux
Alibaba Cloud Linux is a free-to-use, native operating system that provides a stable, reliable, and high-performance environment for your applications.
Learn More Qoder
Qoder
From Assisted to Autonomous — Adapting to Every Programming Need
Learn MoreMore Posts by OpenAnolis

