By Jietao Xiao
As intelligent transformation is accelerated in the automotive industry, enterprises migrate their business from on-premises clusters in data centers to the cloud and containerize applications. During this process, issues such as abnormal memory usage of pods and pod termination due to out-of-memory (OOM) exceptions frequently occur. The major challenges include:
A large number of Java tools are available to troubleshoot these issues related to Java memory usage. However, it is challenging to select a Java tool. In specific cases, no root cause is identified even if various tools are used. Based on these experiences, Alibaba Cloud has summarized troubleshooting solutions and developed the Java memory diagnostics feature in the Alibaba Cloud OS Console. This feature helps quickly identify the root causes of abnormal memory usage in Java applications from the application and OS perspectives.
To identify the root causes of unidentified memory usage, it is necessary to first understand the memory composition of a Java process and the monitoring scope covered by existing tools and monitoring services, as shown in the following figure.
• Heap memory: Users can specify the -Xms and -Xmx parameters to control the heap memory size and use the MemoryMXBean object to query the heap memory usage.
• Non-heap memory: Non-heap memory includes the metaspace, compressed class space, code cache, direct buffer, and thread stacks. The -XX:MaxMetaspaceSize parameter specifies the maximum size of the metaspace. The -XX:CompressedClassSpaceSize parameter specifies the size of the compressed class space. The -XX:ReservedCodeCacheSize parameter specifies the maximum size of the code cache. The -XX:MaxDirectMemorySize parameter specifies the maximum size of the direct buffer. The -Xss parameter specifies the size of a thread stack.
• JNI native memory: When Java code calls C or C++ code from the native library based on the Java Native Interface (JNI), the native library calls the malloc function or the system calls the brk or mmap function to allocate memory.
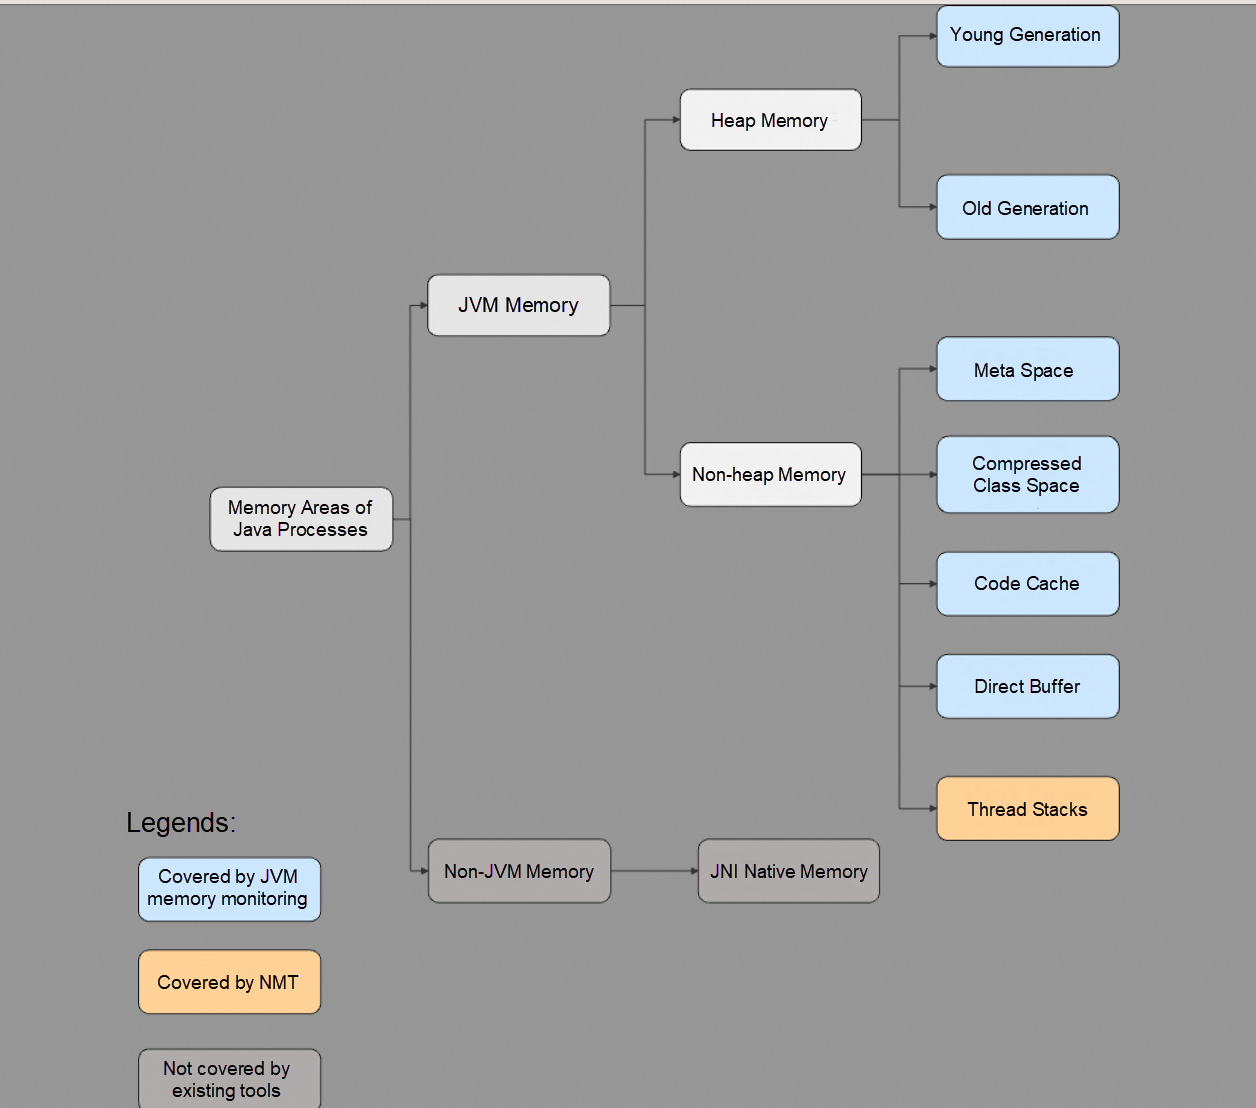
The memory composition of a Java process reveals the first cause of Java memory blackholes: JNI native memory, whose size cannot be queried by using existing tools.
Generally, developers who write related business code may assume that such an issue does not occur if their code does not directly call code from the C library based on JNI. However, various packages referenced in the code may use JNI native memory. For example, if zlib is improperly used, JNI native memory leaks may occur[2].
Those familiar with Java know that a JVM is implemented in C++. When the JVM calls the malloc or free function to request or release memory, libc manages memory before the OS allocates memory or the released memory is returned to the OS. In the following example, the default memory allocator ptmalloc in glibc is used.
Chunk is the minimum unit for heap memory allocation in glibc, which represents a contiguous memory area. ptmalloc maintains an arena for each thread. Each arena contains a chunk called top chunk and bins that contain chunks. When an application requests or releases memory by calling the malloc or free function, ptmalloc preferentially requests and releases chunks in bins. If no bins meet the requirements, ptmalloc requests chunks from the top chunk. If the top chunk is insufficient, ptmalloc calls the brk or mmap function to request memory from the OS.
This example shows that libc may request more memory than requested by the application and detain idle memory, resulting in differences between JVM memory usage and actual memory occupied by processes. The following common issues related to libc may occur:
• A multi-thread 64-MB arena occupies memory. libc creates a 64-MB arena for each thread. By default, a large number of threads may cause memory waste[3].
• The top chunk cannot be released back to the OS at the earliest opportunity due to memory blackholes[4].
• Memory chunks are cached in bins. The memory released by the JVM is cached in bins, resulting in memory usage differences[4].
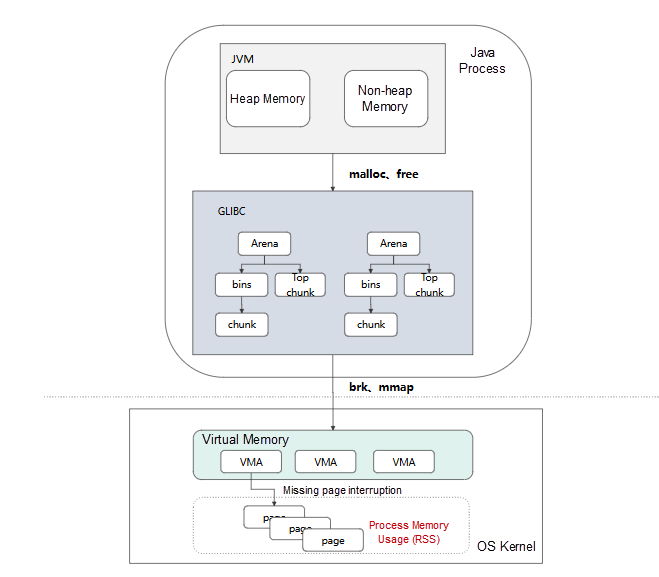
At the OS layer, the transparent huge page (THP) mechanism in Linux also causes the difference between JVM memory usage and actual memory usage. In simple terms, the THP mechanism can consolidate 4-KB pages into huge 2-MB pages to reduce translation lookaside buffer (TLB) misses and page faults. This improves application performance but causes memory waste. For example, an application requests 2 MB of virtual memory and occupies only 4 KB of memory. Due to the THP mechanism, the OS allocates a 2-MB page[5].
The OS Console is a one-stop O&M management platform developed by Alibaba Cloud based on O&M on millions of servers. The OS Console integrates core features such as monitoring, system diagnostics, continuous tracking, AI observability, cluster health check, and OS Copilot to troubleshoot various complex issues such as high cloud load, network latency and jitter, memory leak, OOM, downtime, I/O traffic analysis, and performance jitter.
The following example shows how to use the panoramic memory analysis feature[5] in the OS Console to identify the cause of abnormal Java memory usage. In this example, a customer in the automotive industry migrates clusters from a data center to Container Service for Kubernetes (ACK) clusters in the cloud.
OOM exceptions occasionally occur in Java service pods in multiple clusters and multiple services on the cloud of the customer, without service exceptions, request exceptions, and traffic exceptions. The JVM memory usage does not fluctuate greatly based on the monitoring data. The customer sets the maximum memory size to 5 GB, and the normal memory usage is around 3 GB.
• Perform panoramic memory analysis on pods when the memory usage becomes high. The pod memory usage is close to the upper limit. The diagnostics results and pod memory usage analysis results show that the high pod memory usage is mainly caused by a Java process.
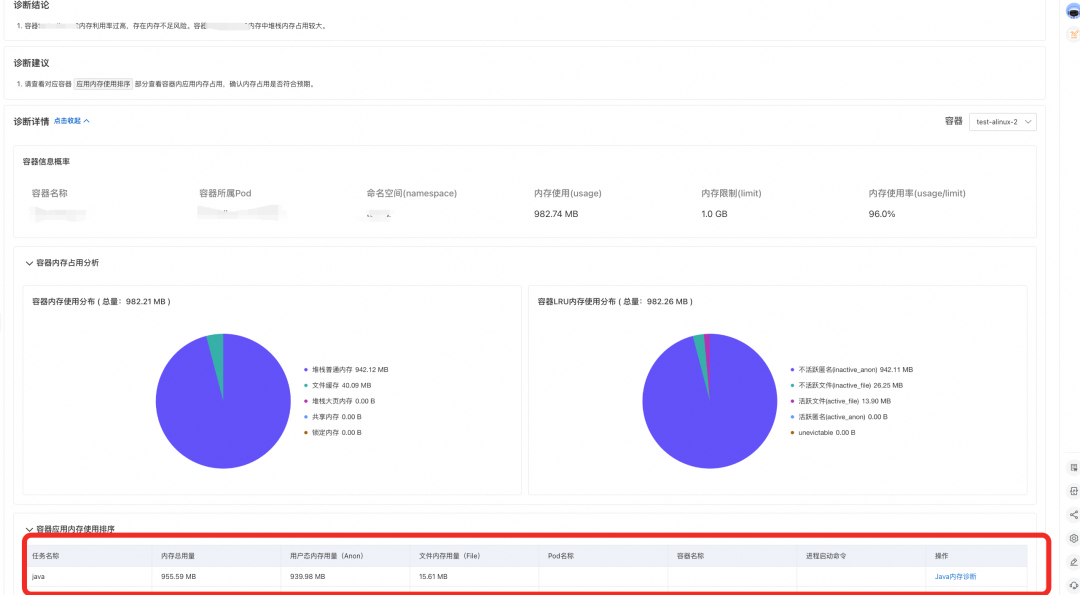
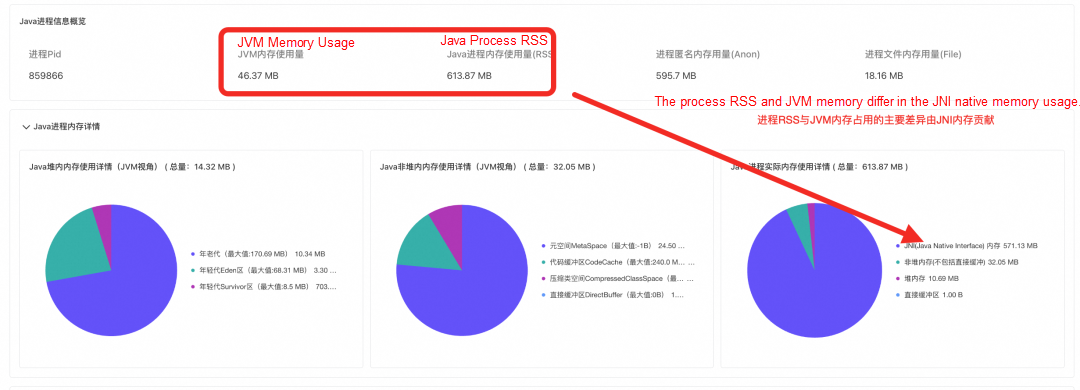
Perform memory analysis on the Java process and view the diagnostics report. The report displays the resident set size (RSS) and working set memory information of the pods and containers where the Java process runs, process identifier (PID), JVM memory usage, memory used by the Java process, anonymous memory usage, and memory used by process files.

The diagnostics results and the pie chart of Java memory usage show that the actual memory used by the process is 570 MB more than the JVM memory usage. The excess memory usage is caused by JNI.
View the JNI memory allocation profiling report. The report provides a flame graph for JNI memory allocated to the Java process. The flame graph displays all traces in which JNI was called. (Note: The sampled data in the flame graph is for reference only. The memory size in the flame graph does not represent the actual allocated memory size.)
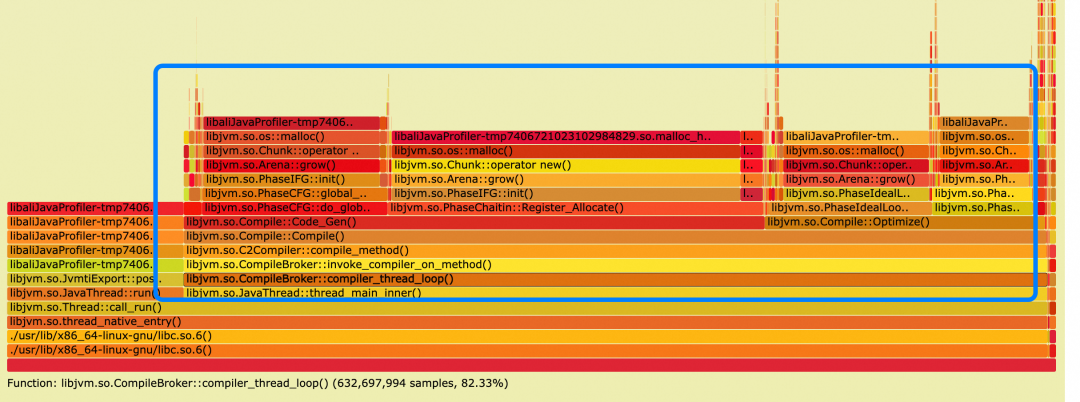
• The preceding flame graph shows that the memory was requested for the C2 compiler to perform warm-up for just-in-time (JIT) compilation.
• However, no memory surge is monitored on the pod during the diagnostics process. In this case, use the Java CPU hotspot tracking feature[7] that supports continuous operation to capture the process hotspots when the memory usage increases, and use the hotspot comparison feature[8] to compare the captured process hotspots with the hotspots when the process memory usage is normal.
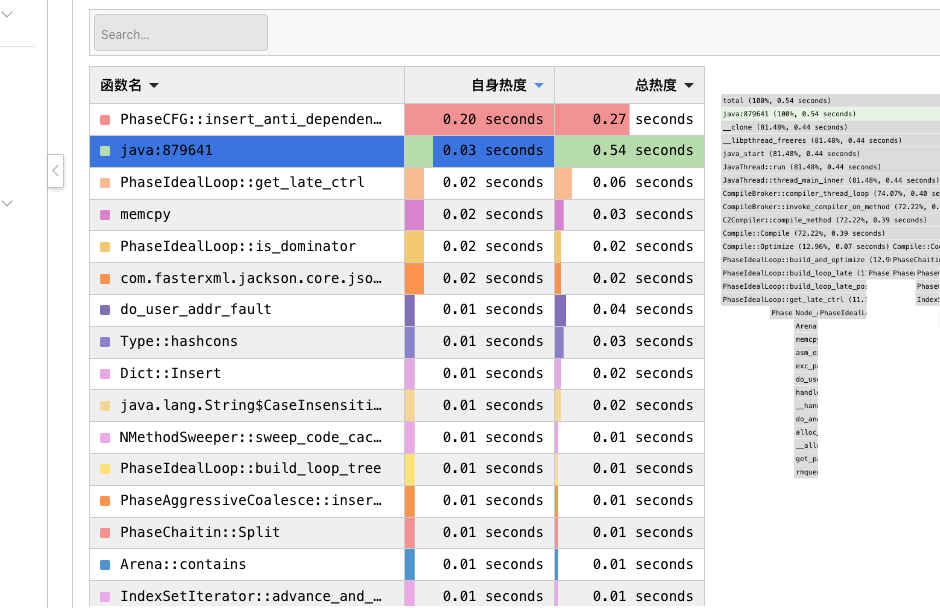
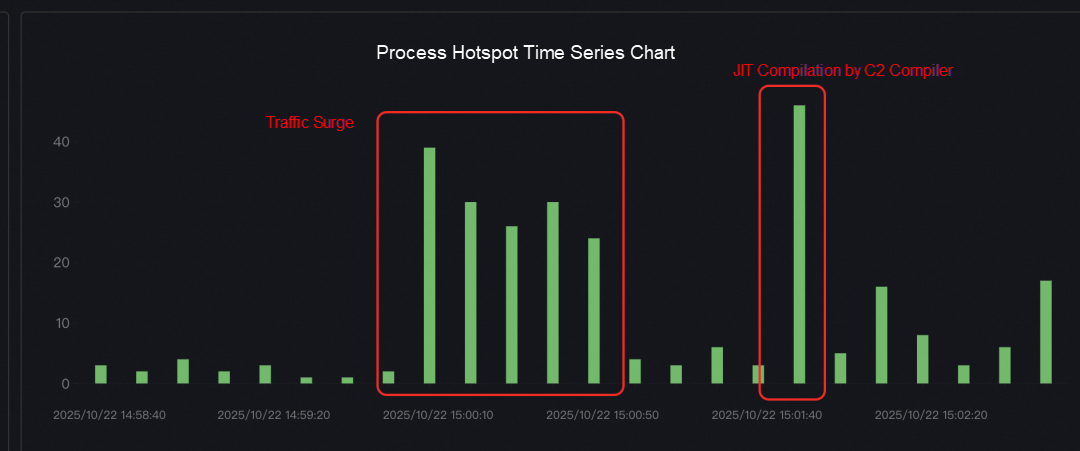
• The analysis and comparison results of the hotspot stacks and hotspots show that the CPU stack at the point in time when the memory usage increased corresponds to the JIT stack of the C2 compiler, specific business traffic surged before the C2 compiler performed warm-up for JIT compilation, and a large number of reflection operations were performed in the business code. Reflection operations cause the C2 compiler to perform new warm-up operations.
The C2 compiler requests JNI native memory to perform warm-up for JIT compilation, and additional memory is requested due to memory blackholes in glibc. The memory is released with a delay.
[1] Alibaba Cloud OS Console on the PC client: https://alinux.console.aliyun.com/
[2] Native memory leak in java.util.zip: https://bugs.openjdk.org/browse/JDK-8257032
[3] Memory waste in glibc with default configuration: https://bugs.openjdk.org/browse/JDK-8193521
[4] glibc does not release the top chunk and chunks in the fast bin: https://wenfh2020.com/2021/04/08/glibc-memory-leak/#332-fast-bins-%E7%BC%93%E5%AD%98
[5] Excessive memory is used by go applications due to THP: https://github.com/golang/go/issues/64332
[6] Panoramic memory analysis in the Alibaba Cloud OS Console: https://help.aliyun.com/zh/alinux/user-guide/memory-panorama-analysis-function-instructions?spm=a2c4g.11186623.0.i1#undefined
[7] Hotspot tracking in the Alibaba Cloud OS Console: https://help.aliyun.com/zh/alinux/user-guide/process-hotspot-tracking?spm=a2c4g.11186623.help-menu-2632541.d_2_0_2_0.674a698dkLRagc&scm=20140722.H_2849500._.OR_help-T_cn~zh-V_1
[8] Hotspot comparison and analysis in the Alibaba Cloud OS Console: https://help.aliyun.com/zh/alinux/user-guide/hot-spot-comparative-analysis?spm=a2c4g.11186623.help-menu-2632541.d_2_0_2_1.118569efrdHqOx&scm=20140722.H_2849536._.OR_help-T_cn~zh-V_1
Alibaba Dragonwell 21 AI Extension: Unleash Java's Performance Potential in the AI Era

104 posts | 6 followers
FollowOpenAnolis - March 5, 2026
OpenAnolis - March 25, 2026
Alibaba Cloud Native - February 2, 2024
Alibaba Cloud Community - October 10, 2022
OpenAnolis - February 2, 2026
OpenAnolis - September 4, 2025

104 posts | 6 followers
Follow Alibaba Cloud Linux
Alibaba Cloud Linux is a free-to-use, native operating system that provides a stable, reliable, and high-performance environment for your applications.
Learn More YiDA Low-code Development Platform
A low-code development platform to make work easier
Learn More mPaaS
mPaaS
Help enterprises build high-quality, stable mobile apps
Learn More ChatAPP
Reach global users more accurately and efficiently via IM Channel
Learn MoreMore Posts by OpenAnolis