By Jianming Que

In a Kubernetes environment, WorkingSet (working set memory) directly affects pod scheduling, eviction, HPA, and resource quota. It is the most critical indicator for container memory management. However, a "seemingly dangerous but actually stable" situation often occurs in production: WorkingSet keeps rising and triggers alerting, yet the business runs normally.
The most common cause of such scenarios is that active file cache is included in WorkingSet. Although the cache is usually reclaimable, it still triggers alerting and affects scheduling, leaving the O&M team in the dilemma of "whether to scale-out or ignore it".
Traditional methods often require switching back and forth between monitoring, edge zones, and containers, taking at least 1–2 hours:
SysOM Agent is an operating system realm AI Agent built by Alibaba Cloud based on Large Language Model (LLM) technology, purpose-built for diagnosing System issues such as memory, Performance, and stability. It integrates the capabilities of SysOM MCP (System diagnostics toolset) , providing in-depth server diagnostics capabilities based on SysOM. Through conversational interaction, SysOM Agent can converge traditional troubleshooting that requires "multiple tools + multiple steps + extensive experience" into a single natural language conversation, completing root cause identification within 30 seconds. It is currently available on the operating system console (via OS Copilot), and can also be integrated via MCP. The following sections describe specific usage methods, along with real-world cases and Best Practices.
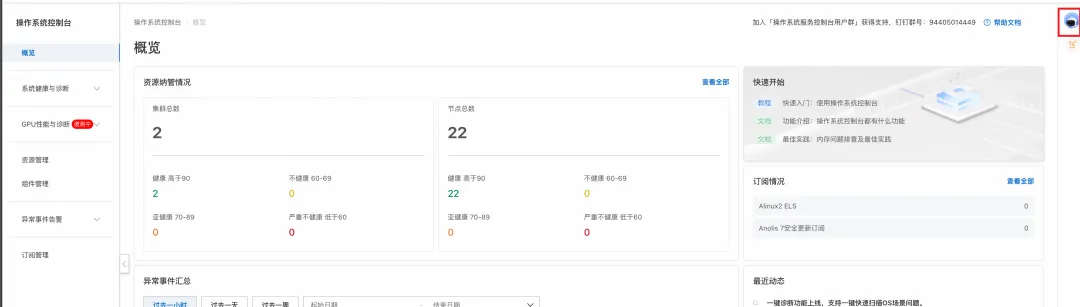
Log on to the Alibaba Cloud operating system console, click SysOM Agent Assistant in the upper-right corner, and enter a description to start analysis. For example, enter "The memory usage of container xxx in cluster xxx is too high."
If you want the same system diagnostics capabilities in your own AI assistants (such as Claude Desktop, Cursor, and enterprise chatbots), you can integrate SysOM MCP.
SysOM MCP is an open source system diagnostics tool set from Alibaba. Based on the Model Context Protocol (MCP) standard, it provides server diagnostics capabilities used by the underlying OS. With MCP integration, you can get diagnostics capabilities similar to SysOM Agent in any MCP-enabled AI assistant.
Project address: https://github.com/alibaba/sysom_mcp
Applicable scenarios:
• Integrate into an enterprise's Internal AI assistant or O&M robot.
• Initiate diagnostics directly in an IDE (e.g., Cursor).
• Build a custom artificial intelligence for IT operations platform.
This article uses a real Case to show how SysOM Agent accurately identifies the root cause of an abnormal WorkingSet increase.
In a Kubernetes cluster, pods frequently trigger WorkingSet High alerting:
• Alerting: Pod WorkingSet usage at 87.2% and continues to increase
• Business: Run Normal, no out-of-memory, no obvious performance issues
• O&M confusion: scale-out or ignore? What is the root cause?
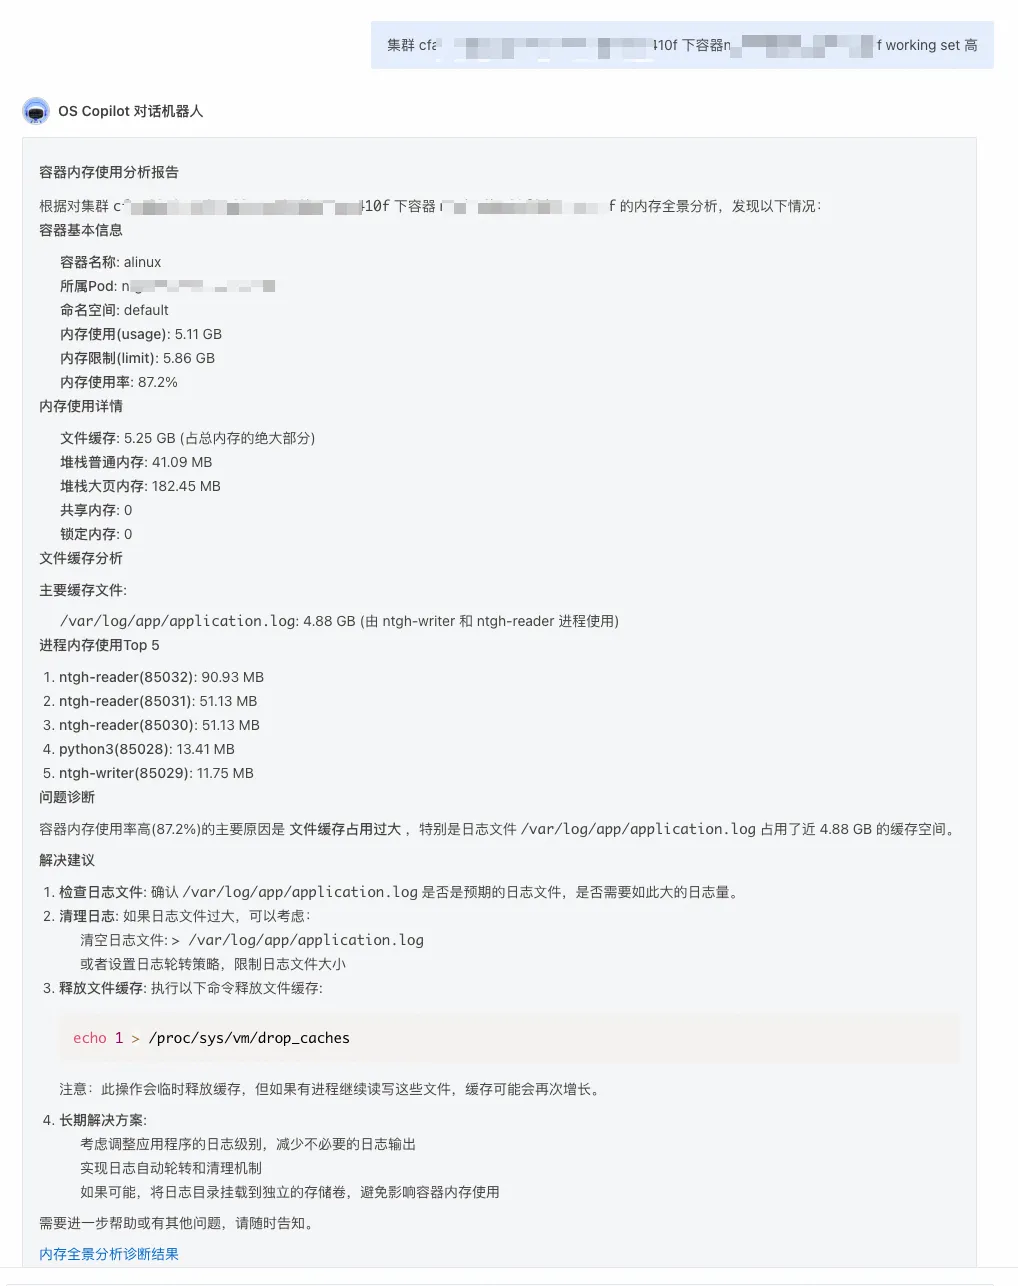
The returned info directly shows that:
• Root cause: The log file /var/log/app/application.log occupies 4.88 GB of cache.
• Associated processes: 4 processes (1 ntgh-writer + 3 ntgh-reader).
• Abnormal pattern: Multiple processes repeatedly read the same log file, pushing up Active(file).
• Solutions: Short-term cleanup/release + long-term optimization (log rotation, read/write pipeline restructuring, such as MQ).
| Comparison item | Traditional solution | SysOM Agent (this case) |
|---|---|---|
| Root cause identification | 1–2 hours of investigation, and the root cause may still not be identified. | Directly locate the 4.88 GB log file path |
| Key data | Missing file-level cache usage | Provides the total file cache size and top file details. |
| Associated process | Requires running lsof one by one, making it difficult to correlate. | Automatically associate 4 processes (1 write + 3 read) |
| Abnormal pattern | Rely on manual inference | Automatically detect "repeated read" patterns |
| Solutions | Tends toward scale-out, continuously paying for redundant resources that go unused | Short-term mitigation + long-term administration full path: address the root cause first, then decide whether to upgrade specifications |
| Duration (seconds) | 1 to 2 hours | ~30 seconds |
In this Case, the agent does not stop at the alerting number, but connects Files, processes, and cache into an interpretable chain. The following describes three layers: the direct value demonstrated in the Case and the technical capabilities behind it.
Traditional methods cannot see File-level cache usage and can only guess. SysOM Agent directly provides:
• Precise to the File path: /var/log/app/application.log.
• Cache hit Size: 4.88 GB.
• Automatically sorted by usage, making hotspots visible at a glance.
• The original 30–40 minutes of one-by-one troubleshooting compressed to 30 seconds.
Often you will see that a process RSS is only tens of MB, but cannot Interpret why the WorkingSet is High. SysOM Agent fills in the missing chain:
• Detect the combination of a write process and multiple read processes.
• Extract the abnormal pattern: repeated reads → File cache increase → WorkingSet increase.
• Correlate the alerting value (87.2%) with specific behaviors.
The Suggestions provided by SysOM Agent are by no means a simple "scale out and see" — that approach often means blindly increasing Cost before a real memory bottleneck is proven. Instead, it offers a set of actionable, executable measures:
• Short-term: Clear logs, release cache, and perform immediate remediation.
• Long-term: log rotation, data collection pipeline optimization, reducing redundant reads, and replacing File polling with MQ/streaming manner when necessary.
• Each Suggestion provides specific execution methods and parameter guidance for easy implementation.
SysOM Agent combines deep System diagnostics capabilities with Large Language Model (LLM) inference, converging traditional work that requires "multiple tools + multiple steps + extensive experience" into a single conversation:
• Automatic data collection: obtains key facts from multiple layers including kernel, cgroup, process, and File cache.
• Intelligent association analysis: establishes the association graph of File–process–cache–WorkingSet.
• Abnormal pattern detection: Automatically classifies common patterns such as repeated reads, log stacking, and abnormal File cache growth.
• Artificial Intelligence Recommendation: Provides an executable Fix path based on Best Practices and environment context.
These collection and inference capabilities are exactly what enable the second-level root cause attribution, low-barrier usage, and actionable Solutions described above (hours → seconds, no need to piece together a toolchain, immediate remediation + long-term administration). Accurately pinpointing the root cause also avoids blind scale-out before the need is proven — fewer unnecessary Specification upgrades, fewer stacked edge zones and replicas, and spending Cost on real gaps is itself a direct way to save money.
When facing pod WorkingSet High alerting, traditional troubleshooting often requires switching back and forth between monitoring, edge zones, and containers. It takes 1–2 hours at minimum and may still fail to locate the File-level root cause. SysOM Agent turns this into a single conversation:
• Locate the root cause in 30 seconds: From hours down to seconds.
• One line is all it takes: no kernel background required, no toolchain assembly needed.
• Pinpoint to File and process: identify "who is consuming how much, who is reading/writing, and why usage is growing".
• Ready-to-use Solution: immediate remediation in the short term + long-term administration, avoiding continuous resource Cost from scale-out without identifying the root cause.
Try the Alibaba Cloud Operating System console now and transform memory diagnostics from "experience-based troubleshooting" to an engineered flow that is "Interpretable, reproducible, and executable".
Alibaba Cloud Operating System Console - SysOM Agent: https://alinux.console.aliyun.com/overview

123 posts | 6 followers
FollowAlibaba Cloud Native Community - August 19, 2026
OpenAnolis - July 14, 2026
OpenAnolis - August 4, 2026
OpenAnolis - April 20, 2026
OpenAnolis - May 27, 2026
Alibaba Cloud Native Community - August 25, 2026
123 posts | 6 followers
Follow QwenWork
QwenWork is dedicated to helping employees strengthen their professional competitiveness in the AI era and to enabling enterprises to improve organizational effectiveness.
Learn More Token Plan
Build more, spend less. One plan, every modality.
Learn More Bastionhost
A unified, efficient, and secure platform that provides cloud-based O&M, access control, and operation audit.
Learn More Managed Service for Grafana
Managed Service for Grafana displays a large amount of data in real time to provide an overview of business and O&M monitoring.
Learn MoreMore Posts by OpenAnolis

