Since Alibaba Cloud released its first agent-oriented operating system — Agentic OS on March 30, we have received enthusiastic feedback from many users. The most frequently mentioned question is: "How can I minimize token consumption?" Behind this question are actually several smaller questions: With such a large token bill, which agent spent these tokens? At which step were they spent? Was there any waste?
Wasted tokens should be cut. But you can only cut waste once you can see where tokens go. In the past, token consumption was a black box — you only knew the total at the end of the month, not where each charge went. It's like receiving a credit card bill that shows only the grand total: you want to spend less, but you can't even tell which charge to kill first.
Recently, Agentic OS (ANOLISA) published multiple features, among which the AgentSight widget provides a visualization panel that shows the global status of agents and the destination of every token.
AgentSight is the observability widget of Agentic OS (ANOLISA). It addresses the problem that agent token consumption far exceeds expectations while users lack the means to detect and trace it. With zero intrusion into business logic, it performs fine-grained data collection and correlation analysis across the agent's entire runtime.
You let the agent run around the clock, processing tickets, executing inspections, and responding to requests. But you can't watch it around the clock. This is the most fundamental tension in agent operations.
In the past, you may have encountered these scenarios: the agent silently got stuck in the background, and you didn't notice until the next time you opened the terminal; a critical job was broken without anyone alerting you; tokens quietly consumed hundreds of thousands, and you didn't realize costs were out of control until the bill arrived at the end of the month. What you can't see, you can't manage.
The visualization panel of the AgentSight widget turns these "invisible" issues into an "all-in-one-screen" view. Open the panel and you can see the health status, active sessions, and abrupt interruptions of agents on Agentic OS (ANOLISA) — which are online, which are offline, and which are stuck. Data is refreshed in real time, from global overview to individual conversations, with a clear information hierarchy.
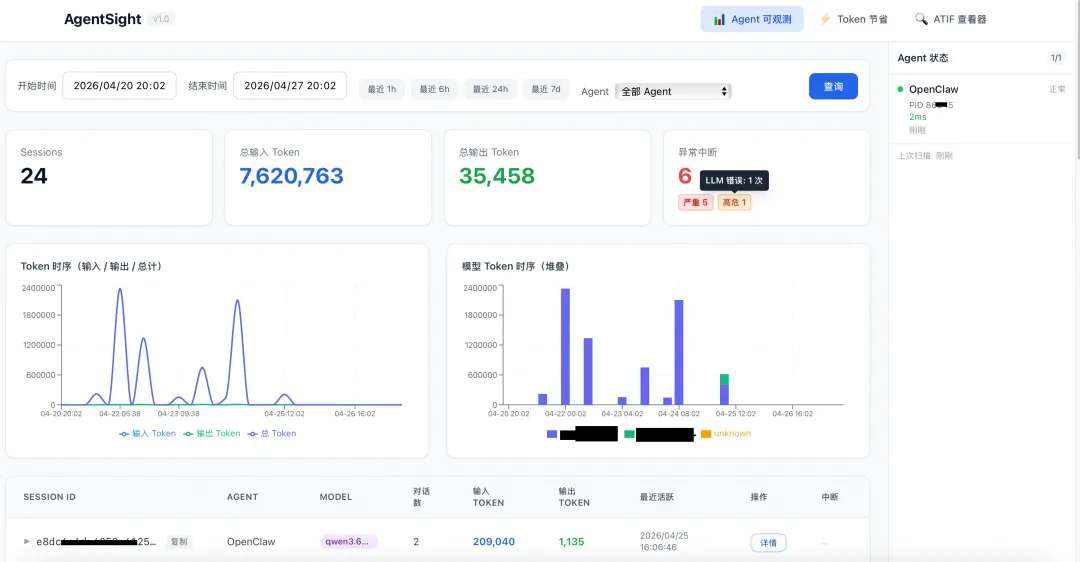
(Figure: AgentSight widget visualization panel)
When an agent goes offline or gets stuck, AgentSight doesn't just tell you "something went wrong." It automatically sends an alert and supports triggering a restart, allowing the agent to quickly recover — from failure detection to system recovery, greatly reducing manual intervention.
Every heartbeat of the agent is visible to you. If something goes wrong, you don't have to wait until the next morning to find out.
You may have heard the saying, "What cannot be measured cannot be optimized." The same is true for token consumption.
A small case — checking the weather
Let's look at a surprisingly costly little job — checking the weather.
The user asks: "Today's weather in Hangzhou." This is an extremely simple single-turn query, so the expected token consumption should be very low — user input is no more than 20 tokens, the system prompt is on the order of hundreds of tokens, and a single tool call plus response is no more than a few thousand tokens.
But what was the actual consumption? 140,000 tokens. And you cannot tell which tokens are wasted in order to avoid unnecessary spending.
Through the AgentSight visualization panel, you can observe token consumption data, as shown in the following figure. The tokens consumed vary by the model selected, but input tokens generally far exceed output tokens. As our analysis below reveals, most of the compute is wasted on repeatedly re-reading old conversation history.

(Figure: Token consumption data observed in the AgentSight visualization panel)
Through the AgentSight visualization interface, we can inspect per-event details. As shown in the following figure, when a user asks "Today's weather in Hangzhou," the Agent makes two LLM calls, and the token usage and duration of each call are clearly visible. With each additional tool call, the message history is "replayed" one more time, and the token cost grows linearly or even super-linearly. In the figure, the two tool calls fetch the weather skill and then query the actual weather through it. The number of input tokens keeps climbing as the message history is replayed again and again.
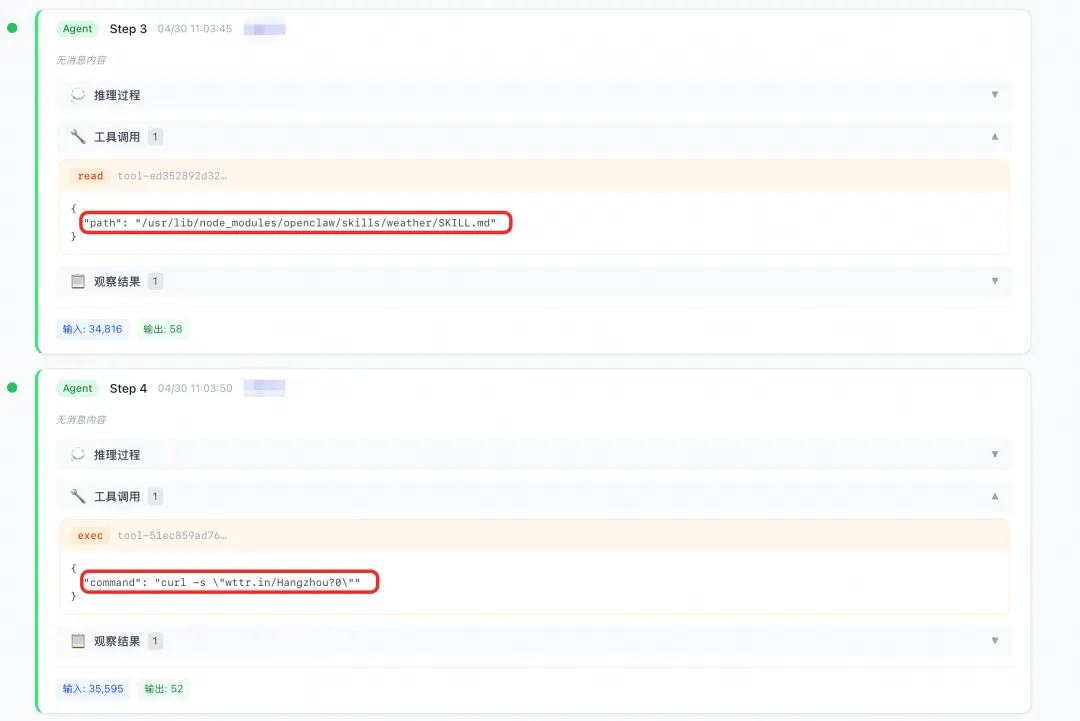
(Figure: Invocation procedure)
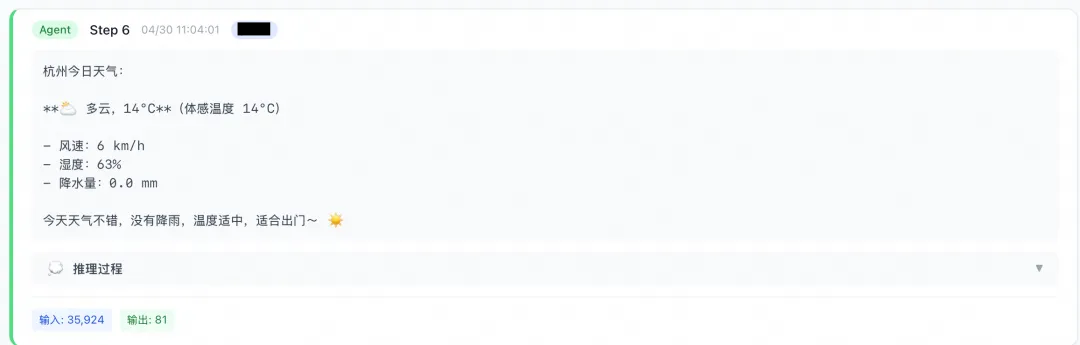
(Figure: Agent output)
The AgentSight widget breaks down token consumption for analysis across two dimensions: session level and dialog level. With this granularity, users can clearly pinpoint issues: whether an agent's overall consumption is too high, whether token usage in a single dialog is abnormal, or whether a specific skill in the details is generating waste through repeated invocations.
Session level: How many tokens each agent consumes in each session, with a single graph showing the global distribution. You can spot the most expensive agent at a glance, or discover that the token consumption of an abnormal session far exceeds the mean.
Dialog level: Drill down into a single dialog chain to track token change trends — is the system prompt dominating, is the history window bloating, or is the input of a specific skill invocation particularly verbose? Every token is accounted for.
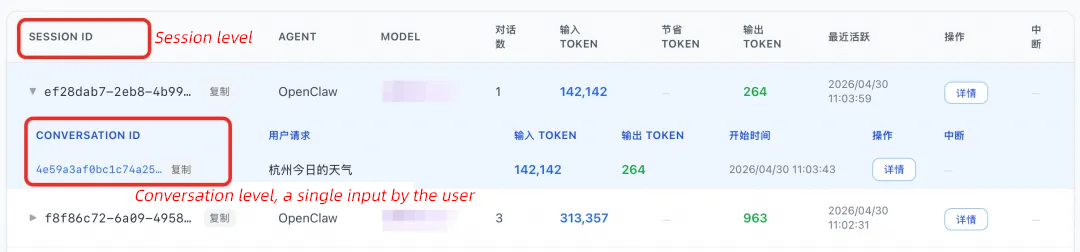
(Figure: Session level and dialog level diagram)
You can also compare trends by time segment and by agent dimension. How much was spent last week, how much this week, and which day saw abnormal fluctuations — the pattern is clear.
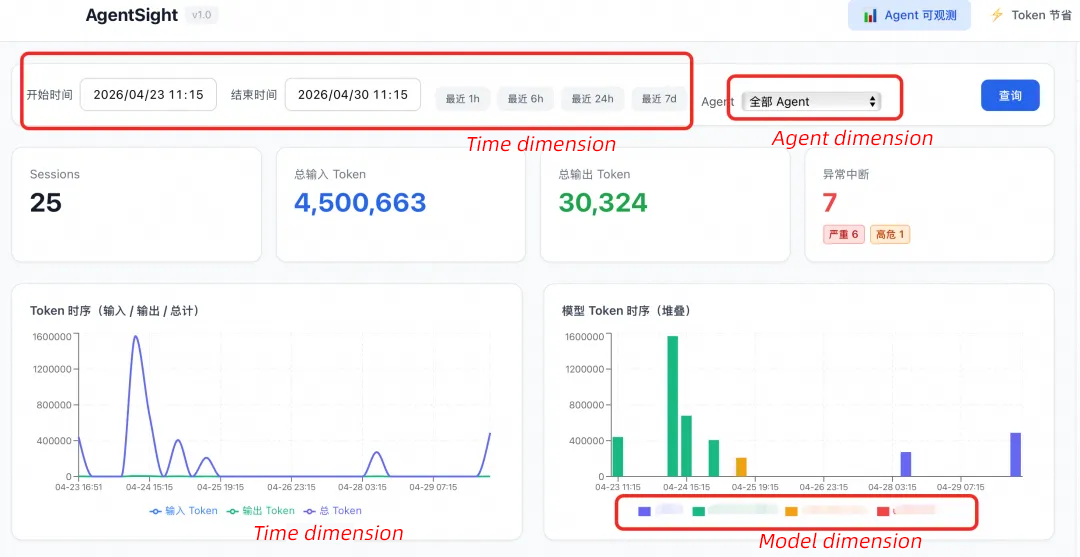
(Figure: Query instances by multiple dimensions such as time, agent, and model)
After you see "how much was spent" and "where it was spent," the next question is naturally "why was it spent here." The AgentSight widget will also add trajectory analysis — full-chain playback from task intake, through tool calls and decision branches, to final output. You can see which Skill the Agent invoked at which node, which branch it took, and which stage consumed the most context window. Once you identify the redundant paths, you can optimize the Agent's behavior design with intent, and the ineffective tokens you save translate directly into real money.
Tokens transform from a "total amount" at the end of a month into a "detailed ledger" that can be checked, traced, and optimized at any time.
The AgentSight widget can be used on Alibaba Cloud or deployed on-premises. For usage instructions, see:
Use on the cloud:
https://www.alibabacloud.com/help/en/alinux/how-to-use-agentsight
On-premises deployment:
https://github.com/alibaba/anolisa/blob/main/src/agentsight/README.md
The latest version of Agentic OS (ANOLISA) is now available on the following platforms:
• Github: https://github.com/alibaba/ANOLISA
• ECS Console (select "Alibaba Cloud Linux 4 LTS 64 bit Agentic Edition"): https://ecs-buy.alibabacloud.com/ecs
For core widget feature updates, please refer to https://www.alibabacloud.com/help/en/alinux/releasenotes
Alibaba Cloud Releases ANOLISA (Agentic OS): The First Agent-Oriented Operating System
O&M No Longer Requires 'Old Masters' - Alibaba Cloud OS Console Releases OS O&M Skills

123 posts | 6 followers
FollowOpenAnolis - October 10, 2026
OpenAnolis - July 15, 2026
OpenAnolis - July 15, 2026
OpenAnolis - June 24, 2026
OpenAnolis - September 10, 2026
Johnny Mai - October 7, 2026
123 posts | 6 followers
Follow QwenWork
QwenWork is dedicated to helping employees strengthen their professional competitiveness in the AI era and to enabling enterprises to improve organizational effectiveness.
Learn More Token Plan
Build more, spend less. One plan, every modality.
Learn More Qwen
Qwen
Full-range, open-source, multimodal, and multi-functional
Learn More AgentLoop
An Agent self-evolution platform designed to make your Agents progressively smarter and more attuned to users.
Learn MoreMore Posts by OpenAnolis

