
By Jietao Xiao
In the cloud computing environment, Kubernetes (K8s) clusters and containerized deployments have become industry-standard practices. However, they also pose significant challenges to the operations and maintenance (O&M) system and observability: On the one hand, mainstream monitoring tools (such as Node Exporter, cAdvisor, and Datadog) provide system-level and container-level basic metrics but fail to cover the deep-seated operating system (OS) issues (such as scheduling delay, memory reclaim delay, and TCP retransmission rate). In addition, the introduction of enhanced metrics faces the problems of high knowledge barriers and considerable analysis complexity of the OS. On the other hand, traditional monitoring systems often lack complete context data when alerts are triggered or problems occur, complicating root cause identification and requiring repeated issue recurrences for troubleshooting. Furthermore, metrics and issues have complex correlations: a single metric change may be caused by multiple issues, and the same issue may affect multiple metrics. Although the hierarchical architecture of clusters, nodes, and pods provides logical division for resource management, business issues and node load-bearing capacity often fail to be effectively connected due to fragmented dimensions, further exacerbating the complexity of O&M.
To address these challenges, Alibaba Cloud OS Console (hereinafter referred to as the "OS console") provides an end-to-end and one-stop O&M solution. Building on extensive accumulated cases and knowledge summaries of OS issues, and integrating technologies such as AIOps, this solution covers the entire workflow from intelligent anomaly detection and intelligent root cause analysis to intelligent repair suggestions. Extract typical OS problem scenarios such as system OOM, system memory black hole, scheduling latency, high load, I/O burst, network latency, and packet loss, and extract corresponding end-to-end solutions. As shown in Figure 1, the above business challenges are efficiently managed and solved through a full-link closed-loop process.
For specific issue scenarios, we extract relevant metrics and integrate expert-set threshold rules and intelligent anomaly detection algorithms to build a multi-dimensional anomaly detection mechanism, enabling accurate, real-time identification of potential issues.
For anomalies detected in real time, the following measures need to be taken to analyze their responses and root causes:
• On-site information collection and root cause diagnosis: Automated tools are used to collect comprehensive information about the operating environment when an exception occurs, to further locate the root cause of the problem and generate targeted solutions or repair suggestions.
• Alert notification and distribution: Abnormal events and their diagnostic results are pushed to relevant O&M teams or persons in charge through multiple channels (such as emails, text messages, and instant messaging tools), ensuring timely response and handling of the issues.
• Dynamic updates of health scores: Based on the impact scope and severity of abnormal events, the health scores of clusters, nodes, and Pods are updated in real time. This provides a quantitative basis for resource scheduling, capacity planning, and fault prediction, while supporting system status evaluation and decision optimization from an overall perspective.
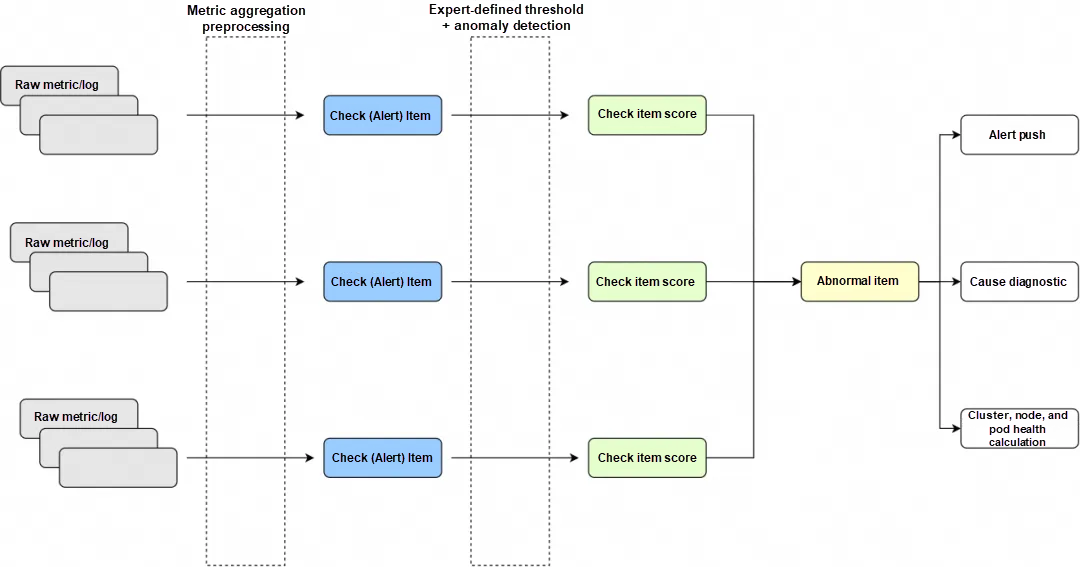
(Figure 1: Closed-loop Chain of System Overview for OS Console)
The following describes three key features of the preceding links: anomaly detection, information collection and root cause diagnosis, and health calculation for clusters, nodes, and pods.
In different scenarios, there is a wide variety of OS-related monitoring metrics, each exhibiting distinct patterns. Thus, effectively and accurately identifying anomalies in these monitoring metrics poses a challenge.
To adapt to metric anomaly detection across as many scenarios as possible, the OS console employs a universal monitoring metric processing algorithm and a multi-model integrated universal anomaly detection algorithm, as shown in Figure 2.
• A variety of different types of monitoring indicators are classified after input, such as those that are stable overall, those with certain trends, and those with irregular fluctuations.
• The classified indicators are detected by an unsupervised multi-model combined anomaly detection algorithm. By combining expert-defined thresholds and multi-model joint judgment, the detection accuracy is effectively improved. Meanwhile, optimizations are made based on the characteristics of system metrics, and preprocessing is performed before processing the monitoring metrics to further enhance efficiency.
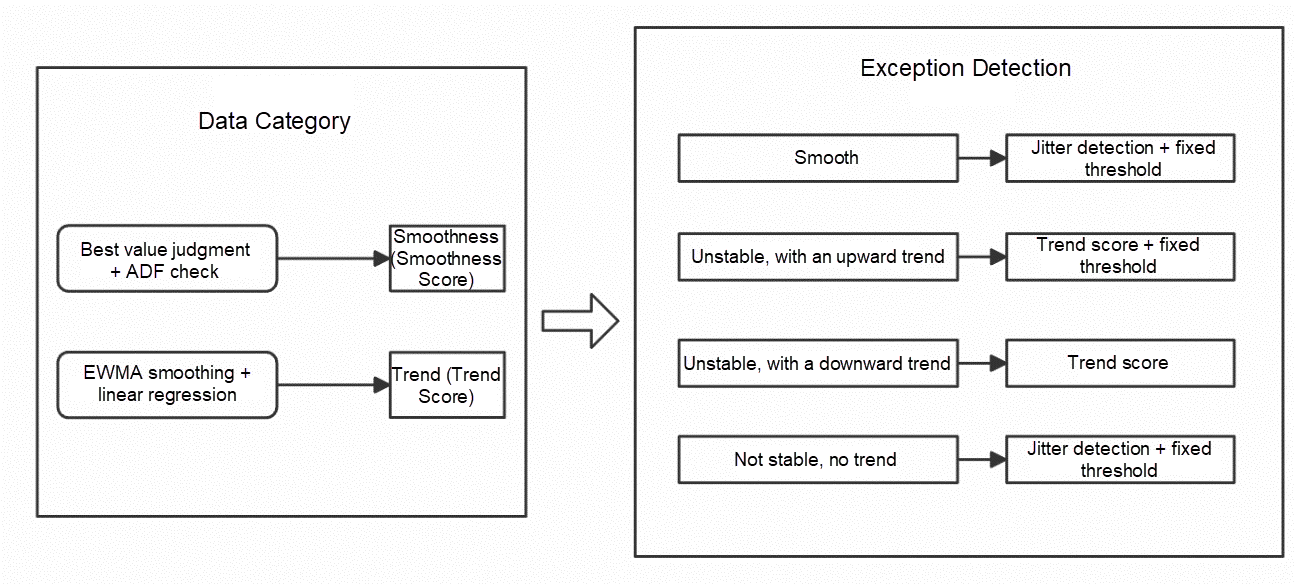
(Figure 2: General Anomaly Detection Module)
The following examples illustrate the expected effect of anomaly detection by using some typical metrics:
• High-watermark metrics for stability: Metrics such as CPU utilization and memory utilization may remain at a very high watermark. Although they have a certain impact on system health, they are within expectations. By detecting the watermark threshold and its stability, they will eventually be identified as potential anomalies.
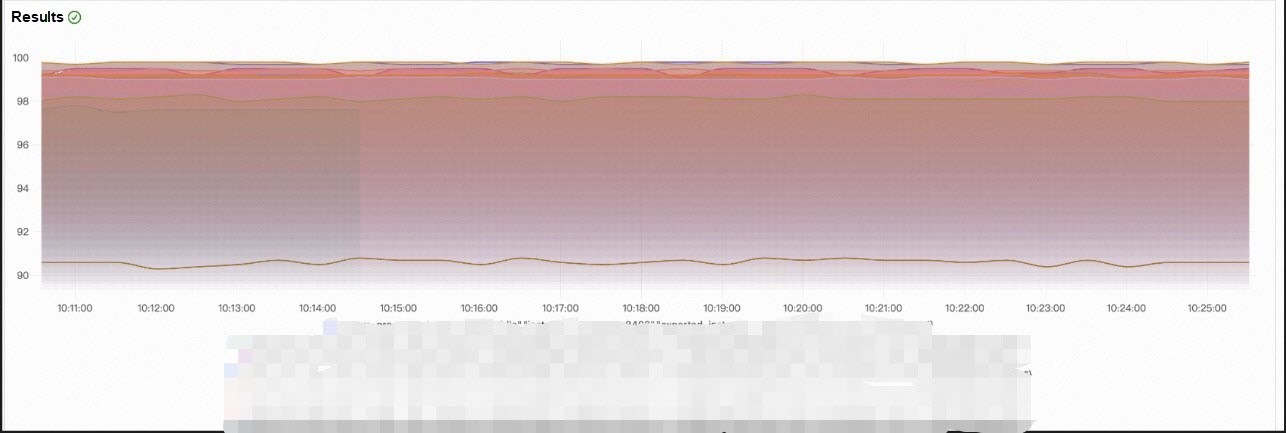
(Figure 3: High-watermark Metrics for Stability)
• Spike and fluctuation-type metrics: For spike and fluctuation-type metrics, we combine expert-defined thresholds with jitter detection algorithms. Based on the magnitude of metric fluctuations and their specific deviations from the set minimum and maximum thresholds, we comprehensively assess the anomaly degree of the current metrics.
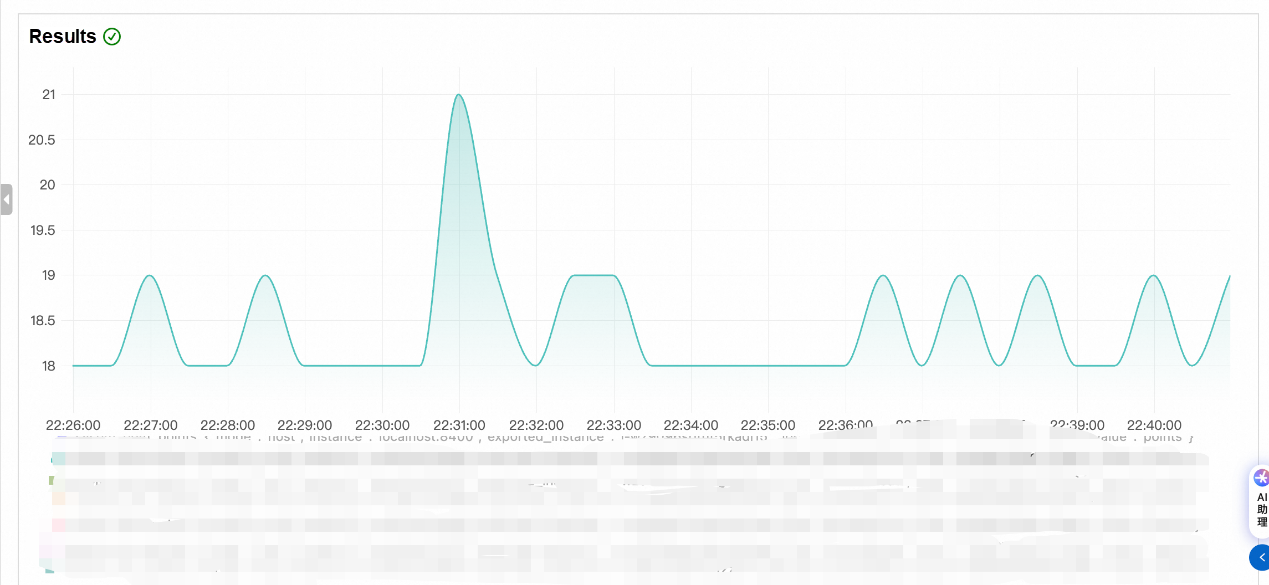
(Figure 4: Fluctuation-type Metrics)
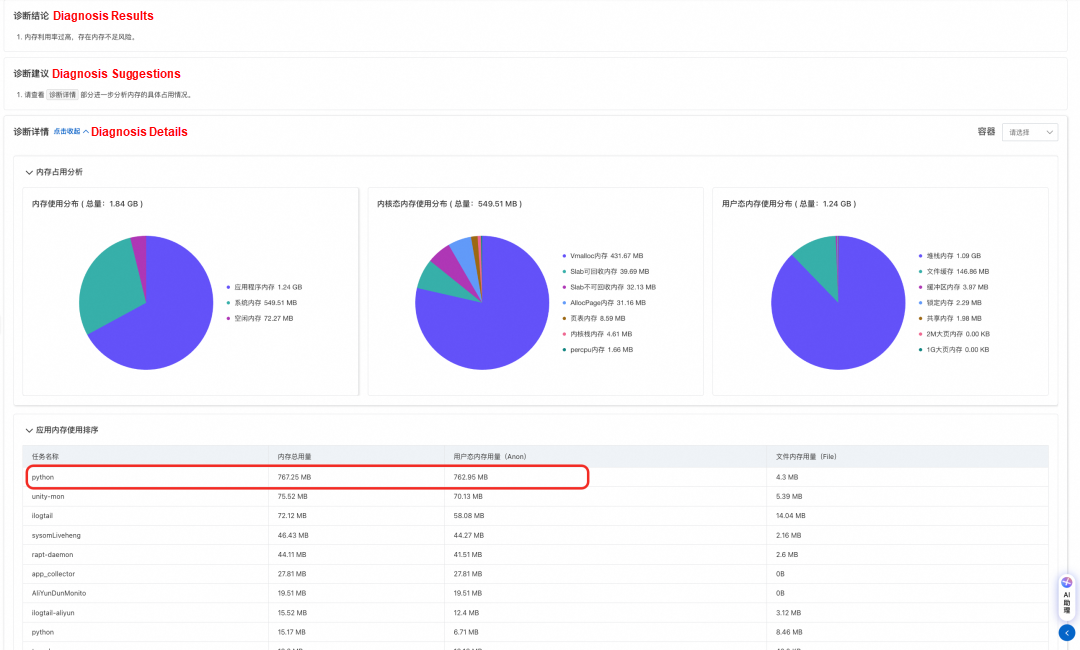
To avoid difficulties in subsequent problem localization due to the loss of the anomaly scene, the OS console, while capturing anomalies, will perform information collection and root cause diagnosis on the identified anomalies at the anomaly scene based on corresponding policies combined with its provided diagnostic functions. As shown in the following figure: When a high memory anomaly is captured, the console diagnoses the anomaly scene and ultimately determines that the current high memory anomaly is caused by the memory usage of the Python application.

In order to facilitate users in quickly identifying the risks in clusters or nodes, the OS console provides a general view of the overall cluster health on the system overview page. Behind this, we employ a multi-dimensional comprehensive evaluation algorithm, hoping to progressively map the risks of pods and nodes to the health risks of the cluster, as shown in Figure 5. Taking node health as an example:
Node health is comprehensively influenced by the node's anomalies (referred to as "current instance health score" in the figure) and the health of pods within the node (if any, referred to as "next-level instance health score" in the figure). Among them:
• The current instance health score is calculated through a comprehensive evaluation method by assigning corresponding weights to each inspection item.
• The next-level instance health score is calculated based on the number of pods at different health levels by using the hierarchical bucket principle.
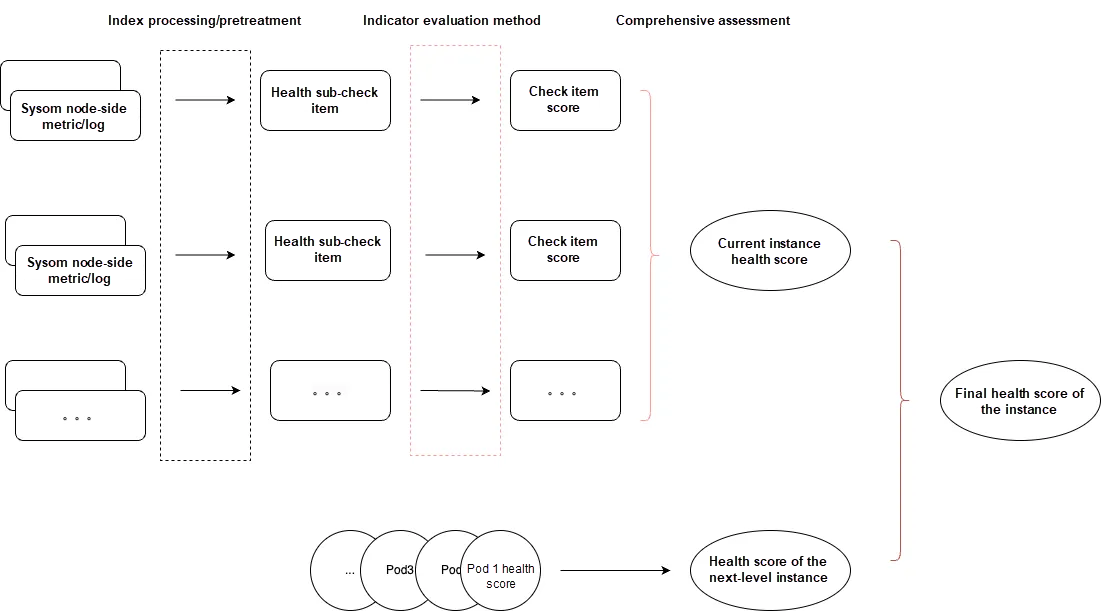
(Figure 5: Comprehensive Assessment of Instance Health)
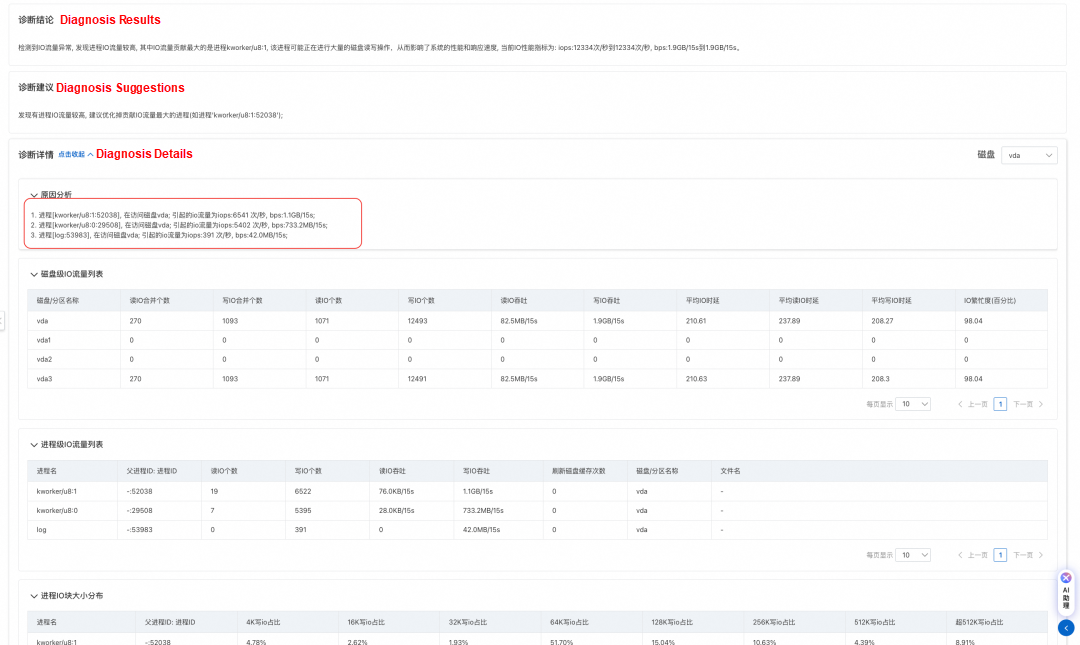
A customer in the automotive industry noticed through monitoring that nodes in the cluster occasionally experience unexpectedly high I/O traffic. Due to the low occurrence rate and the randomness of the affected nodes, there is no effective way to identify the specific cause of the high I/O traffic.
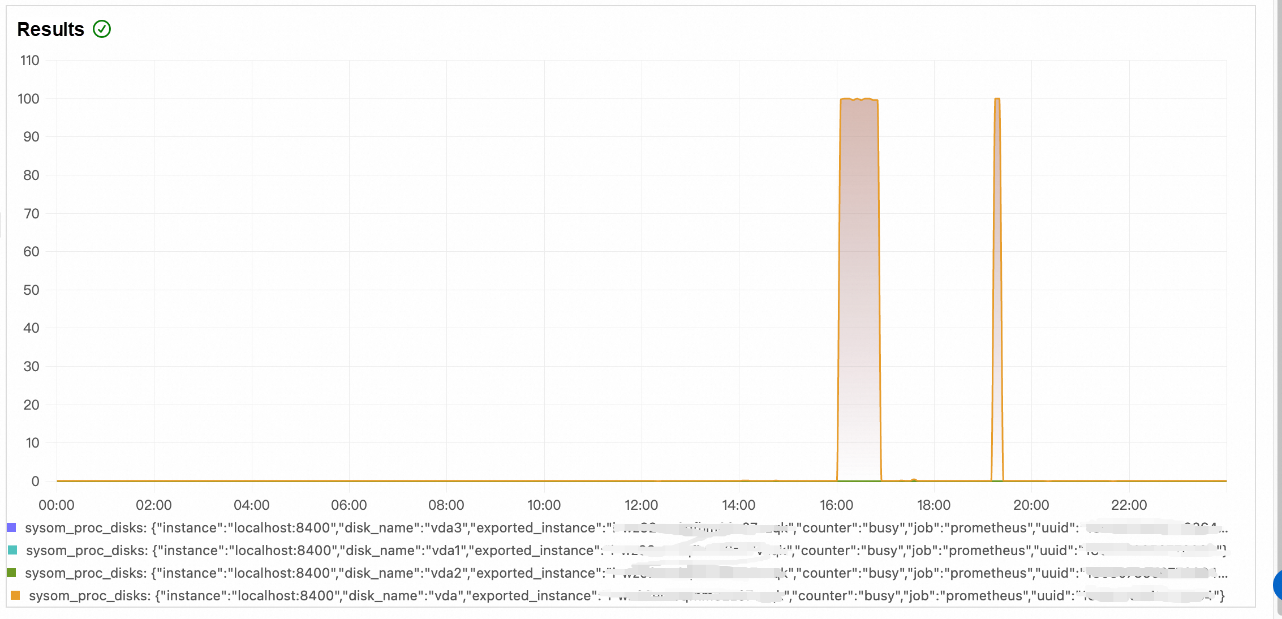
For the preceding scenarios, customers monitor and locate the problem by using the anomaly identification and diagnosis capabilities provided by System Overview.
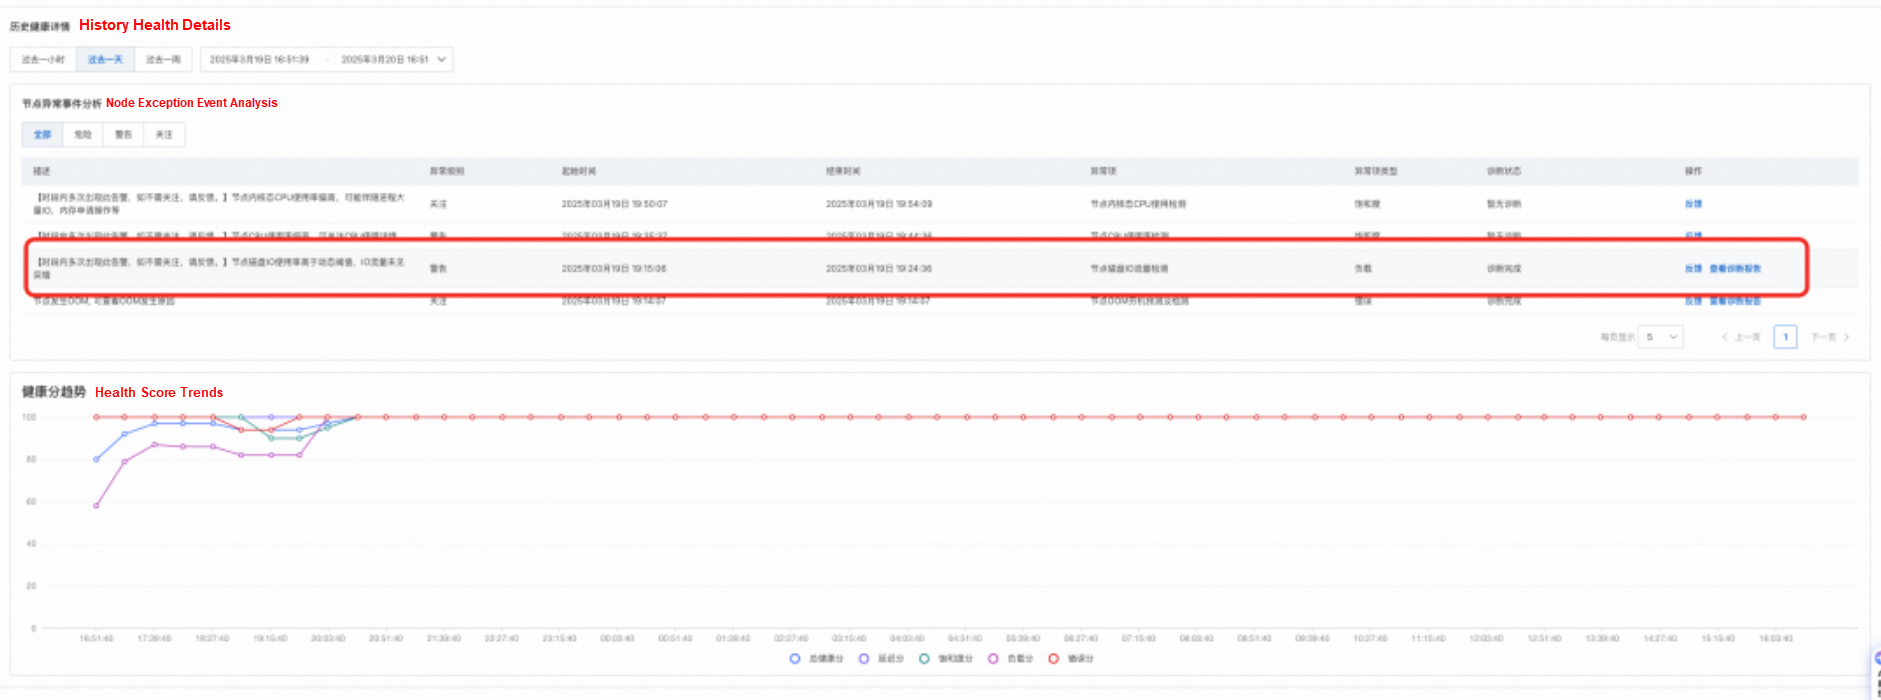
• After activating the OS console, the customer first noticed a drop in the cluster score (load score) at a specific time based on the cluster's historical health score trend.

• The node health list allows for further viewing of low-score instances:

• After navigating to the node health page, the anomaly event analysis panel shows that the node experienced an unexpected surge in I/O traffic at a specific time that day, with a corresponding diagnostic report generated.
• By viewing the diagnostic report, as shown in the following figure, it can be found that the main causes of I/O traffic are kworker kernel threads and the log dump process of the customer. The high I/O of kworker threads usually means that kworker is performing dirty page flushing (writing dirty pages of files to the disk). A comparison with normal machines revealed that the vm.dirty_background_ratio of the problematic machine was set extremely low, at 5%. This means that when the number of dirty pages reaches 5% of the system memory, the kernel thread is triggered to write back the dirty pages, resulting in high I/O traffic.
• After the customer increased the values of vm.dirty_background_ratio and dirty_ratio, the I/O traffic returned to normal patterns.
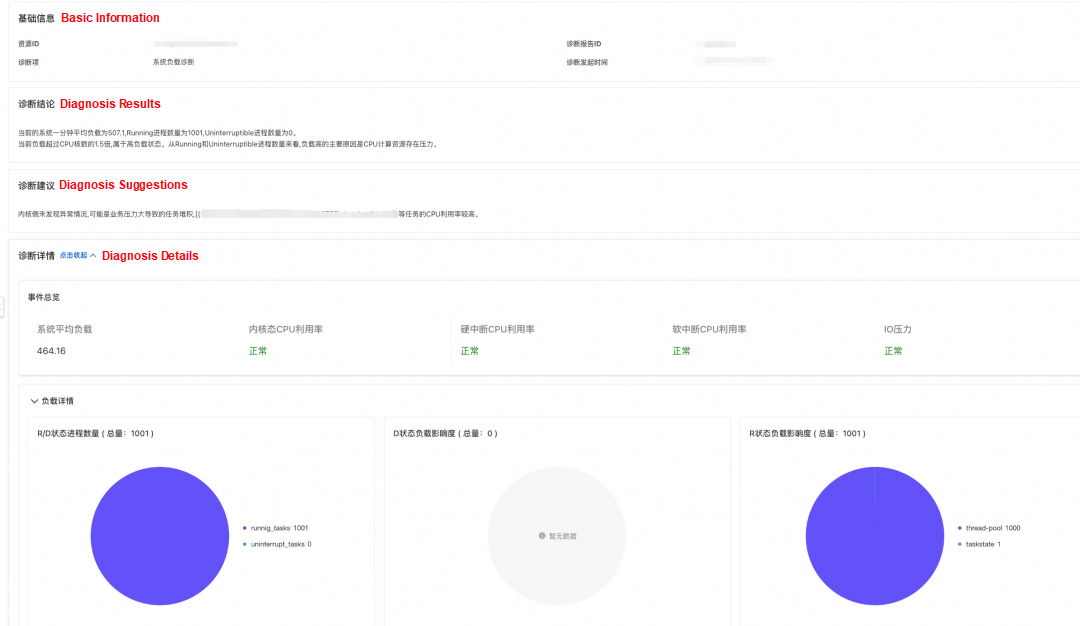
A customer in the automotive industry found that after migrating their business from node-based deployment to container deployment, the node load regularly spikes and requires further investigation to identify the root cause.
To address this issue, after the customer managed the cluster through the OS console, they observed from the system overview page that the health score of the corresponding cluster/node had dropped, with high load anomalies appearing in the anomaly events.

Further review of the diagnostic report reveals that the increased load was caused by a large number of processes in the R state. After verification, the customer confirmed that during the time when the load increased, there was a surge in business traffic, and the business would create a large number of threads for processing. Combined with the continuous Pod throttling anomalies in the Pod at the same time, it can be determined that the CPU limit setting of the container was too small, which prevented the threads from completing the relevant logic in a short time. This further caused the threads to accumulate in the run queue in the R state, resulting in a sharp increase in load.

After the problem was located, the customer adjusted the CPU limit of the business container, and the load returned to normal.
Using the console to quickly locate cluster system issues, customers can achieve the following benefits:
• The OS console lowers the threshold for OS operation and maintenance: The OS console provides customers with anomaly check items, anomaly identification rules, and supporting diagnostic tools. Customers can resolve OS issues in a one-stop manner without needing a certain level of OS knowledge.
• Simplifying O&M processes and reducing related manpower input: Through the console system overview, customers can quickly identify alerts and risks in clusters, locate the root causes and solutions of problems, and shorten the time for fault discovery and troubleshooting.
In short, the OS console brings new possibilities for cloud computing and containerized O&M. It enhances system performance and O&M efficiency while reducing the troubles caused by system-related issues for enterprises.
Through a series of articles on Alibaba Cloud OS Console, we analyze the pain points encountered in system operation and maintenance. In the next article, we will share the content related to anomaly detection algorithms. Please look forward to it.
Alibaba Cloud OS Console link: https://alinux.console.aliyun.com/
Even Beginners Can Handle OS O&M: Alibaba Cloud OS Console Simplifies Three Key O&M Issues

102 posts | 6 followers
FollowOpenAnolis - September 4, 2025
OpenAnolis - March 4, 2026
OpenAnolis - June 25, 2025
OpenAnolis - March 5, 2026
OpenAnolis - February 2, 2026
OpenAnolis - January 21, 2025

102 posts | 6 followers
Follow Alibaba Cloud Linux
Alibaba Cloud Linux is a free-to-use, native operating system that provides a stable, reliable, and high-performance environment for your applications.
Learn More Container Service for Kubernetes
Alibaba Cloud Container Service for Kubernetes is a fully managed cloud container management service that supports native Kubernetes and integrates with other Alibaba Cloud products.
Learn More Apsara Stack
Apsara Stack is a full-stack cloud solution created by Alibaba Cloud for medium- and large-size enterprise-class customers.
Learn More ACK One
Provides a control plane to allow users to manage Kubernetes clusters that run based on different infrastructure resources
Learn MoreMore Posts by OpenAnolis