By Bining Liang (Apache Dubbo Contributor), Youwei Chen (Apache Dubbo PMC)
Dubbo3 Triple protocol is designed based on the features of gRPC, gRPC-Web, and Dubbo2. With all features of the protocols above, Triple is fully compatible with gRPC and Streaming communication, supporting HTTP/1 and browsers seamlessly.
When you use the Triple protocol in the Dubbo framework, you can directly use the Dubbo client, gRPC clients, curl, and browsers to access your published services without any additional components and configurations.
In addition to user-friendliness, Dubbo3 Triple has done a lot of work on performance tuning. This article will focus on the high-performance secrets behind the Triple protocol, including some valuable performance tuning tools, techniques, and code implementations.
Since 2021, Dubbo3 has been used as the next-generation service framework to replace HSF, which is widely used in Alibaba. As a key framework supporting Alibaba's Double 11 service invocation over the past two years, the performance of the Triple communication protocol directly affects the operating efficiency of the entire system.
The Triple protocol is designed with reference to gRPC and gRPC-Web. It absorbs the characteristics and advantages of the two protocols and integrates them into a protocol that is fully compatible with gRPC. The Triple protocol supports Streaming communication and HTTP/1 and HTTP/2.
The design goals of the Triple protocol are listed below:
When you use Triple in the Dubbo framework, you can directly use Dubbo clients, gRPC clients, curl, and browsers to access your published services.
The following example shows how to use a curl client to access a Triple protocol service on a Dubbo server:
curl \
  --header "Content-Type: application/json"\
  --data '{"sentence": "Hello Dubbo."}'\
https://host:port/org.apache.dubbo.sample.GreetService/sayHello
In terms of implementation, Dubbo Triple supports Protobuf Buffer but is not bound to it. For example, Dubbo Java supports defining Triple services with Java Interface, which makes it easier for developers concerned about the usability of specific languages to get started. Currently, Dubbo provides language implementations (such as Java, Go, and Rust) and is promoting protocol implementation in languages (such as Node.js). We plan to open up mobiles, browsers, and backend microservice systems through multi-language protocols and Triple protocols.
The core components in Triple implementation are listed below:
TripleInvoker is one of the core components and is used to request the server of the Triple protocol. The core method is doInvoke, which initiates different types of requests based on the request type (such as UNARY and BiStream). For example, UNARY synchronously blocks invoking under SYNC, and one request corresponds to one response. BiStream is a bidirectional communication. The client can continuously send requests, and the server can also continuously push messages. They interact with each other by calling back to the StreamObserver component.
TripleClientStream is one of the core components that correspond to the stream concept in HTTP/2. Each time a new request is initiated, a new TripleClientStream is created. Similarly, the corresponding stream in HTTP/2 is also different. The core methods provided by TripleClientStream include sendHeader used to send header frames and sendMessage used to send data frames.
WriteQueue is the buffer queue used to write messages in Triple protocol. Its core logic is to add various QueueCommands to the queue maintained internally and try to submit the tasks corresponding to these QueueCommands to Netty's EventLoop thread for single-threaded and orderly execution.
QueueCommand is an abstract class for tasks submitted to WriteQueue. Different commands correspond to different execution logics.
TripleServerStream is the stream abstraction of the server in the Triple protocol. This component corresponds to the stream concept in HTTP/2. Each time the client initiates a request through a new stream, the server creates a corresponding TripleServerStream to process the request information sent by the client.
HTTP/2 is a new generation of HTTP protocol and a substitute for HTTP/1.1. The biggest improvement of HTTP/2 over HTTP/1.1 is that it reduces resource consumption and improves performance. In HTTP/1.1, the browser can only send one request over a TCP connection. If the browser needs to load multiple resources, the browser needs to establish multiple TCP connections. This approach can cause problems, such as increased network latency when TCP connections are established and disconnected and network congestion when the browser sends multiple requests at the same time.
In contrast, HTTP/2 allows a browser to send multiple requests simultaneously in one TCP connection. Multiple requests correspond to multiple streams. The multiple streams are independent of each other and are forwarded in a parallel manner. In each stream, these requests are split into multiple frames, which flow in a serial manner in the same stream, strictly ensuring the order of the frames. Therefore, the client can send multiple requests in parallel, and the server can send multiple responses in parallel, which helps reduce the number of network connections and network latency and improve performance.
HTTP/2 supports server push, which means the server can preload resources before the browser requests them. For example, if the server knows the browser is going to request a particular resource, the server can push the resource to the browser before the browser requests it. This helps improve performance because the browser does not need to wait for responses from resources.
HTTP/2 supports header compression, which means duplicate information in HTTP headers can be compressed. This helps reduce network bandwidth usage.
Netty is a high-performance, asynchronous, and event-driven networking framework for rapidly developing maintainable and high-performance protocol servers and clients. Its main features are user-friendliness, strong flexibility, high performance, and good scalability. Netty uses NIO as a foundation to easily implement asynchronous, non-blocking network programming, and it supports multiple protocols (such as TCP, UDP, HTTP, SMTP, WebSocket, and SSL). Netty's core components include Channel, EventLoop, ChannelHandler, and ChannelPipeline.
Channel is bidirectional. It can be used to transmit data and handle network I/O operations. Netty Channel implements the Channel interface of Java NIO and adds some features to it, such as supporting asynchronous shutdown, binding multiple local addresses, and binding multiple event handlers.
EventLoop is one of the core components of Netty, which is responsible for handling all I/O events and tasks. An EventLoop can manage multiple Channels, and each Channel has a corresponding EventLoop. EventLoop uses a single-threaded model to process events, avoiding contention between threads and the use of locks, improving performance.
ChannelHandler is a processor connected to the ChannelPipeline.It can process inbound and outbound data, such as encoding, decoding, encrypting, and decrypting. A Channel can have multiple ChannelHandlers, and ChannelPipeline invokes them in the order they are added to process data.
ChannelPipeline is another core component of Netty. It is a set of sequentially connected ChannelHandlers for processing inbound and outbound data. Each Channel has its own exclusive ChannelPipeline. When data enters or leaves a Channel, it passes through all the ChannelHandlers to complete the processing logic.
In order to tune the code, we need to use some tools to find the location of the performance bottleneck of the Triple protocol, such as blocking and hot spot methods. The tools used in this tuning include Visual VM and JFR.
Visual VM is a graphical tool that can watch the performance and memory usage of local and remote Java virtual machines (JVM). It is an open-source project that can identify and solve performance problems in Java applications.
Visual VM can display the running status of JVM, including CPU usage, number of threads, memory usage, and garbage collection. It can also display CPU usage and stack trace for each thread to identify bottlenecks.
Visual VM can analyze heap dump files to identify memory leaks and other memory usage problems. You can use it to view the size, references, and types of objects and the relationships between objects.
Visual VM can monitor the performance of your application at runtime, including the number of method invoking, time consumption, and exceptions. It can also generate snapshots of CPU usage and memory usage for further analysis and optimization.
Java Flight Recorder (JFR) is a performance analysis tool provided by JDK. JFR is a lightweight, low-overhead event recorder that can record a variety of events, including thread lifecycle, garbage collection, class loading, and lock contention. JFR data can be used to analyze application performance bottlenecks and identify problems, such as memory leaks. Compared with other performance analysis tools, JFR is characterized by its very low overhead and its capability to keep recording without affecting the performance of the application.
JFR is easy to use. You only need to add the startup parameter: -XX:+UnlockCommercialFeatures -XX:+FlightRecorder when starting the JVM to enable the recording function of JFR. When the JVM is running, JFR automatically records various events and saves them to a file. After recording, we can use the JDK Mission Control tool to analyze the data. For example, we can look at CPU usage, memory usage, number of threads, and lock contention. JFR provides advanced features (such as event filtering, custom events, and event stack traces).
In this performance tuning, we focus on the events that can significantly affect performance in Java: Monitor Blocked, Monitor Wait, Thread Park, and Thread Sleep.
One of the key points of high performance is that coding must be non-blocking. If sleep, await, and other similar methods are invoked in the code, threads will be blocked, and the performance of the program will be directly affected. Therefore, blocking API should be avoided as much as possible in the code, and non-blocking API should be used instead.
Being asynchronous is one of the key points in tuning ideas. We can use asynchronous programming in the code, such as using CompletableFuture in Java 8. The advantage is you can avoid the blocking of threads, improving the performance of the program.
The divide-and-conquer concept is a very important idea in the process of tuning. For example, a large task can be broken down into several small tasks, and you can process these tasks in a multi-threaded parallel manner. The advantage is the parallelism of the program can be improved to make full use of the performance of the multi-core CPU and achieve the purpose of optimizing performance.
Batching is a very important idea in the process of tuning. For example, combine multiple small requests into a large request and then send it to the server at one time. This reduces the number of network requests, reducing network latency and improving performance. In addition, when processing a large amount of data, batch processing can be used. For example, a batch of data is read into the memory at one time and then processed, so the number of I/O operations can be reduced, improving the performance of the program.
After examining the code directly, we found a method syncUninterruptibly that would block the current thread. The use of DEBUG can help us understand that the code will be carried out in the user thread, where the source code is shown below:
private WriteQueue createWriteQueue(Channel parent) {
  final Http2StreamChannelBootstrap bootstrap = new Http2StreamChannelBootstrap(parent);
  final Future<Http2StreamChannel> future = bootstrap.open().syncUninterruptibly();
  if (!future.isSuccess()) {
    throw new IllegalStateException("Create remote stream failed. channel:" + parent);
  }
  final Http2StreamChannel channel = future.getNow();
  channel.pipeline()
    .addLast(new TripleCommandOutBoundHandler())
    .addLast(new TripleHttp2ClientResponseHandler(createTransportListener()));
  channel.closeFuture()
    .addListener(f -> transportException(f.cause()));
  return new WriteQueue(channel);
}
The code logic here is listed below:
In Basic Knowledge, we mentioned that most of the tasks in Netty are executed in a single-threaded manner in the EventLoop thread. Similarly, when the user thread invokes the open() method, the task of creating HTTP2 Stream Channel will be submitted to EventLoop, and the user thread will be blocked until the task is completed when the syncUninterruptibly() method is invoked.
However, the submitted task is only submitted to a task queue and not immediately executed because EventLoop may still be executing Socket read/write tasks or other tasks. In this case, other tasks may occupy a lot of time after task submission, causing the task of creating Http2StreamChannel to be delayed and the time for blocking the user thread to be increased.
From the analysis of the overall process of a request, the user thread is blocked before the Stream Channel is created. After the request is initiated, the system needs to wait for a response during blocking. Two obvious blocking behaviors occur in one UNARY request, which will significantly restrict the performance of the Triple protocol. Then, we can boldly assume blocking here is unnecessary. In order to confirm our inference, we can use Visual VM to sample it and analyze the duration of blocking the creation of a Stream Channel in hotspots. Here are the sampling results of the Triple consumer side:
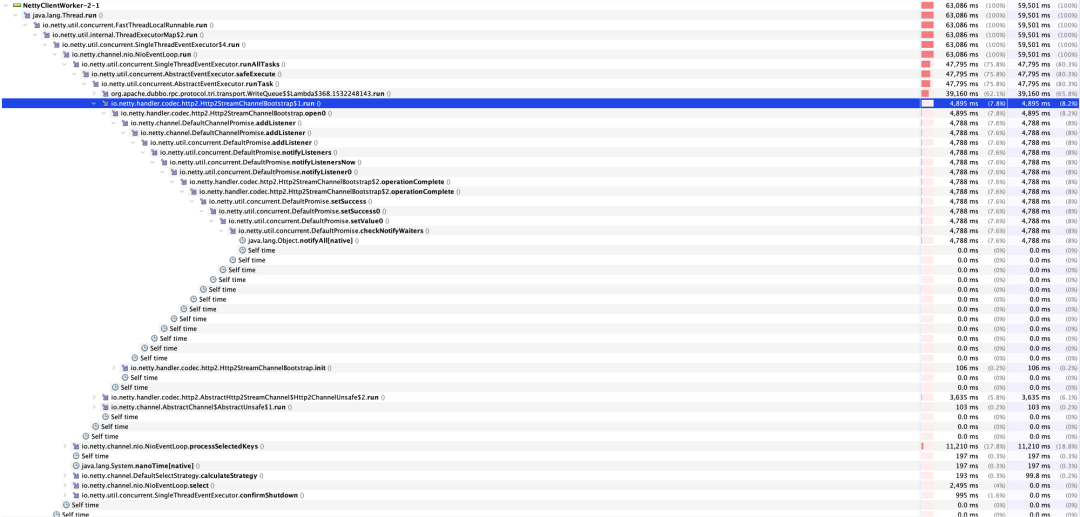
From the figure above, we can see the method of creating a StreamChannel with HttpStreamChannelBootstrap$1.run accounts for a large proportion of the time spent on the entire EventLoop. We can see the time spent is on notifyAll, waking up the user thread.
So far, we have learned that one of the performance impediments is the creation of the StreamChannel, so the optimization solution is to asynchronize the creation of the StreamChannel to eliminate the invoking of the syncUninterruptibly() method. The following code shows the modified code. The task of creating a StreamChannel is abstracted into CreateStreamQueueCommand and submitted to WriteQueue. The sendHeader and sendMessage that initiate subsequent requests are also submitted to WriteQueue. This ensures the request is only sent after the Stream is created.
private TripleStreamChannelFuture initHttp2StreamChannel(Channel parent) {
    TripleStreamChannelFuture streamChannelFuture = new TripleStreamChannelFuture(parent);
    Http2StreamChannelBootstrap bootstrap = new Http2StreamChannelBootstrap(parent);
    bootstrap.handler(new ChannelInboundHandlerAdapter() {
            @Override
            public void handlerAdded(ChannelHandlerContext ctx) throws Exception {
                Channel channel = ctx.channel();
                channel.pipeline().addLast(new TripleCommandOutBoundHandler());
                channel.pipeline().addLast(new TripleHttp2ClientResponseHandler(createTransportListener()));
                channel.closeFuture().addListener(f -> transportException(f.cause()));
            }
        });
    CreateStreamQueueCommand cmd = CreateStreamQueueCommand.create(bootstrap, streamChannelFuture);
    this.writeQueue.enqueue(cmd);
    return streamChannelFuture;
}
The core logic of CreateStreamQueueCommand is listed below, which eliminates unreasonable blocking methods invoking by ensuring they are executed in EventLoop.
public class CreateStreamQueueCommand extends QueuedCommand {
    ......
    @Override
    public void run(Channel channel) {
        //The logic here can be guaranteed to be executed under EventLoop, so we can directly obtain the result after invoking the open() method without blocking.
        Future<Http2StreamChannel> future = bootstrap.open();
        if (future.isSuccess()) {
            streamChannelFuture.complete(future.getNow());
        } else {
            streamChannelFuture.completeExceptionally(future.cause());
        }
    }
}
}At this time, a simple look at the source code can no longer find obvious performance bottlenecks. Next, we need to use Visual VM to find performance bottlenecks.
After opening the tool, we can select the process to be collected. Here, we collect the process of Triple Consumer, select Sampler in the tab, and click CPU to start sampling the time-consuming hotspot method of CPU. The following is the result of our sampling of CPU hotspot methods. We unfold the call stack of the most time-consuming EventLoop thread.
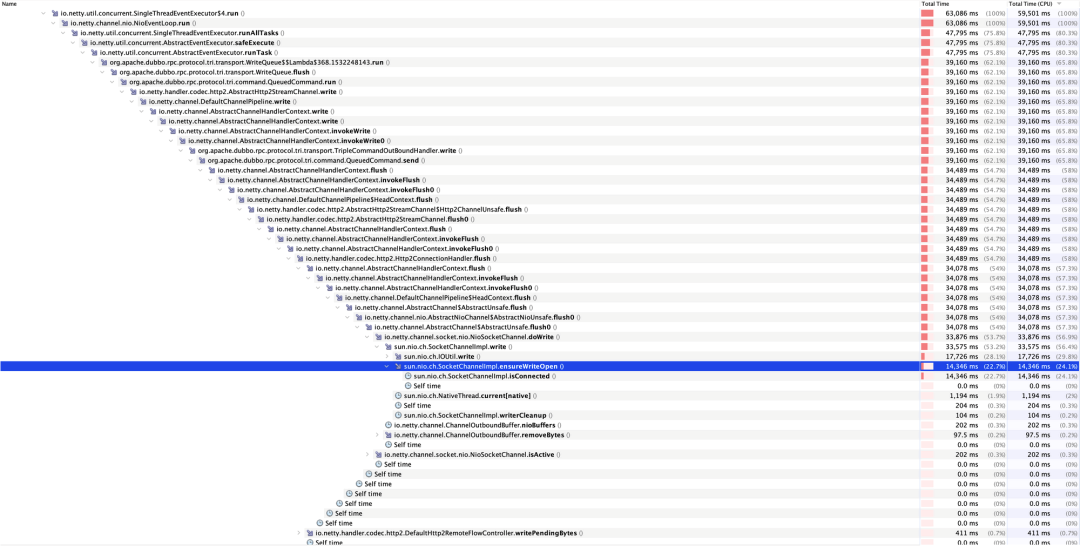
After layers of analysis, we can find a very unreasonable time-consuming method from the figure—ensureWriteOpen. This method looks like a method to determine whether the socket is writable, but why does it consume such a large percentage of the time? We opened the isConnected() method of sun.nio.ch.SocketChannelImpl in JDK8 with these questions. The code is listed below:
public boolean isConnected() {
  synchronized (stateLock) {
    return (state == ST_CONNECTED);
  }
}
We can see there is no logic in this method, but there is a keyword: synchronized. We can conclude there is a lot of synchronization lock contention in the EventLoop thread! Then, our next step is to find a method to compete for the lock at the same time. We directly find the method through a DEBUG conditional breakpoint. As shown in the following figure, we put a conditional breakpoint in the isConnected() method. The condition for entering the breakpoint is that the current thread is not an EventLoop thread.
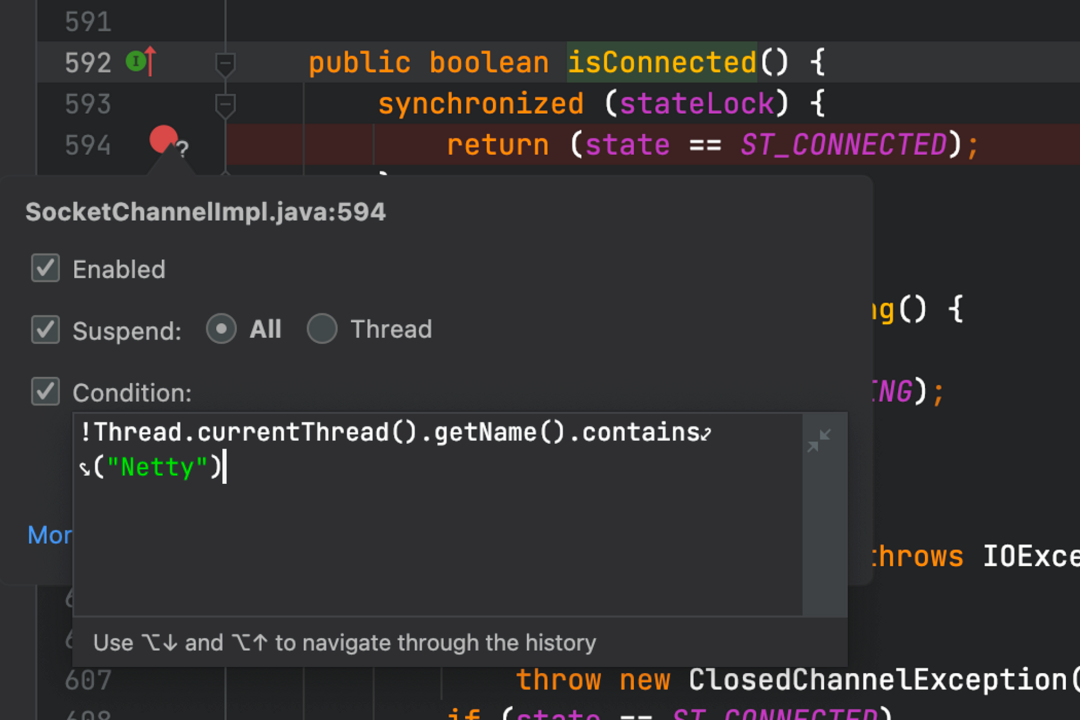
After the breakpoint is set, we start and initiate the request. We can clearly see that the TripleInvoker.isAvailable method call appears in our method call stack, and the isConnected() method of sun.nio.ch.SocketChannelImpl will be eventually called, causing the time consumption of lock contention on the EventLoop thread.
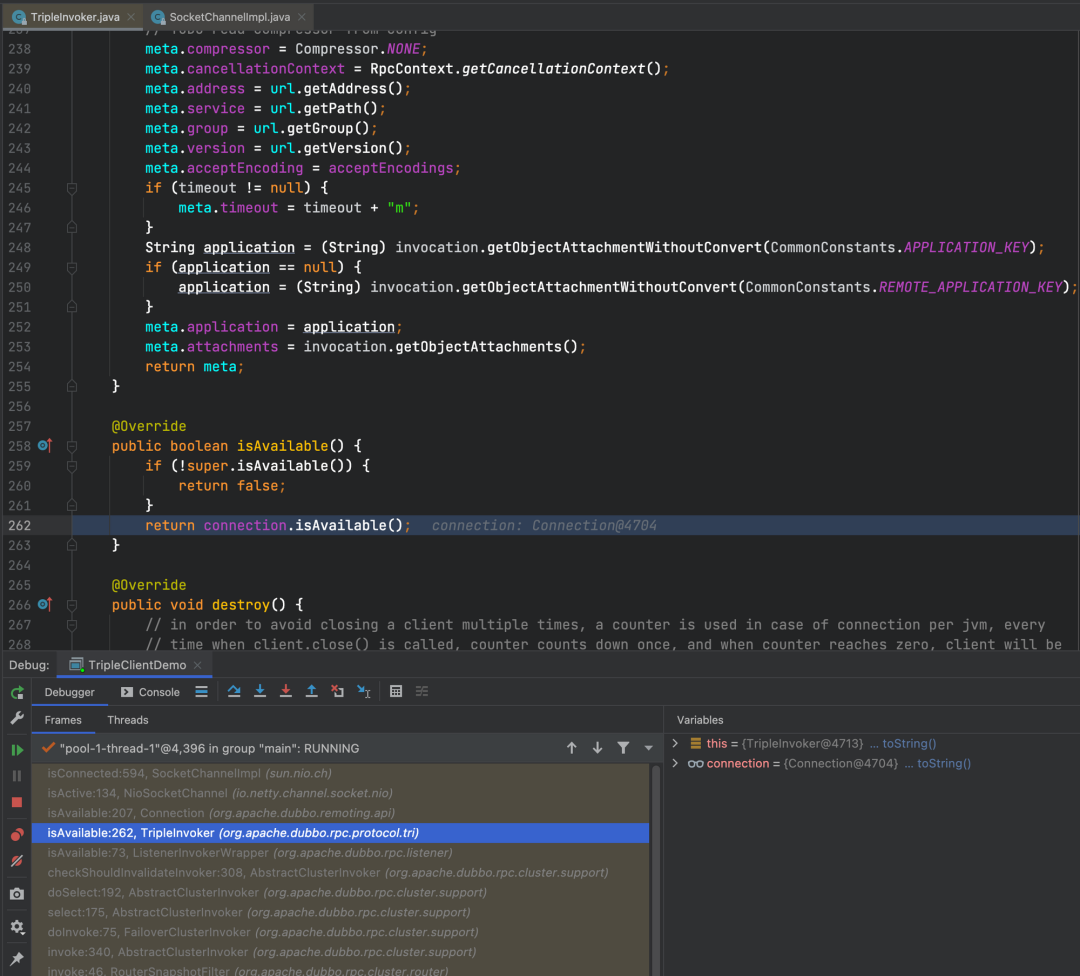
Through the analysis above, our next modification idea is very clear. It needs to modify the judgment logic of isAvailable and maintain a boolean value to indicate whether it can be used to eliminate lock contention and improve the performance of the Triple protocol.
Let's continue to observe the snapshot of Visual VM sampling to see the overall thread duration, as shown in the following figure:
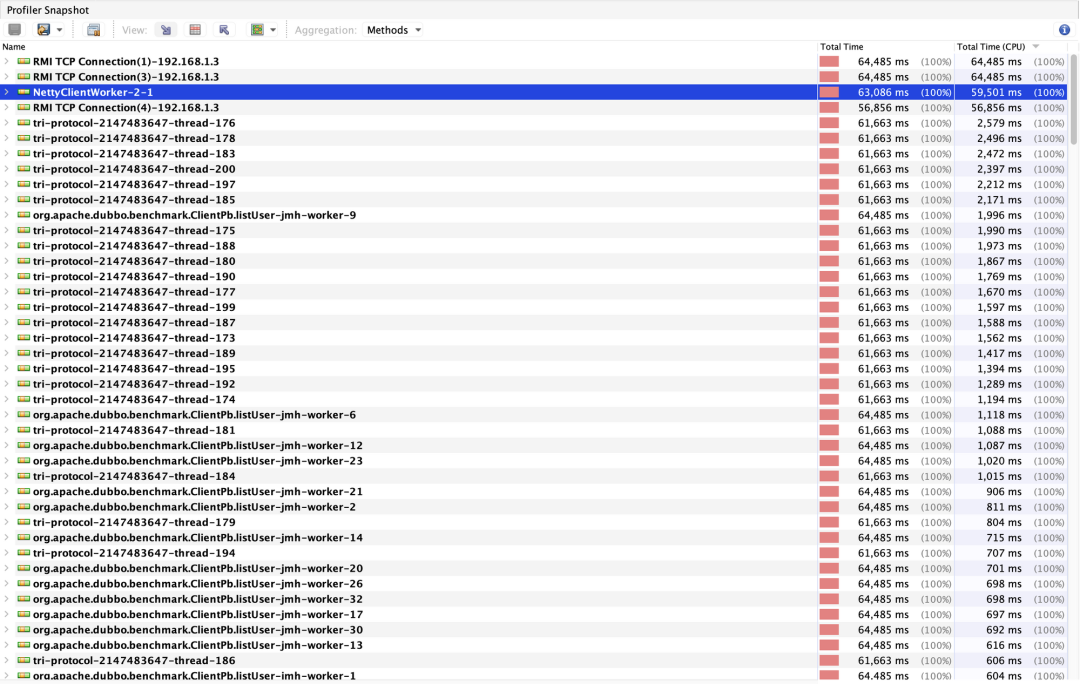
From the graph, we can extract the following information:
We can see that the consumer thread is mainly used for deserialization and delivery of deserialization results (DeadlineFuture.received), as shown in the following figure:
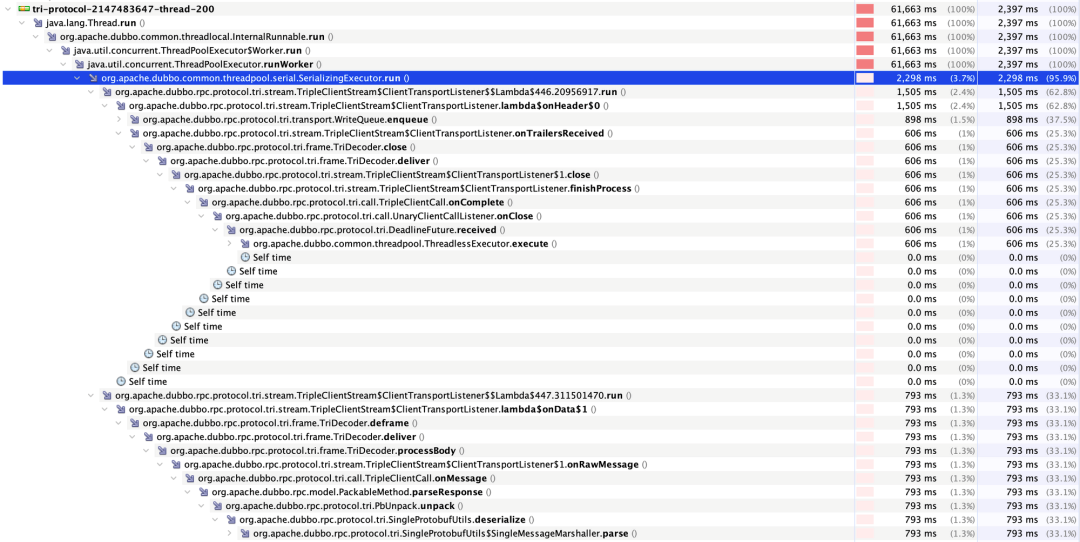
It seems that we can't see the bottleneck from the information above. Next, we try to use JFR to monitor the process information. The figure below is the log analysis of JFR.

First, we can view the brief analysis of JFR and click Java Blocking to view possible blocking points. This event indicates that a thread has entered the synchronized code block, as shown in the following figure:
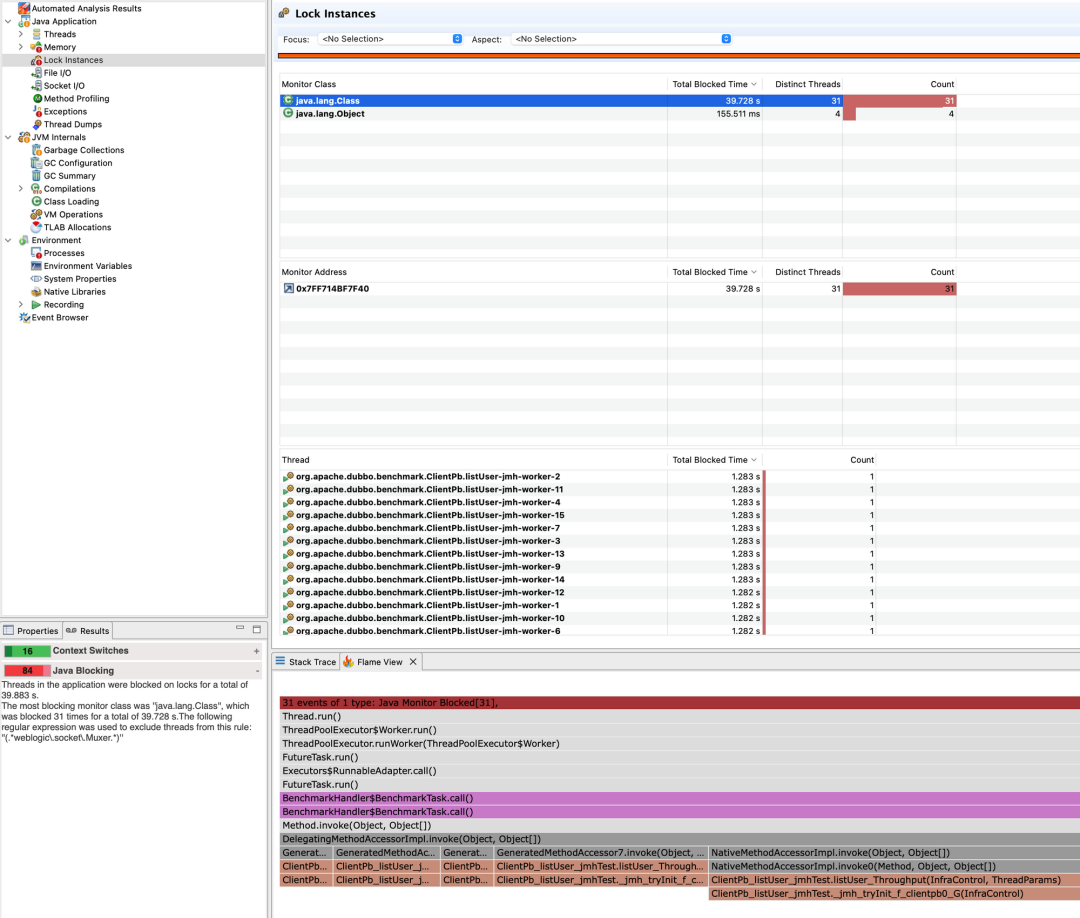
There is a Class with a total blocking time of 39 seconds. After clicking, we can see the Thread column in the figure. The blocked threads are all the threads used by the benchmark to send requests. Looking further down at the method stack shown in Flame View, we can find that this is waiting for the response result. The blocking is necessary, and the blocking point can be ignored.
Then, click Event Browser on the left menu to view the event logs collected by JFR and filter the list of event types known as Java. First, we look at Java Monitor Blocked, and the result is shown in the figure below:
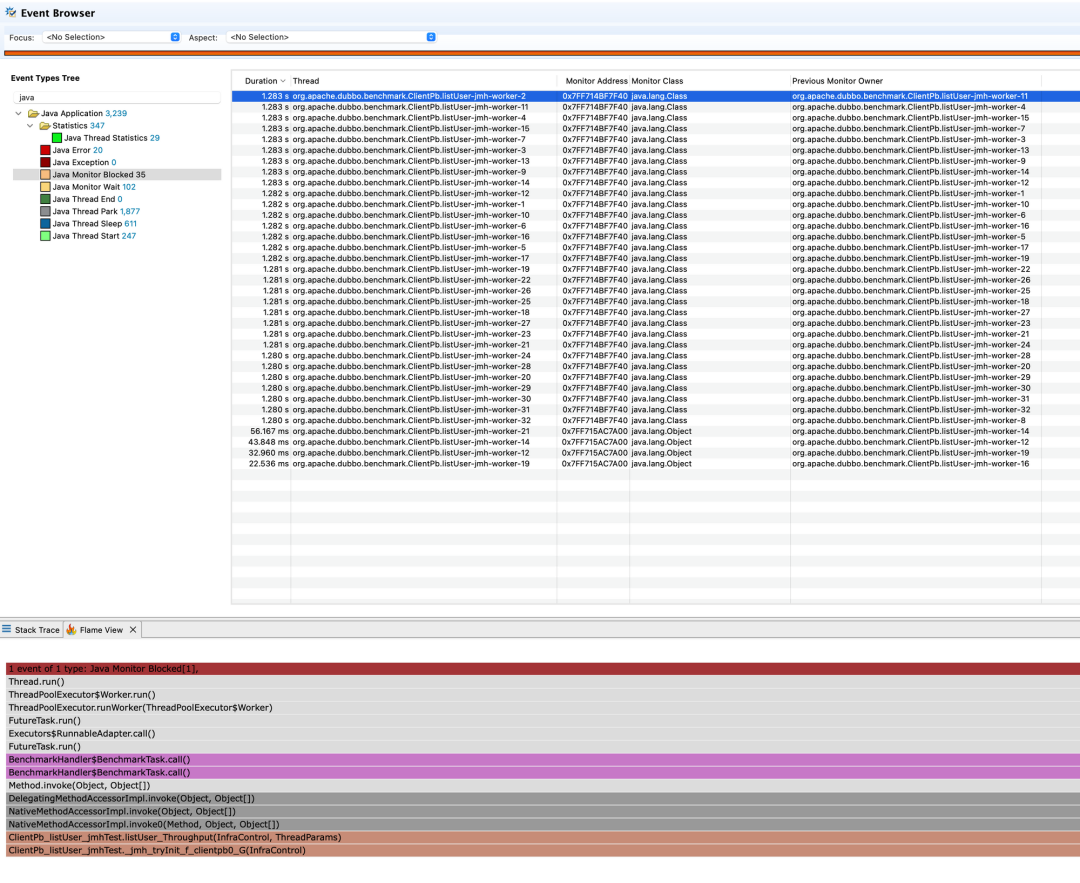
We can see that the blocked threads are all the threads used by the benchmark to send requests, and the blocking point is waiting for the response, which can exclude this event.
Then, we continue to view Java Monitor Wait. Monitor Wait indicates that the code has invoked the Object.wait() method. The result is shown in the following figure:
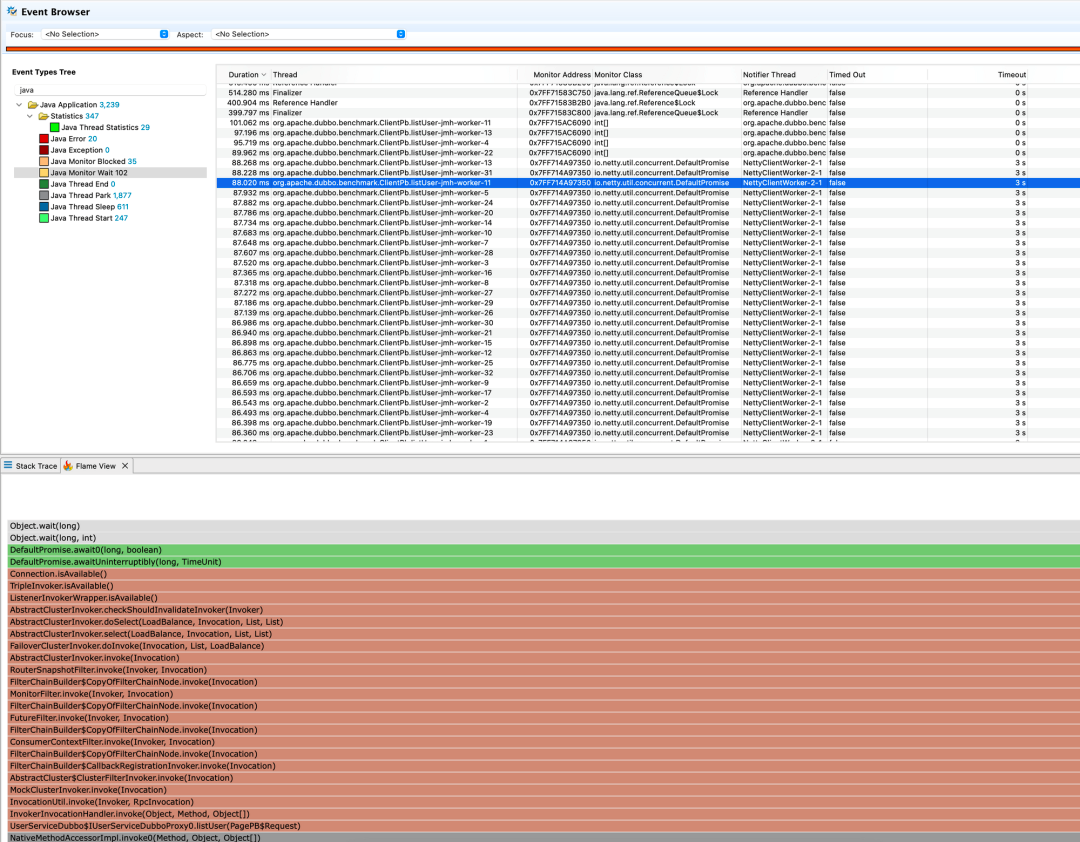
The preceding figure shows that all benchmark request threads are blocked, and the average waiting time is about 87ms. The blocking object is the same DefaultPromise. The block removing method is Connection.isAvailable. Next, we look at the source code for the method, which is shown below.The duration of this blocking is only the duration of establishing a connection for the first time and does not have much impact on the overall performance. Here, Java Monitor Wait can also be excluded.
public boolean isAvailable() {
  if (isClosed()) {
    return false;
  }
  Channel channel = getChannel();
  if (channel != null && channel.isActive()) {
    return true;
  }
  if (init.compareAndSet(false, true)) {
    connect();
  }

  this.createConnectingPromise();
  //The duration of about 87ms comes from here.
  this.connectingPromise.awaitUninterruptibly(this.connectTimeout, TimeUnit.MILLISECONDS);
  // destroy connectingPromise after used
  synchronized (this) {
    this.connectingPromise = null;
  }

  channel = getChannel();
  return channel != null && channel.isActive();
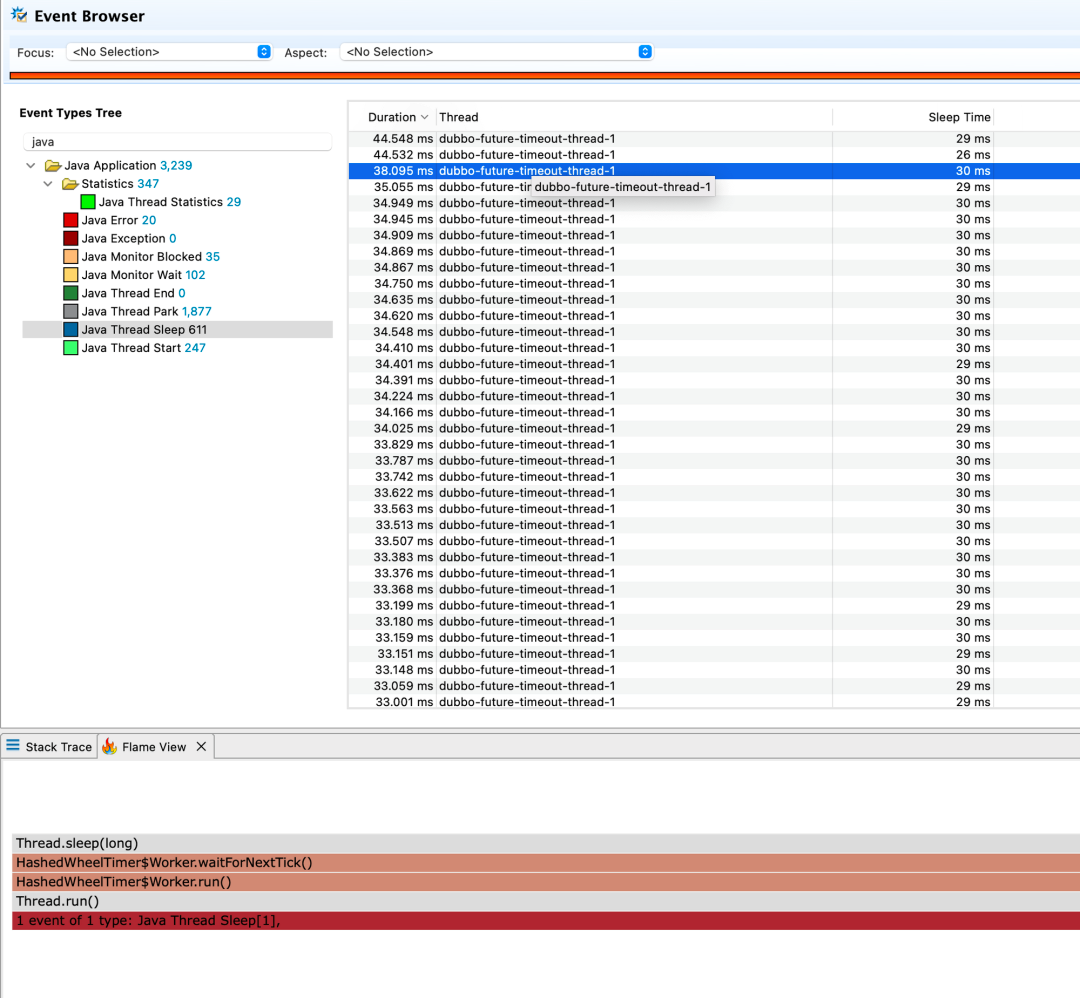
}Next, let's look at Java Thread Sleep, which indicates that there is a manual invoking Thread.sleep in the code to check whether there is a behavior that blocks the worker thread. As shown in the following figure, it is clear that the consumer thread or benchmark request thread is not blocked. This thread that actively invokes sleep is mainly used for request timeout scenarios, which has no impact on the overall performance. So, Java Thread Sleep can also be excluded.
Finally, let's look at Java Thread Park. The park event indicates that the thread is suspended. The following figure shows the park event list:
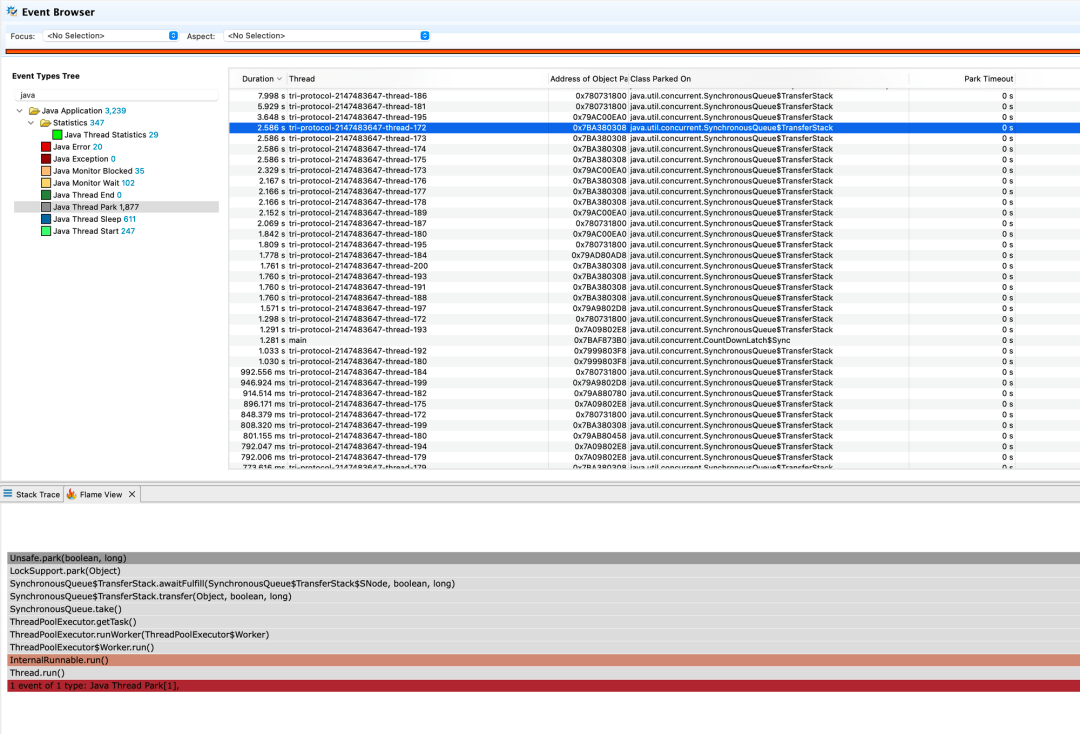
There are 1877 park events, and most of them are threads in the consumer thread pool. From the method stack in the flame view, it can be seen that these threads are waiting for tasks, and the duration of not fetching tasks is on the long side. This illustrates a problem: most of the threads in the consumer thread pool are not performing tasks, and the utilization of the consumer thread pool is very low.
Improving the utilization rate of the thread pool can reduce the number of threads in the consumer thread pool. But the number of threads in the consumer thread pool cannot be reduced directly in Dubbo. We try to package the consumer thread pool into SerializingExecutor in the UNARY scenario. This Executor can make the submitted tasks serialized and reduce the size of the thread pool in a disguised form. Let's look at the results:


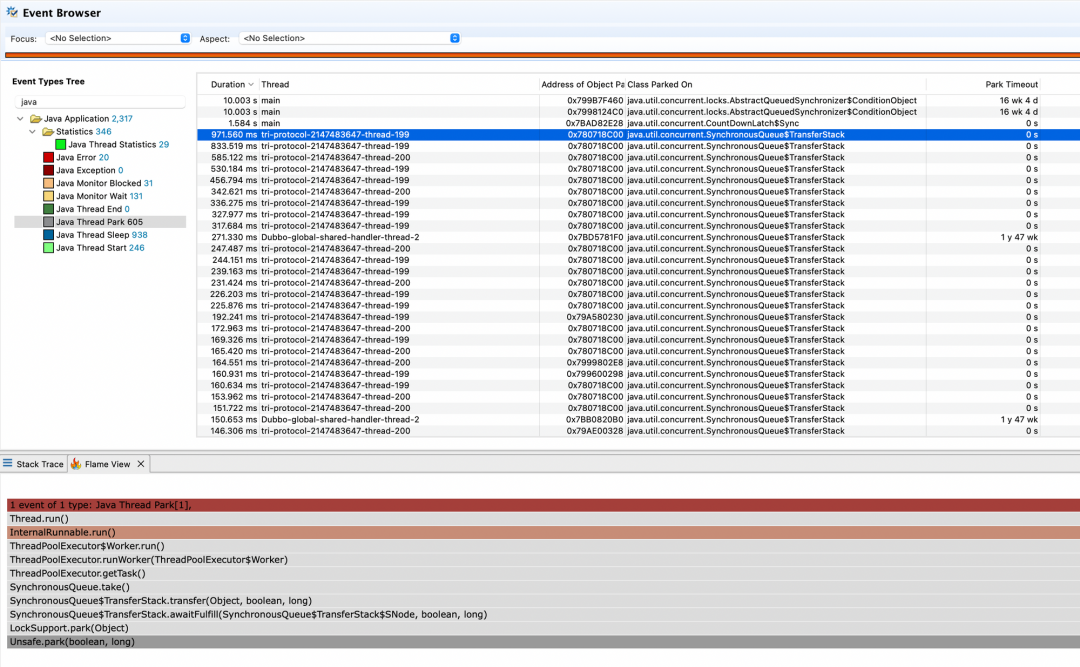
From the results above, we can see that a large number of consumer threads have been reduced, thread utilization has been significantly improved, Java Thread Park events have been significantly reduced, and performance has been improved by about 13%.
This shows that multi-thread switching has a great impact on program performance, and it also brings another problem. Is it reasonable for us to focus most of the logic on a small number of consumer threads through SerializingExecutor? With this question in mind, we expand the call stack of one of the consumer threads for analysis. We can see the word deserialize by expanding the method call stack, as shown in the following figure:
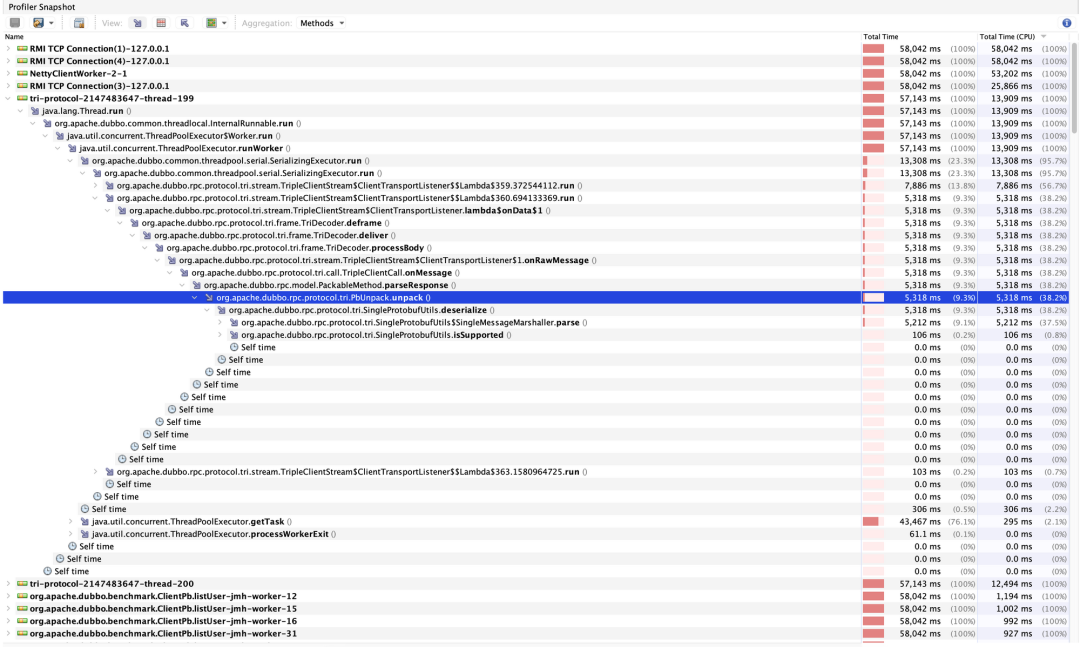
Although we have improved the performance, we have concentrated the deserialization behavior of the response body of different requests on a small number of consumer threads. This will cause deserialization to be serialized, and the time consumption will increase significantly when deserializing large data.
Can we find a way to send the deserialization logic to multiple threads for parallel processing? With this question in mind, we sort out the current thread interaction model first, as shown in the following figure:
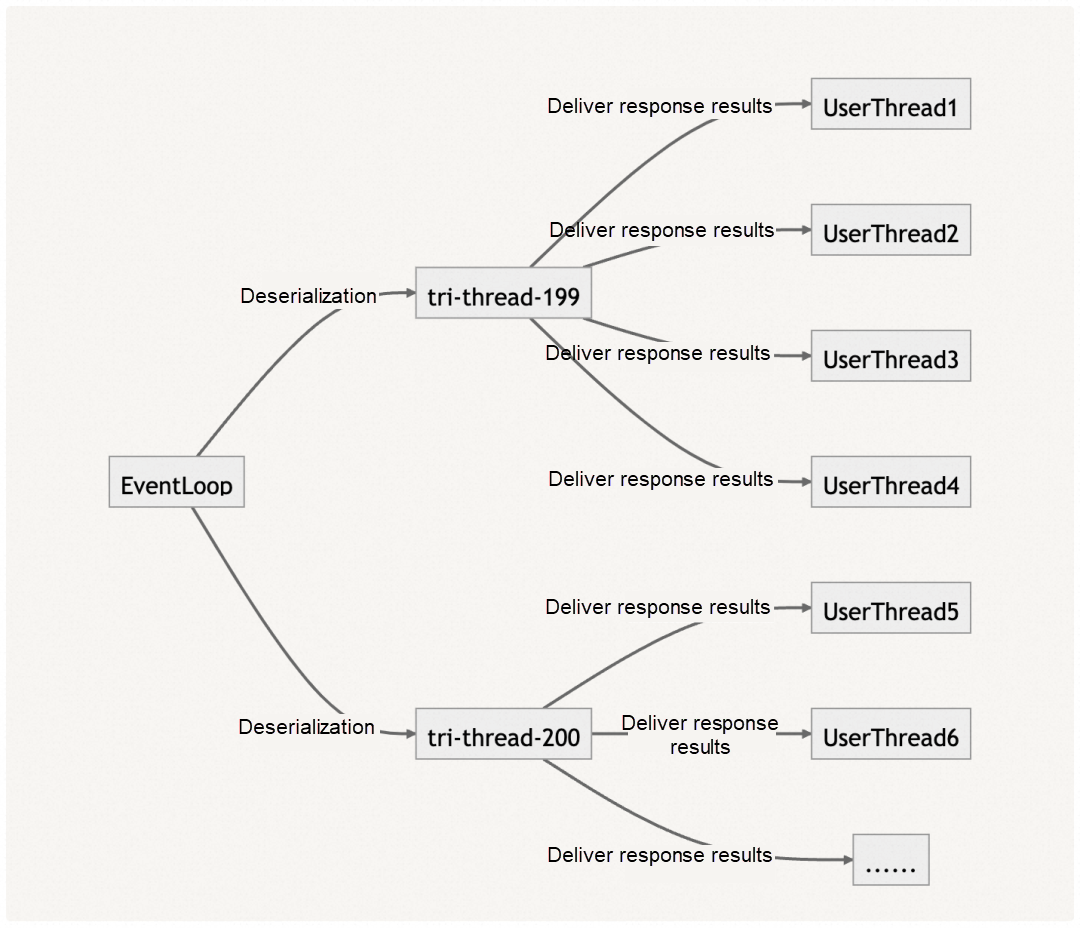
Based on the thread interaction diagram above and the characteristics of UNARY SYNC that one request corresponds to one response, we can boldly infer that ConsumerThread is unnecessary! We can directly hand over all non-I/O tasks to user threads for execution, which can effectively utilize multi-threaded resources for parallel processing and significantly reduce unnecessary thread context switching. So the optimal thread interaction model is shown in the following figure:
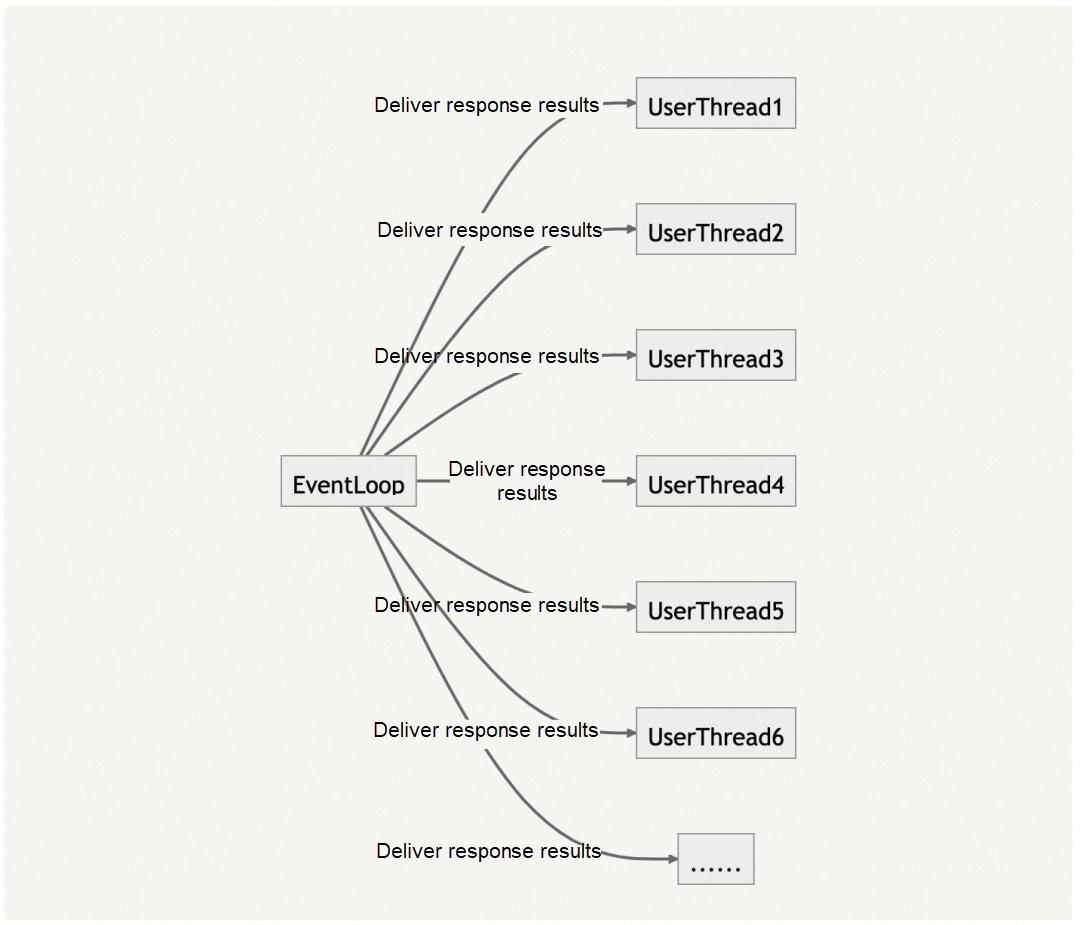
After sorting out the thread interaction model, our optimization idea is relatively simple. According to the TripleClientStream source code, whenever a response is received, the I/O thread will submit the task to Callback Executor bound to TripleClientStream. Callback Executor is the consumer thread pool by default, so we only need to replace it with ThreadlessExecutor. The optimization is listed below:

As we mentioned earlier, Triple is implemented based on the HTTP/2 protocol and is fully compatible with gRPC, which shows that gRPC is a good reference object. Therefore, we compare Triple with gRPC. Amid the same environment but different protocols, we find that there is a certain gap between the performance of Triple and gRPC. What is the difference? With this question in mind, we perform stress testing on the two protocols and try to use tcpdump to capture the two packets. The results are listed below.
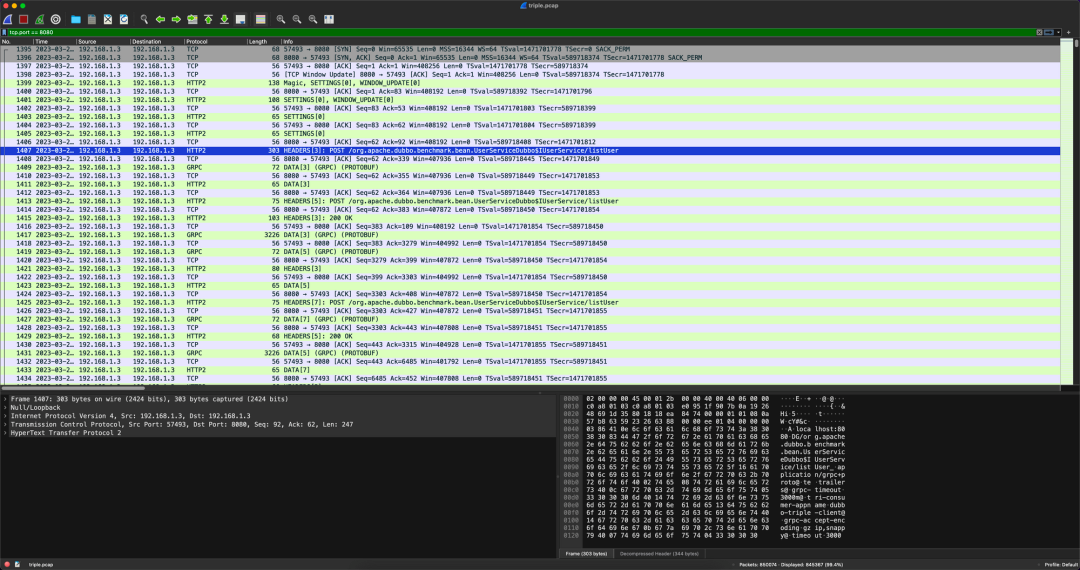
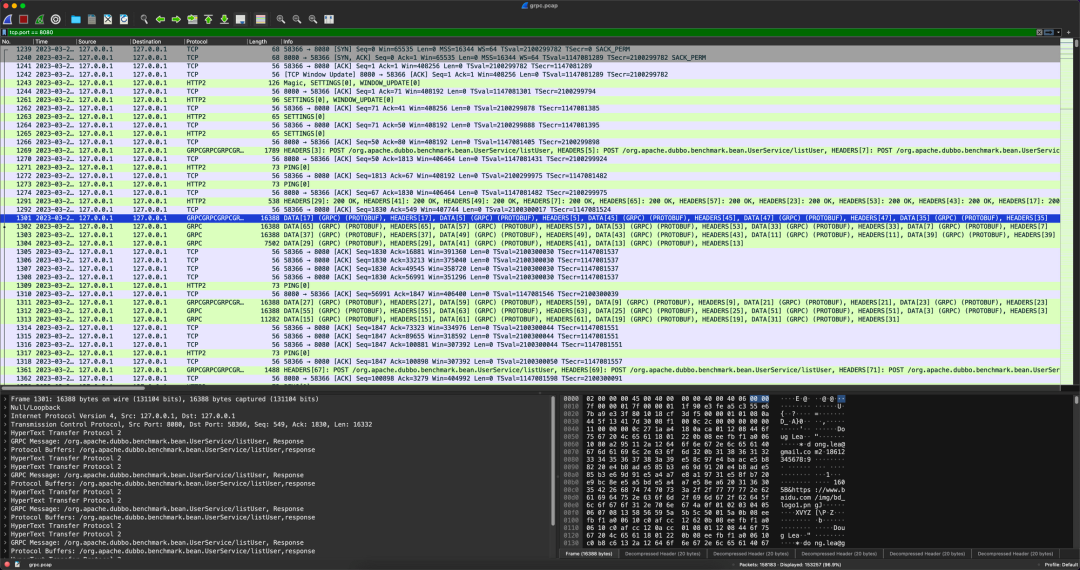
The results above show that the packet capture between gRPC and Triple is very different. In gRPC, a large number of different stream data are sent at one time point, while Triple follows the rule that one request corresponds to one response to the letter. Therefore, we can boldly guess that there must be batch sending behavior in the code implementation of gRPC. A group of data packets is sent as a whole, significantly reducing the number of I/O. We need to have a deep understanding of the gRPC source code to verify our guess. Finally, we find that the implementation of batching in gRPC is located in WriteQueue, and its core source code fragment is listed below:
private void flush() {
  PerfMark.startTask("WriteQueue.periodicFlush");
  try {
    QueuedCommand cmd;
    int i = 0;
    boolean flushedOnce = false;
    while ((cmd = queue.poll()) != null) {
      cmd.run(channel);
      if (++i == DEQUE_CHUNK_SIZE) {
        i = 0;
        // Flush each chunk so we are releasing buffers periodically. In theory this loop
        // might never end as new events are continuously added to the queue, if we never
        // flushed in that case we would be guaranteed to OOM.
        PerfMark.startTask("WriteQueue.flush0");
        try {
          channel.flush();
        } finally {
          PerfMark.stopTask("WriteQueue.flush0");
        }
        flushedOnce = true;
      }
    }
    // Must flush at least once, even if there were no writes.
    if (i != 0 || !flushedOnce) {
      PerfMark.startTask("WriteQueue.flush1");
      try {
        channel.flush();
      } finally {
        PerfMark.stopTask("WriteQueue.flush1");
      }
    }
  } finally {
    PerfMark.stopTask("WriteQueue.periodicFlush");
    // Mark the write as done, if the queue is non-empty after marking trigger a new write.
    scheduled.set(false);
    if (!queue.isEmpty()) {
      scheduleFlush();
    }
  }
}
It can be seen that gRPC abstracts each data packet into QueueCommand. When the user thread initiates the request, it does not write it directly but submits it to WriteQueue and manually schedules EventLoop to execute the task. The logic that EventLoop needs to execute is to take the request out of QueueCommand and execute it. When the written data reaches DEQUE_CHUNK_SIZE (default 128), channel.flush will be called to brush the contents of the buffer to the opposite end. After all commands in the queue are executed, a flush is performed as needed to prevent message loss. This is the batch write logic of gRPC.
Similarly, we have checked the source code of the Triple module and found that there is also a class called WriteQueue, whose purpose is also to write messages in batches and reduce the frequency of I/O. However, judging from the results of tcpdump, the logic of this class does not seem to meet expectations, and messages are still sent one by one in sequence and not in batches.
We can set the breakpoint in the WriteQueue constructor of Triple to check why WriteQueue of Triple does not meet the expectation of batch writing. Let's look at the following figure:
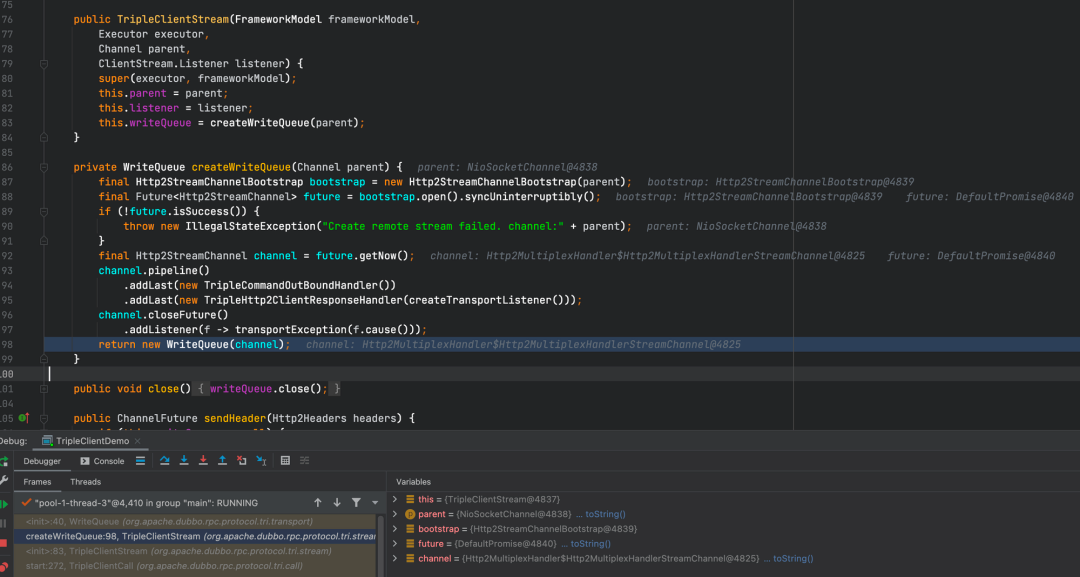
WriteQueue can be instantiated in the TripleClientStream constructor, while TripleClientStream corresponds to the stream in HTTP/2. Each time a new request is initiated, a new stream needs to be constructed. As a result, each stream uses a different WriteQueue instance, and the commands submitted by these streams are not in the same place. In this case, different streams will flush directly at the end of the request initiation, making the frequency of I/O too high, seriously affecting the performance of Triple.
After analyzing the reasons, the direction of optimization is clearer, so use WriteQueue as a connection-level share instead of a connection where each stream holds a WriteQueue instance. When the WriteQueue connection level is in the singleton mode, it can make full use of its ConcurrentLinkedQueue as a buffer to write the data of different streams to the peer end with one flush, significantly improving the performance of Triple.
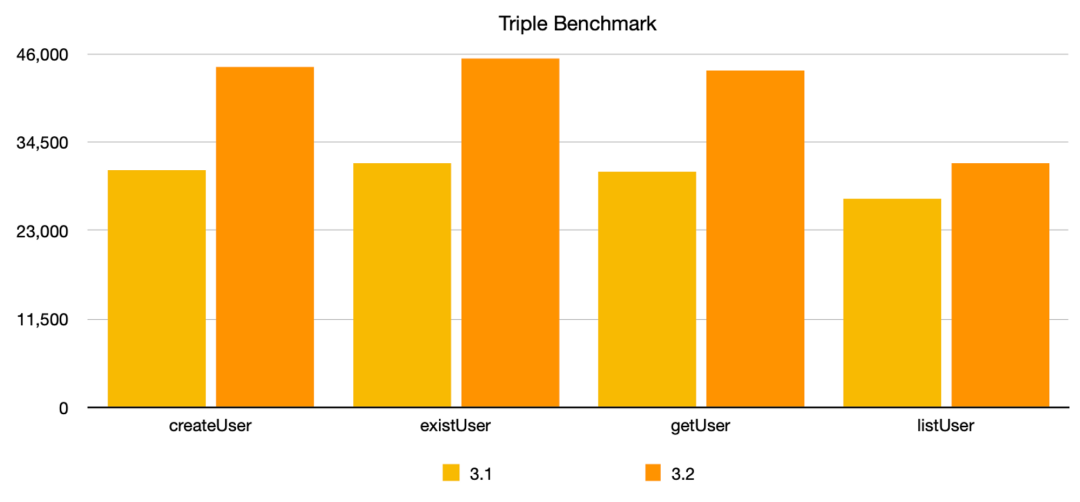
Finally, let's take a look at the results of Triple optimization. The performance in tabloid scenarios has improved significantly, with the highest improvement rate reaching 45%, but the improvement rate in larger packet scenarios is limited. Improving performance in larger packet scenarios is one of the future optimization goals of the Triple protocol.
How Do We Use One Port to Expose the HTTP1/2, gRPC, and Dubbo Protocols at the Same Time?
An Exploration and Improvement of Dubbo in Proxyless Mesh Mode

688 posts | 56 followers
Followblock - September 14, 2021
Alibaba Cloud Community - May 29, 2024
Alibaba Cloud Native Community - September 12, 2023
hujt - April 1, 2021
fengcone - June 1, 2021
Alibaba Cloud Community - March 9, 2022

688 posts | 56 followers
Follow Cloud-Native Applications Management Solution
Accelerate and secure the development, deployment, and management of containerized applications cost-effectively.
Learn More Cloud Parallel File Storage
The fully-managed scalable parallel file system can meet your requirements on high-performance computing.
Learn More Lindorm
Lindorm is an elastic cloud-native database service that supports multiple data models. It is capable of processing various types of data and is compatible with multiple database engine, such as Apache HBase®, Apache Cassandra®, and OpenTSDB.
Learn More Function Compute
Alibaba Cloud Function Compute is a fully-managed event-driven compute service. It allows you to focus on writing and uploading code without the need to manage infrastructure such as servers.
Learn MoreMore Posts by Alibaba Cloud Native Community