Why is a page taking so long to come back — is rendering slow, is the model slow, or is the business service behind a tool slow? Follow one real request to find where to start looking. (Best suited to developers and site reliability engineers who use server-side rendering (SSR) or are adding AI to Node.js applications.)
Intended for developers and SREs who use SSR or are adding AI to Node.js applications.
"How far along is my refund, and when will the money arrive?"
A user asks a question on the after-sales page and waits for an answer. Once an Agent is in the loop, more work happens behind that page: understanding the question, choosing a tool, querying the order, and turning the result into a reply the user can read.
When the page doesn't come back, where should the team start looking?
If you only look at the entry request's duration, it's hard to tell which layer the wait is on; if you only look at model calls, you may miss the business service behind a tool. The Application Real-Time Monitoring Service (ARMS) Node.js instrumentation agent links server-side rendering, Agent execution, and downstream calls into a single trace, so you start from the page the user visited and follow the request all the way down.
Designed for SSR and AI Agent applications, the Alibaba Cloud ARMS Node.js agent automatically stitches page rendering, model calls, tool execution, and downstream services into one trace. Developers can quickly pinpoint slow requests, wrong parameters, and business bottlenecks, and use logs, metrics, and token usage to reconstruct the full picture — which makes troubleshooting faster.
In an SSR application built with Next.js or Nuxt, page content is generated on the Node.js server. Whatever the rendering process waits for — data, APIs, business logic — affects how fast the page comes back.
When an Agent joins that server-side logic, the page may also wait on model generation, tool queries, and multiple rounds of calls. To the user it's a single page visit; to the developer it's an execution path that runs through the web framework, the AI framework, and business systems.
This is the value of the Node.js instrumentation agent in SSR + AI scenarios: you see both how the page is generated and how the AI Agent completes its task. For teams that build full-stack applications and are adding AI at the same time, both parts can be investigated on the same trace.
The rest of this post walks through a live after-sales query demo. We focus on the server-side trace here; browser loading and interaction can be observed with Real User Monitoring (RUM).
In the demo, Next.js serves the after-sales page and Mastra orchestrates the after-sales Agent, which calls qwen-plus through Alibaba Cloud Model Studio. Once the Agent picks the order query tool, the request goes through the Model Context Protocol (MCP) to an MCP server, then calls the order service, reads from and writes to Redis, and finally composes an answer about after-sales progress.
The page waits for the Agent's result before responding. The components are actually running; the order and after-sales content is demo data.
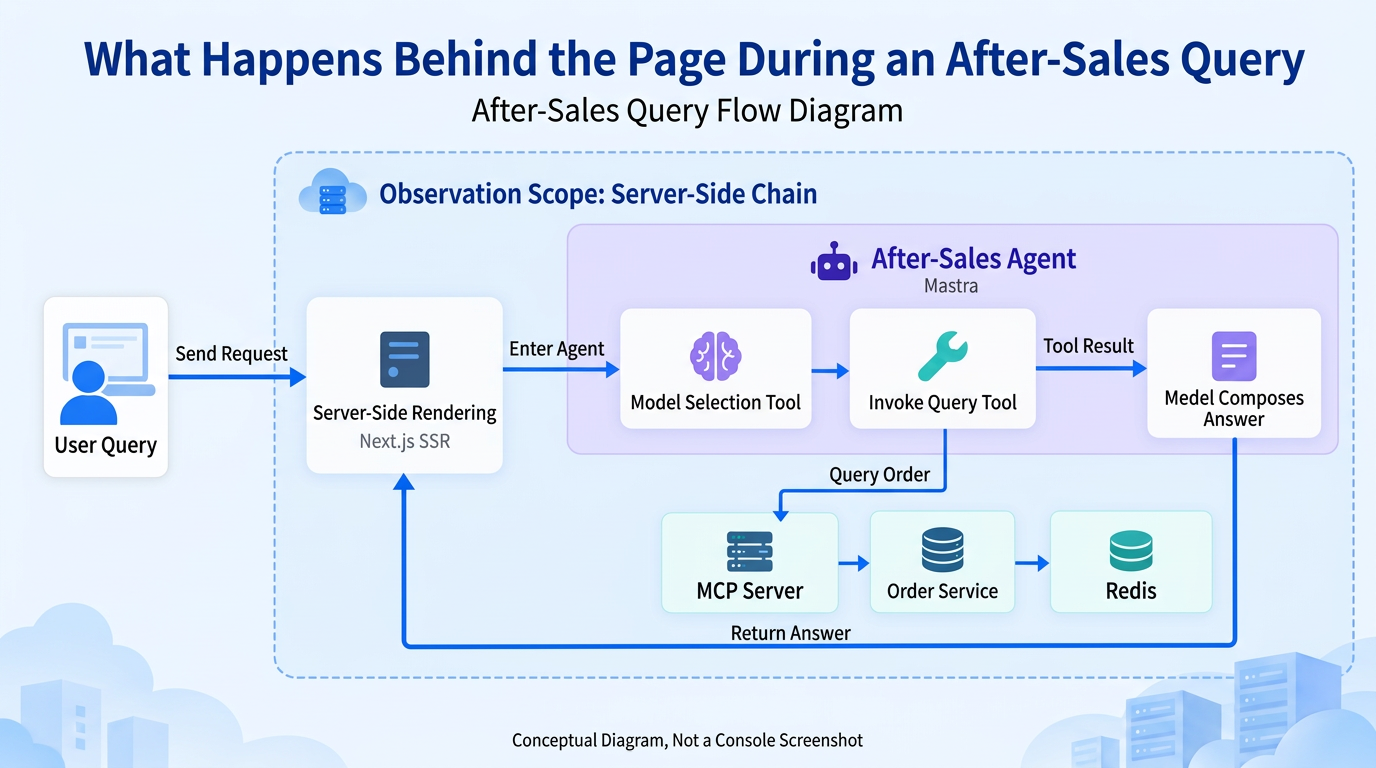
Figure 1 | Flow of the after-sales query (not a console screenshot). The Agent calls a tool to query the downstream order service, builds its answer from the tool result, and hands it back to the page. The blue area marks the server-side trace this post covers.
Open Application Monitoring in Cloud Monitor 2.0, and the execution of the same request unfolds:
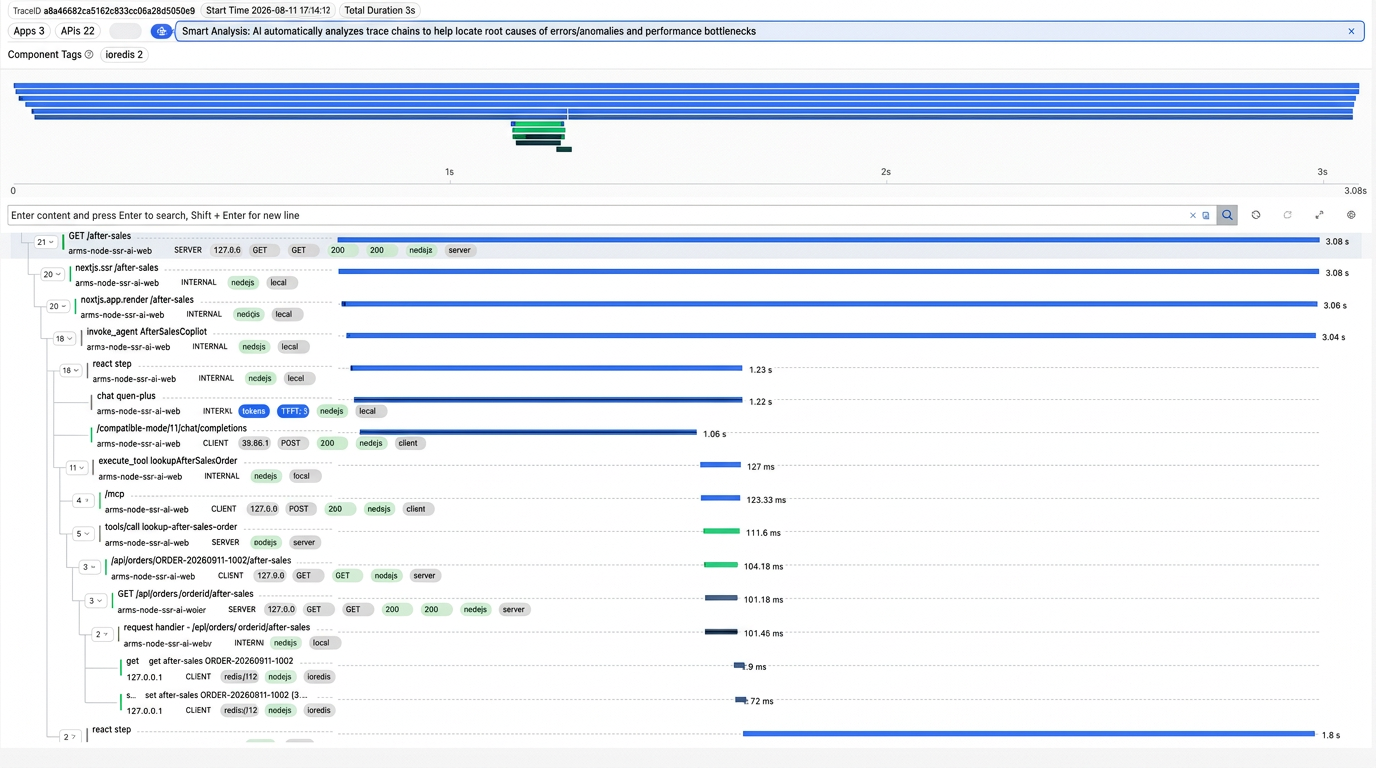
Figure 2 | A real demo trace: Next.js SSR → Agent → model and tools → MCP server → order service → Redis. All three applications are correlated by the same trace ID, and this server-side request took about 3.08 seconds.
Drill down from the page entry and you can see the Next.js rendering phase, then keep going to the Agent, model, and tool nodes. Which service the tool called, and whether that service went on to query Redis, are both in this trace.
For a developer, troubleshooting no longer stops at "the after-sales API is slow." The work the page is waiting on now has a location, cross-service calls have context, and you can keep following the same request instead of lining up timestamps across systems first.
Connecting the trace is one thing — you still need to see what the AI part actually did.
Switch to AI Agent Observability in Cloud Monitor 2.0 and, with the same trace ID, you can see that this after-sales query went through two rounds of model calls: the first turned the question into an order query tool call plus the order number parameter; after the tool returned, the second round produced the refund status, amount, refund method, and expected arrival time.
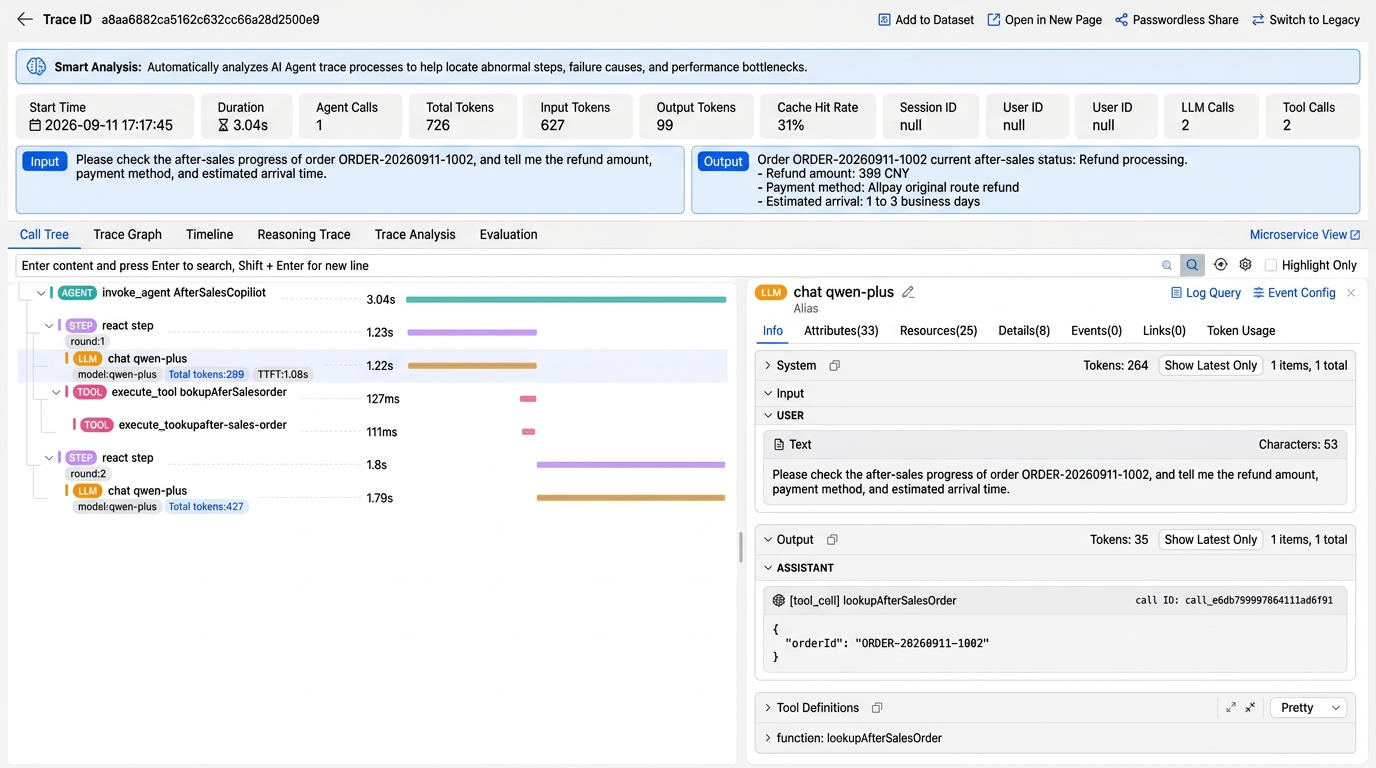
Figure 3 | Agent view of the same trace. The left side shows the execution steps; the right shows the input to the first model round and the tool call output; the top shows the Agent's final answer, along with token usage and time to first token.
When a user says the answer is wrong, developers can start by checking the question the model actually received, the tool parameters it generated, and the data the tool returned. Whether the model got the right business information is no longer a guess.
When responses get slower, look at model call rounds, time to first token, and tool duration together; when token usage climbs, go back to the specific request and see how it was invoked. Time to first token appears when the framework and the calling mode expose the corresponding streaming data.
Put inputs and outputs, execution steps, and token consumption side by side, and AI troubleshooting finally has a business record you can check against. What you see here is the observable execution path; in production, decide what to collect from user questions, answers, and tool content according to your data security requirements.
Here's another request. We added about 1.3 seconds of latency to the order service to simulate an after-sales query waiting on a downstream call.
From the Agent's side, the order query tool took about 1.32 seconds. Drill down through the MCP and the order API took about 1.31 seconds, while the Redis operation took only a few milliseconds.
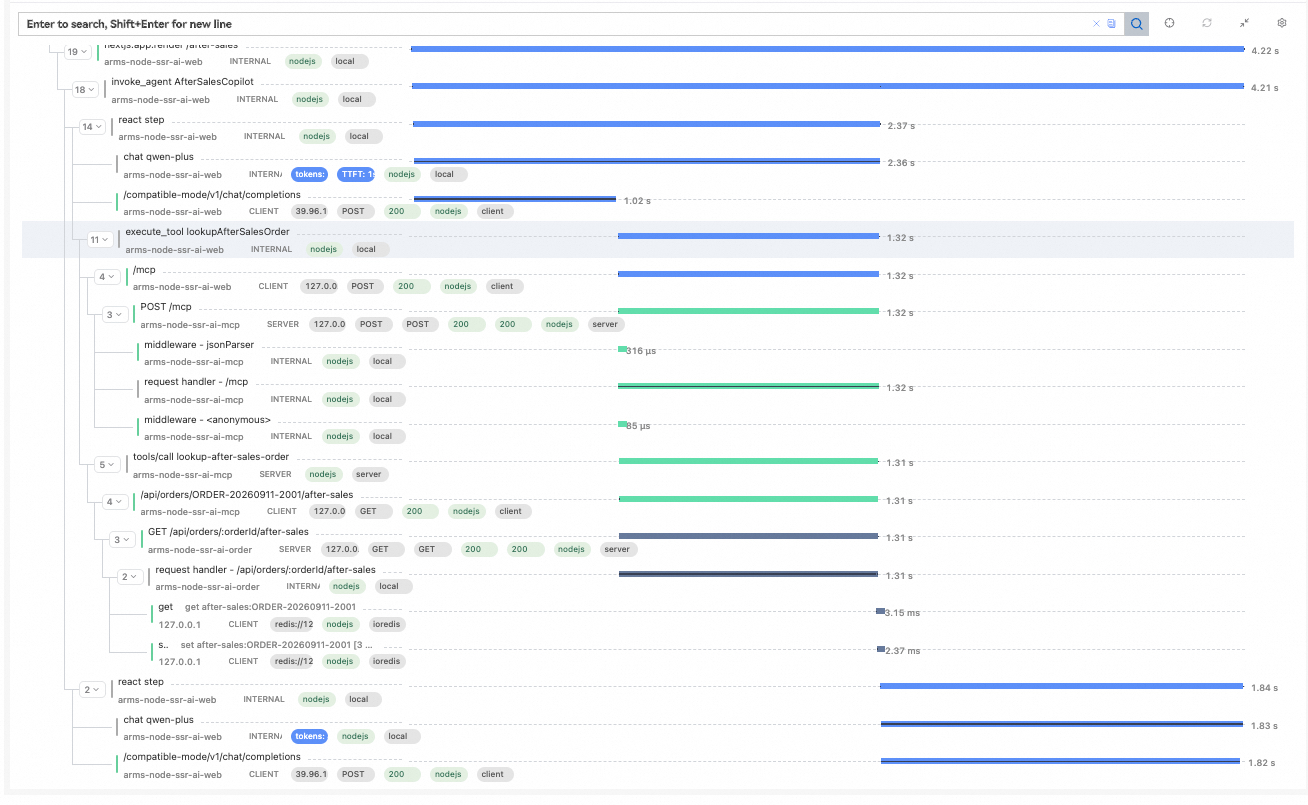
Figure 4 | A partial trace of another slow request. The demo adds latency to the order service on purpose: the tool call and the order API take similar time, and Redis accounts for only a few milliseconds.
At this point, the next step narrows to what happens inside the order service. Swapping the model or tuning the cache doesn't have to be your first, unverified move; follow the trace, then bring in service logs and code to confirm where the business wait comes from.
Back to the user's question: a page that won't come back doesn't necessarily mean the model is generating slowly. The page waits on the Agent, the Agent waits on the tool, and the tool's wait can be traced further down into the business service.
That's what end-to-end observability buys you: it turns a vague "the AI is slow" into a trail with locations and upstream/downstream relationships.
The after-sales query is just one entry point. The same need shows up in product recommendations, internal knowledge assistants, and any other application that puts AI behind a page.
This demo uses Next.js and Mastra. If your application runs on Nuxt, the agent covers SSR and server-side API observability there too; if your AI is built with Genkit, the agent also collects the execution of flows, models, tools, and retrieval. Tool calls already adapted with the MCP server SDK extend that view further into your business systems.
As pages, workflows, and tools pile up, hand-maintaining instrumentation for each node means continuously maintaining call relationships and collection logic. Framework-level automatic instrumentation cuts down on that repetitive work, and teams can still add business attributes as needed, so observability scales with the business.
Beyond AI, supported dependency calls — HTTP, databases, caches, messaging — and Node.js runtime metrics keep supplying clues on the business side. Traces link to logs to capture the context of a single request, while metrics offer trends across applications, instances, and time windows. Teams can chase one slow request and still reason from the aggregate.
If your team runs SSR, or is about to put an Agent into a Node.js application, pick one clear business entry point and let a real request run through the page, the model, and the tools. Then see whether the waits and errors can be traced to a spot on the chain.
Go to the Cloud Monitor 2.0 console and add the ARMS Node.js agent from the Integration Center. Once it's in, check server-side calls and Agent execution under Application Monitoring and AI Agent Observability.
For the exact steps, see Manually Install the Node.js Agent. For supported components and versions, see the official support list.
During integration, make sure the agent loads before your business framework. The "end-to-end" in this post means the server-side trace within the scope of supported components, with context propagating normally and traces retained by sampling. Plugins differ in how they collect, truncate, and mask model and tool inputs and outputs, so check each one, apply the principle of data minimization, and where needed mask the content in advance or turn off collection of that content.
From page rendering to Agent execution, what the user is waiting for is the completion of a business task. Only when that path is clear can developers aim their troubleshooting at the step that actually affects this request.
What's the hardest issue you've had to track down on an SSR or Agent trace? Let us know in the comments.
Teaching Agents to Decide: From JEV Integration to the Full Harness Decision Flow

799 posts | 60 followers
FollowAlibaba Cloud Native Community - July 30, 2026
Alibaba Cloud Native - August 14, 2024
Alibaba Cloud Native Community - September 18, 2026
Alibaba Cloud Native Community - July 28, 2026
Alibaba Cloud Native Community - September 8, 2026
Alibaba Cloud Native Community - June 10, 2026
799 posts | 60 followers
Follow Application Real-Time Monitoring Service
Build business monitoring capabilities with real time response based on frontend monitoring, application monitoring, and custom business monitoring capabilities
Learn More CloudMonitor
Automate performance monitoring of all your web resources and applications in real-time
Learn More Global Application Acceleration Solution
This solution helps you improve and secure network and application access performance.
Learn More ADAM(Advanced Database & Application Migration)
An easy transformation for heterogeneous database.
Learn MoreMore Posts by Alibaba Cloud Native Community

