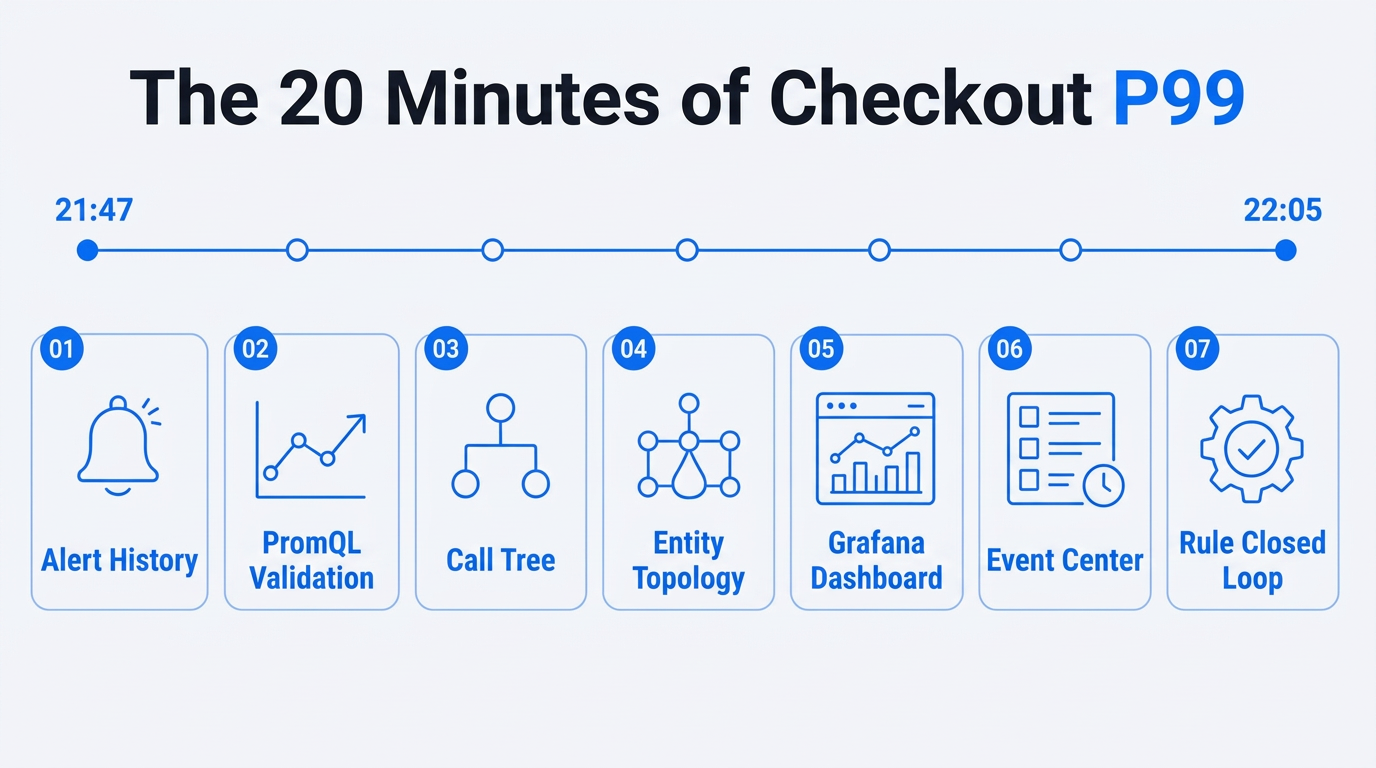
It was 21:47 on a Friday night when Chen's DingTalk went off again.
The alert title was short: checkout service P99 latency above 2 seconds. That service is the core of the checkout path, and if it so much as stutters during the evening peak, the support chat quickly fills up with "Why can't I pay?"
Chen didn't start by opening five consoles. He glanced at Cursor on his screen, which was already connected to the Model Context Protocol (MCP) server for Cloud Monitor (CMS), and gave the Agent a single instruction:
"Find out what just happened to checkout. Get to the root cause, and if monitoring has a gap, fill it."
Twenty minutes later, a conclusion landed in the on-call group: the latency came from the downstream payment gateway, infrastructure events showed no corresponding anomaly, and an error-rate alert had been added.
What changed in those twenty minutes wasn't that the model suddenly "got" observability. It was that, for the first time, the model could investigate, verify, and make changes through the real CMS operating surface — without first assembling a full CLI environment on this particular on-call laptop.
LLMs are great at reasoning, and at stitching symptoms into hypotheses. What they can't do is get into your Alibaba Cloud account, see the curves in Prometheus, or change an alert rule. The missing piece isn't a longer prompt; it's a set of tools that can be called safely.
MCP is exactly that set of conventions: the model understands the goal and picks the next step, and the tools do the actual work. Think of it as the badge and toolbox you hand the Agent. Without a badge, the model can only analyze from behind the glass. With one, querying alerts, running queries in the Prometheus Query Language (PromQL), pulling a trace tree, and adding a rule all become auditable operations on the cloud.
Alibaba Cloud has already released the official CMS CLI, aliyun cms2. It gathers CMS 2.0 queries and management operations into a single command tree, and that tree was built for Agents from the start: the command contract is stable, output is structured JSON, a failure is reported as a failure, and credentials go through Resource Access Management (RAM) and the Alibaba Cloud configuration chain. You can type the commands in a terminal, scripts and continuous integration (CI) pipelines can call them, and Cursor or Claude Code can run them locally:
aliyun cms2 alert history list --workspace prod-ecommerce
aliyun cms2 metric promql query-range --prometheus-id pi-xxx --query '...'
The cost of the local path isn't the commands themselves; it's the execution environment. The caller has to prepare all of it: the binary installed at a matching version, credentials configured via aliyun configure or environment variables, permission for the process to launch child processes, and network access to the CMS OpenAPI. The on-call engineer's own laptop usually has all of this. Move to a machine without aliyun cms2 installed, or run the Agent in a sandbox with no cloud credentials, and the session breaks off at "command not found" or "not configured."
CMS MCP is not a separate "API for AI." It maps the leaf commands of that same command tree one by one onto MCP tools. alert rule list becomes alert_rule_list; metric promql query-range becomes metric_promql_query_range. The permission model, failure semantics, and audit objects are identical to the CLI. The difference isn't who may use it, but where execution happens: the CLI runs on the Agent's own machine (or in whatever runtime the caller provides), while MCP exposes the same tree at a remote endpoint. Once a client connects, it can call tools/list and tools/call right away; each tool carries its own schema, and no CLI has to be installed on every Agent host.
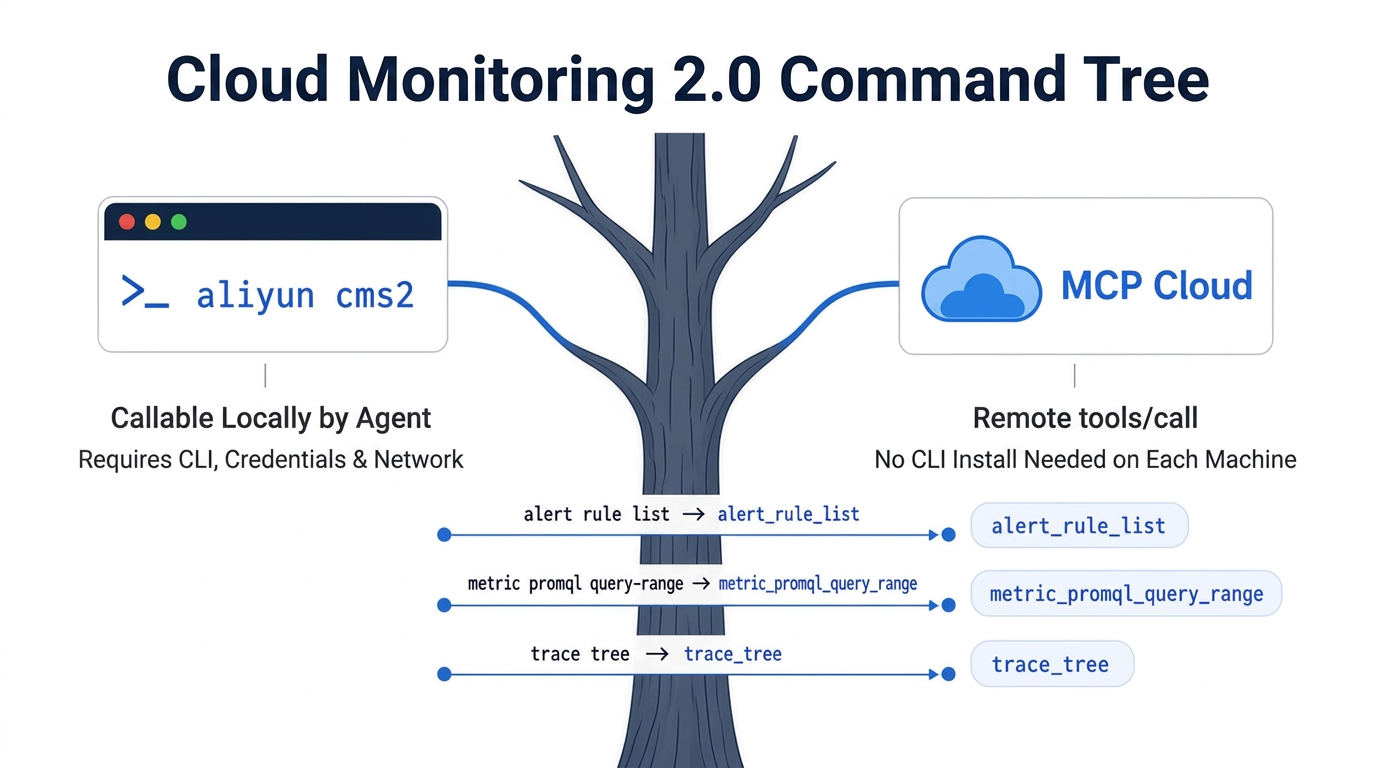
Last month Chen tried having an Agent call aliyun cms2 locally. It worked on his own machine, but his on-call partner hadn't installed the plugin and used a different profile, so they ended up back in the console. Tonight Cursor is connected to the remote MCP endpoint, the environment lives on the server side, and switching machines mid-shift no longer starts with a round of installation troubleshooting.
The workspace is called prod-ecommerce. Chen has been on call for years, and this alert is nothing new. In the console era, the path ran through the alert list, then Prometheus, then trace search, then back to the rule page. Once the CLI folded those steps into commands, they became precise and repeatable, and an Agent could run them one by one as long as the environment was complete. What really eats time is the exploration itself — you only know which class of tool to reach for next after you've seen the current result — plus the question of whether the execution environment is still in place.
Tonight the environment isn't the problem. He hands the Agent the goal and the permissions and lets the tools follow the evidence.
First, confirm what fired. The Agent calls alert_history_list, filters by workspace, severity, and time, and lands on the rule checkout-p99-latency. Then alert_rule_get pulls the full rule: it watches P99 on the checkout API, fires when the value stays above 2 seconds for 2 consecutive minutes, and notifies the on-call group. At that point the incident is no longer "it timed out again" but a definition you can check against.
Next, check the curves so the alert title doesn't lead you astray. After confirming the Prometheus instance, the Agent calls metric_promql_query_range and pulls the last hour of P99 latency and 5xx error rate. Latency starts climbing at 21:40; the error rate barely moves. The problem is "getting slower," not "starting to fail broadly." Chen has seen too many nights where someone changed code first and only later found that a dependency was simply jittering; this step points the investigation back in the right direction.
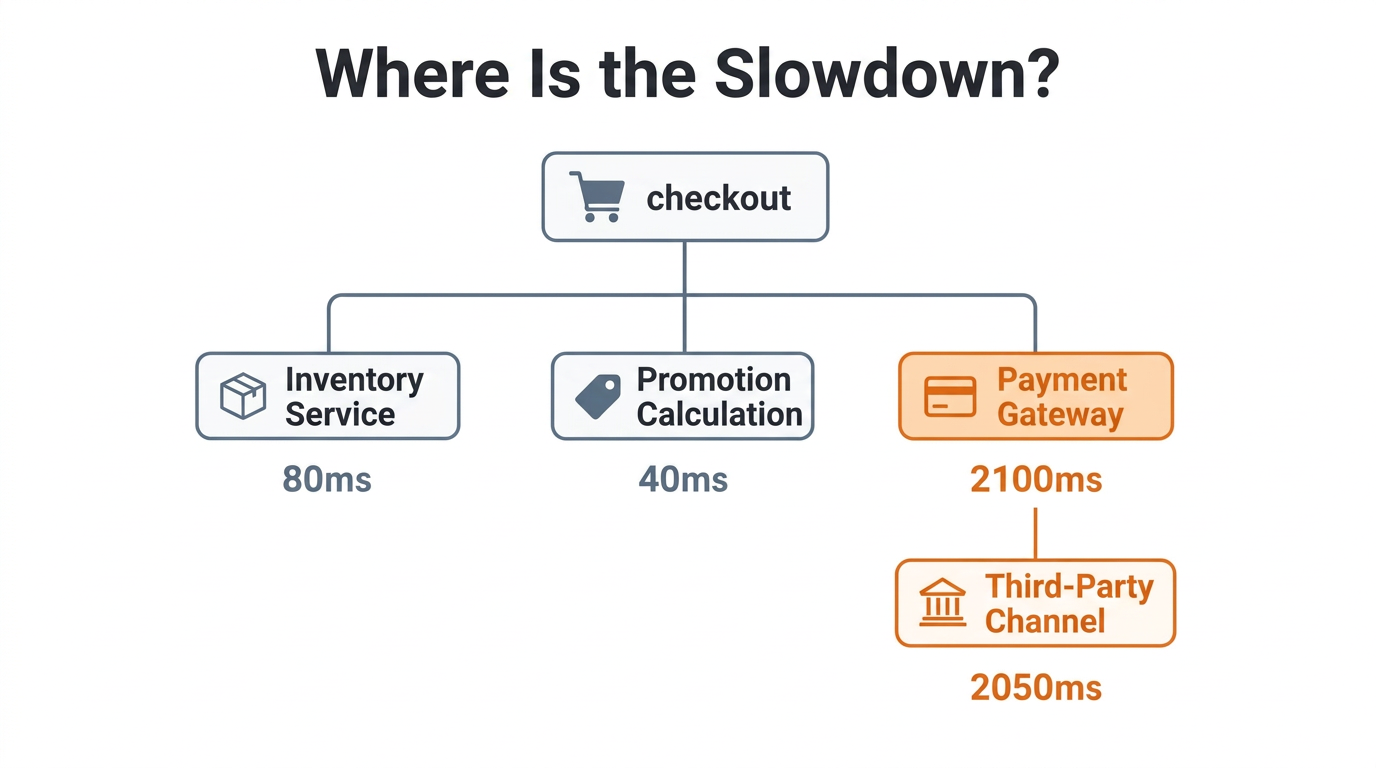
Then dig into the traces and catch a slowpoke. trace_search finds spans over 2 seconds for that service name within the time window; one trace ID then goes into trace_tree. The trace tree says more than the curves do:
checkout
 ├─ inventory service     80ms
 ├─ discount calculation  40ms
 └─ payment gateway     2100ms
     └─ third-party channel  2050ms
The root-cause candidates narrow at once: checkout itself isn't slow; the downstream payment call is holding up the entire checkout.
Then cross-check twice:entities and dashboards. entity_query verifies checkout's dependencies in the production environment, so nobody reads the wrong service name or the wrong environment. grafana_dashboard_search finds checkout-overview, and grafana_dashboard_panel_queries extracts the panel queries, which line up with the earlier PromQL. To rule out an unstable machine or network segment, event_hub_list checks cloud service events in the same time window: no matching anomalies in Elastic Compute Service (ECS), Server Load Balancer (SLB), or ApsaraDB RDS.
By now the evidence is solid enough to post to the on-call group. Chen asks for one more thing:
"A latency alert alone isn't enough. Add a rule for checkout 5xx error rate above 1% for 2 consecutive minutes, notifying the same on-call group."
The Agent calls alert_rule_create. If the only change were lowering the original rule's threshold from 2 seconds to 1.5 seconds, the Agent would use alert_rule_patch instead, and any fields left unspecified would keep their existing server-side values. If the on-call group's bot needs double-checking, the Agent can pull the notification channel list at that point.
22:05: the conclusion goes out. No stack of ten screenshots, and no flipping back to the console to double-check.
The core value of CMS MCP isn't that the model writes better PromQL. It's that the most time-consuming stretch of observability work — gathering evidence back and forth across alerts, metrics, traces, entities, dashboards, and events, then turning the result into a single action — now fits inside one session, and execution no longer depends on every Agent machine carrying its own CLI environment.
The aliyun cms2 CLI has already settled the operation contract: the same command can be issued by a person, by an Agent, or by a script or pipeline. When a local Agent goes through the CLI, installation, credentials, network, and version are the caller's responsibility. MCP doesn't change the tree; it changes delivery: remotely discoverable, trimmed by product domain, with schemas that travel with the tools. Troubleshooting isn't ten commands written in advance. You only pull traces once you see that the error rate hasn't moved; you only check entities and dashboards, and rule things out in the Event Center, once the trace tree points at the payment gateway. Sharing a single source with the CLI is what guarantees that the results of that exploration line up with the commands you'd run in a terminal.
This is also why MCP remains bound by RAM. Read-only investigation can run on AliyunCloudMonitorReadOnlyAccess; changing rules or integrations requires write permissions. An on-call identity can be read-only, with changes governed by a separate policy. However capable the Agent is, it shouldn't have access to buttons the operator wouldn't click.
Chen didn't drop the CLI, and he didn't ask every colleague to install the same set of plugins first. He simply stopped spending his most expensive twenty minutes deciding which console to open, or sorting out the local environment.
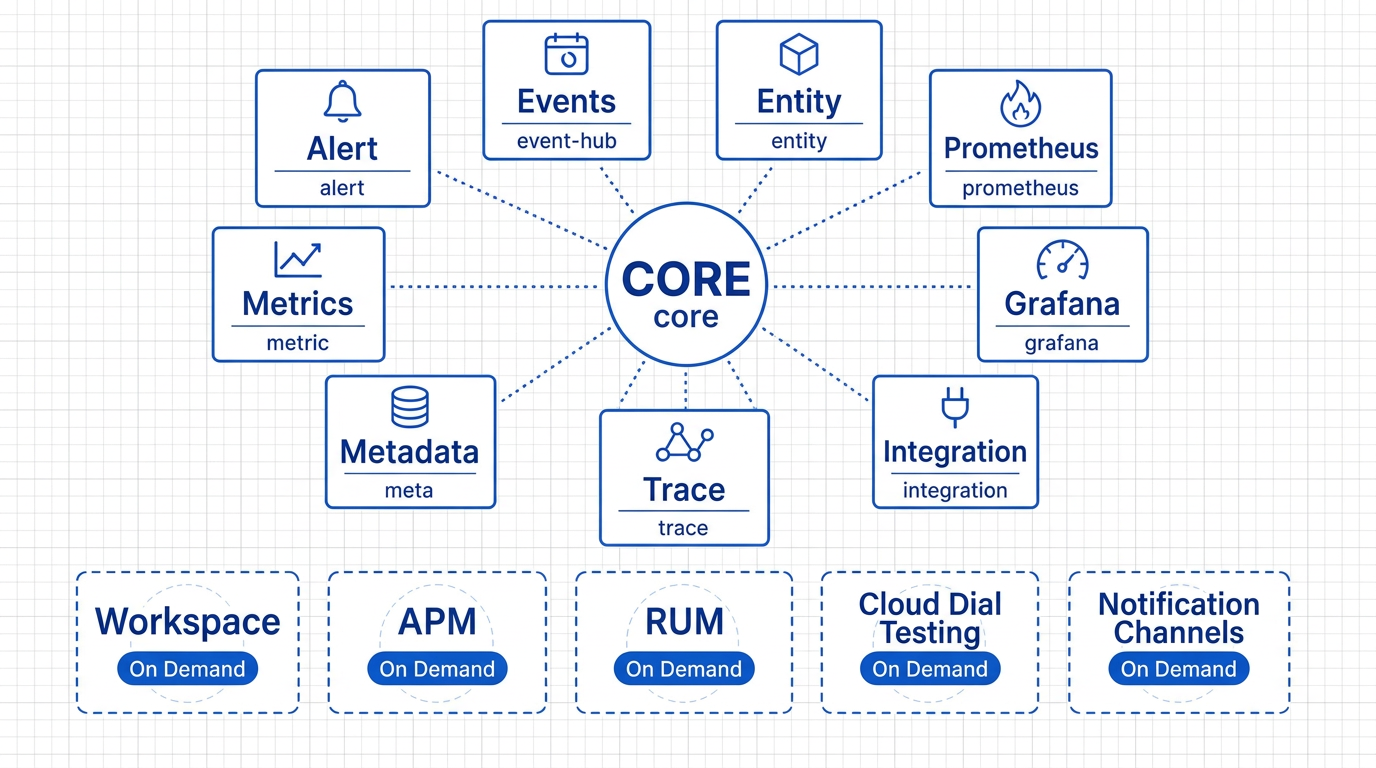
Once MCP maps the leaf commands onto tools, another problem shows up immediately: roughly 191 tools in total. Hand them all to the model at once and the tool descriptions eat the context window; clients also often cap the number of tools. More importantly, a single troubleshooting session has no need for capabilities like "delete workspace" or "create a synthetic monitoring task" sitting in the candidate list.
What a ToolSet mainly does is trim, by product domain, the tool surface the Agent can see and call on a given connection. It isn't a documentation index but a gate on the connection parameters: investigation opens only the core alias by default, build-out and high-risk operations are added to toolsets as needed, and omit_tools can strip out a specific delete-class tool. RAM still decides permissions; the ToolSet decides how wide the menu in front of the model is. That night, Chen went from alert to new rule entirely on the investigation surface. Loading all the tools at once would both crowd out reasoning space and widen the surface for mistaken calls.
The connection parameter defaults to core, which contains metric, meta, trace, alert, event-hub, integration, entity, prometheus, and grafana. Synthetic monitoring, application performance management (APM), workspace creation, and the like are not in the default set. Chen's path from alert to new rule maps exactly to this investigation surface.
| ToolSet | What it does during an investigation | Typical tools used that night |
|---|---|---|
alert |
Query alert history and rules; create, patch, enable, and disable rules |
alert_history_list, alert_rule_get, alert_rule_create, alert_rule_patch
|
metric |
PromQL instant and range queries; basic monitoring for ECS and other cloud services | metric_promql_query_range |
meta |
Metric names, units, dimensions, namespaces, and available regions |
meta_metrics, meta_namespaces
|
trace |
Search spans, run aggregate queries, and assemble a trace tree by trace ID | trace_search, trace_tree |
event-hub |
Query cloud service events and locate the event LogStore | event_hub_list |
entity |
Query services, instances, and dependencies; run entity health inspections | entity_query |
prometheus |
Prometheus instances, aggregate views, and pre-aggregation rules | prometheus_instance_get |
grafana |
Workspaces, data sources, dashboard search, and panel query extraction |
grafana_dashboard_search, grafana_dashboard_panel_queries
|
integration |
Integration policies, Addons, collectors, and scrape pre-checks | (Not used that night; relevant only when troubleshooting onboarding) |
The ToolSets outside core serve build-out and extension; you don't need to open them for every troubleshooting session:
workspace / datasource / umodel: workspaces, onboarding data sources, entity modelsapm / rum: application and frontend observability, instrumentation agent configuration, symbol filessynthetics: site monitoring and detection pointsnotification-channel: contacts, DingTalk/Lark/WeCom bots, and webhooksresource-watermark: resource usage reportsaliyun-service / tag / resource-group: activation status, tags, resource groupsListing the on-call group's bots falls under notification-channel, which isn't part of the default core. With only core open, creating a rule can still reuse the notification recipients from the original rule; to double-check the bot name, set the connection parameter to toolsets=core,notification-channel. Creating a workspace from scratch, onboarding data sources, installing an Addon, configuring APM, and creating synthetic monitoring tasks all work the same way — open the matching ToolSet, with no second protocol to learn.
CMS MCP uses the same fixed set of endpoints for all users; simply pick the China site or the international site based on your region. We recommend Streamable HTTP (paths ending in /mcp); use /sse only if your client supports nothing but the older server-sent events (SSE) transport.
China site
Streamable HTTP: https://openapi-mcp.cn-hangzhou.aliyuncs.com/s/Cms/cms/9fe79ff0bf5748e6923530c5097ec359/mcp
SSE: https://openapi-mcp.cn-hangzhou.aliyuncs.com/s/Cms/cms/9fe79ff0bf5748e6923530c5097ec359/sse
International site
Streamable HTTP: https://openapi-mcp.ap-southeast-1.aliyuncs.com/s/Cms/cms/9fe79ff0bf5748e6923530c5097ec359/mcp
SSE: https://openapi-mcp.ap-southeast-1.aliyuncs.com/s/Cms/cms/9fe79ff0bf5748e6923530c5097ec359/sse
For the default investigation surface, append ?toolsets=core to the URL. When you need to verify the on-call bot, use ?toolsets=core,notification-channel. Authentication uses client OAuth or your existing Alibaba Cloud identity; never place an AccessKey in a configuration file that is committed to Git.
Send the entire block below to Cursor, Claude Code, Lingma, or another Agent, and it will handle the setup for you.
Please add Alibaba Cloud CMS MCP to the current MCP client, without writing the AccessKey into the configuration file.
These are the official endpoints, which are fixed for all users. Pick one according to your network:
- China site Streamable HTTP (recommended): https://openapi-mcp.cn-hangzhou.aliyuncs.com/s/Cms/cms/9fe79ff0bf5748e6923530c5097ec359/mcp
- China site SSE: https://openapi-mcp.cn-hangzhou.aliyuncs.com/s/Cms/cms/9fe79ff0bf5748e6923530c5097ec359/sse
- International site Streamable HTTP (recommended): https://openapi-mcp.ap-southeast-1.aliyuncs.com/s/Cms/cms/9fe79ff0bf5748e6923530c5097ec359/mcp
- International site SSE: https://openapi-mcp.ap-southeast-1.aliyuncs.com/s/Cms/cms/9fe79ff0bf5748e6923530c5097ec359/sse
Requirements:
1. Prefer Streamable HTTP (/mcp); use SSE (/sse) only if the client does not support Streamable HTTP.
2. Use cms or aliyun-cms as the service name.
3. By default, append ?toolsets=core to the URL; to list alert bots, use ?toolsets=core,notification-channel.
4. Authenticate with OAuth or the existing Alibaba Cloud sign-in session on this machine; never write the AccessKey / Secret into mcp.json.
5. After configuring, call a read-only tool first: list workspaces, or query recent Critical alert history, to confirm connectivity.
For Cursor, write to ~/.cursor/mcp.json (China site sample):
{
  "mcpServers": {
    "aliyun-cms": {
      "url": "https://openapi-mcp.cn-hangzhou.aliyuncs.com/s/Cms/cms/9fe79ff0bf5748e6923530c5097ec359/mcp?toolsets=core"
    }
  }
}
Claude Code:
claude mcp add --transport http aliyun-cms "https://openapi-mcp.cn-hangzhou.aliyuncs.com/s/Cms/cms/9fe79ff0bf5748e6923530c5097ec359/mcp?toolsets=core"Write the following JSON into ~/.cursor/mcp.json or the project's .cursor/mcp.json. For the international site, replace the host with openapi-mcp.ap-southeast-1.aliyuncs.com.
{
  "mcpServers": {
    "aliyun-cms": {
      "url": "https://openapi-mcp.cn-hangzhou.aliyuncs.com/s/Cms/cms/9fe79ff0bf5748e6923530c5097ec359/mcp?toolsets=core"
    }
  }
}claude mcp add --transport http aliyun-cms \
"https://openapi-mcp.cn-hangzhou.aliyuncs.com/s/Cms/cms/9fe79ff0bf5748e6923530c5097ec359/mcp?toolsets=core"MCP suits teams that already run Cursor, Claude Code, or Lingma, or that plan to wire CMS into their own Agent. There's another, more immediate need: no client to install, no mcp.json to write, no local CLI environment to maintain — just open the console, investigate, run inspections, and get a conclusion.
CMS STAROps is built for these users: it provides a managed digital employee rather than one more toolbox you have to wire up yourself. The entry point is in the CMS 2.0 console: select a workspace, then open the artificial intelligence for IT operations (AIOps) assistant. Sessions, skills, permissions, and the execution environment all live in the cloud, and the CLI runs in a sandbox on the console side, so switching machines mid-shift doesn't start with another round of installation.
Three groups of capabilities work out of the box.
All three paths can coexist; choose by scenario. Keep using aliyun cms2 in terminals and pipelines. Connect a self-built Agent to CMS MCP. And if you'd rather not build one, use the managed digital employee in CMS STAROps for incident investigation and for inspection and diagnosis. The operating surface is still CMS 2.0; what changes is who owns the Agent.
After Chen posted the conclusion, the payments team took the diagnostic report and began investigating the channel latency, and the new monitoring rule took effect the very next minute. That's the work CMS MCP is built to support: not replacing the site reliability engineer (SRE), and not replacing the CLI, but letting an SRE's judgment land immediately on the real CMS operating surface. Let CMS MCP handle your everyday SRE work better: data collection, dashboard design, alert configuration, improving investigations, and inspection reports.
Apache RocketMQ's Evolution for AI: LiteTopic Powers Million-Scale Multi-Agent Session Collaboration
Teaching Agents to Decide: From JEV Integration to the Full Harness Decision Flow

798 posts | 60 followers
FollowAlibaba Cloud Native Community - October 19, 2026
Alibaba Cloud Native Community - August 14, 2026
Alibaba Cloud Native Community - June 23, 2026
OpenAnolis - April 20, 2026
Alibaba Cloud Native Community - October 26, 2026
Alibaba Cloud Native Community - August 25, 2026
798 posts | 60 followers
Follow CloudMonitor
Automate performance monitoring of all your web resources and applications in real-time
Learn More AgentCore
 unifies agent construction, governance, and execution capabilities so enterprises can deploy diverse agents with confidence.
Learn More Qwen
Full-range, open-source, multimodal, and multi-functional
Learn More Token Plan
Build more, spend less. One plan, every modality.
Learn MoreMore Posts by Alibaba Cloud Native Community

