By Ruiping Wan
In operating system (OS) operations and maintenance (O&M), the following issues are often encountered:
1. Wasted manpower in problem delimitation: When business issues arise, customers often assemble all relevant teams in troubleshooting without knowing whether the problem lies with the OS or the business itself, resulting in wasted manpower.
2. Excessive time in problem localization: When troubleshooting business issues through OS metrics, O&M personnel need to sift through a large number of indicators to find the specific cause, which wastes a lot of time.
3. Lost incident scene in problem investigation: When you start to troubleshoot the root cause of the problem, the best time is often missed, and the on-site information has been lost, making problem resolution more difficult.
To address the preceding issues, Alibaba Cloud has launched the one-stop O&M management platform, OS console, which provides a set of solutions for anomaly alerts and diagnostics linkage to intelligently detect abnormal metrics. System Operation & Maintenance (SysOM) is an O&M component of the Alibaba Cloud OS console. Once an abnormal event is detected, the anomaly alerting and diagnostic functions work in linkage: they automatically diagnose abnormal metrics, automate problem analysis, quantify the system health status in the form of a score, and output diagnostic conclusions. By doing so, underlying metrics are shielded from common users, cutting down their time and effort in independent analysis while boosting O&M efficiency.
In the case of abnormal business fluctuations, the health score can be used to determine whether the problem is at the OS level and identify the specific affected aspects. Once the problem is confirmed to stem from the OS, further checking the relevant alert information can clarify which key performance indicators are abnormal. Finally, through detailed analysis of the diagnostic report, we can accurately locate the root cause of the problem, so as to take targeted measures to fix it.
The OS console solves the three major problems faced by OS operations and maintenance through automatic anomaly detection and diagnosis, enabling even beginners to handle OS operations with ease.
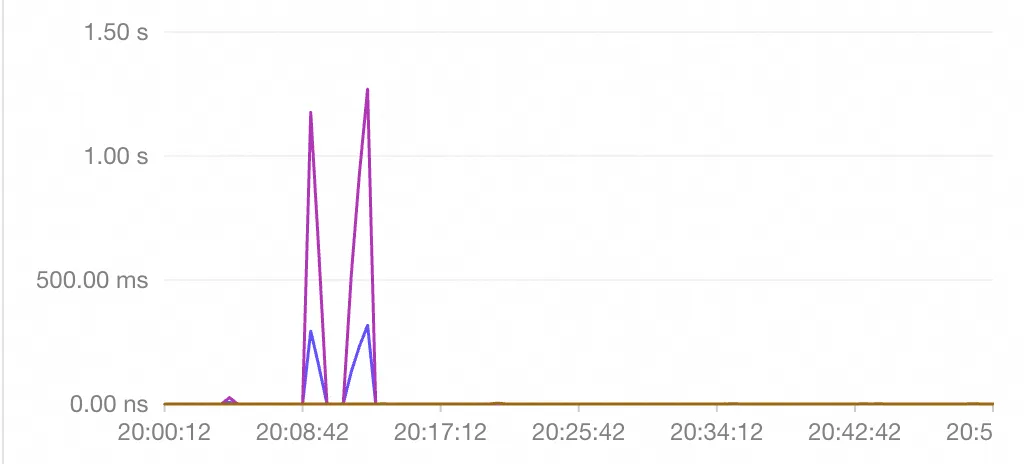
Recently, a user in the automotive industry reported intermittent scheduling jitter in their system. This exception disappears on its own within a short period, but this also makes it difficult to capture real-time call stack information at the moment when the problem occurs, which brings challenges to the root cause analysis and localization. Such transient faults not only increase the technical difficulty of troubleshooting, but also pose a potential threat to system stability and user experience.

User demand:
The Alibaba Cloud OS console precisely meets the user's needs. Therefore, at our suggestion, the user activated the Alibaba Cloud OS console. Once enabled, the OS console conducts round-the-clock monitoring and anomaly detection on various metrics prone to abnormalities. When a problem is detected, it immediately triggers an alert and reflects the issue in the score. The console classifies system metrics into four categories: Latency, load, Errors, and Saturation. This makes it easy to see which part of the system is malfunctioning.
When the issue recurred, the cluster score changed, with the latency-related score dropping.

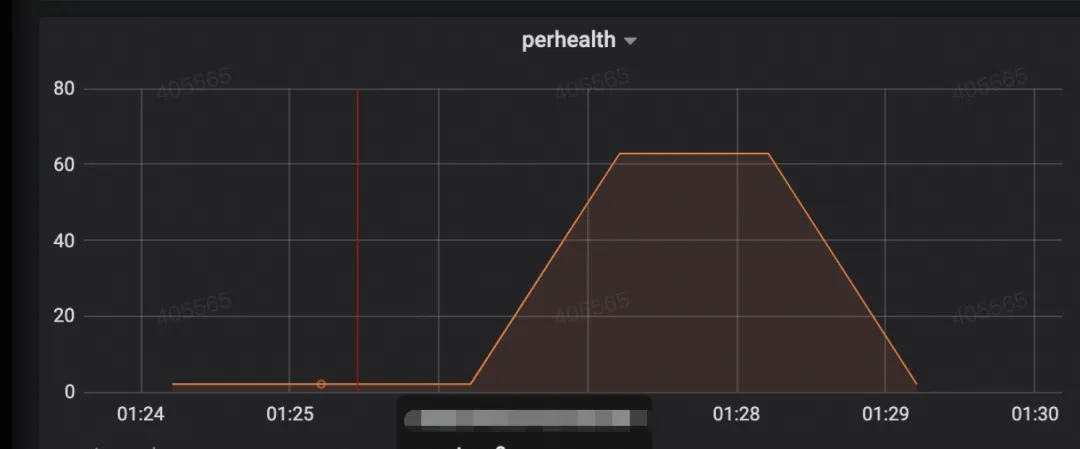
Because only one node in the cluster has a problem, the cluster score is not significantly reduced. It is clearer from the node score that the node has a large delay, which has a certain impact on the business.

The OS Console calculates the total score of computing instances and classifies them into three levels from large to small: Cluster, Node, and Pod. The health score of each level is calculated based on the scores of its internal inspection indicators and the comprehensive score of the upper level. Specifically, the OS console calculates scores of four types: Latency, Saturation, Load, and Errors. The score of each type is calculated from the score of the abnormal item of that type in the current level. Finally, the four scores will be aggregated to determine the total health score of the current level.
This multi-dimensional and multi-level evaluation method provides a more comprehensive reflection of the overall health of the system. It ensures timely detection and resolution of potential issues at different levels, so as to improve the stability and reliability of the system.
After the issue was detected, the console issued an alert and performed automatic diagnosis immediately. Thanks to the timely diagnosis, the problem scene was captured.


By analyzing the delay time, process information, and field stack provided in the diagnostic report, users quickly located the problematic application process and started further in-depth analysis in a targeted manner, finally solving the occasional scheduling jitter problem that had plagued users for a long time.
During the monitoring process, the user observed that the instance had an occasional network delay. However, when further investigation was conducted, the problem disappeared, and no more detailed information was obtained. Therefore, it is difficult to locate which process has what kind of abnormal situation.

This problem can also be solved through the combined use of alerts and diagnostics linkage of the OS console. At our suggestion, the user installed the OS console and waited for the problem to be reproduced.
When the problem recurred, the node score decreased. Based on the four types of scores, it was quickly determined that the cluster had a latency-related problem.

An alert appeared in the console, and automatic diagnostics were performed.


After receiving the alert, the user immediately checked the diagnosis report. Through the report, the user quickly located the business process with problems, began to continue analysis in a targeted manner, and finally solved the problem of occasional network jitter.
Based on the above two cases, it can be seen that the OS console is particularly useful for occasional jitter, latency, and other issues. These problems occur at an uncertain time and have a certain impact on the business. However, these problems last for a short time, with the incident scene disappearing quickly. If the O&M personnel cannot find the root cause within a short period, it is difficult to continue in-depth analysis.
The OS console collects key metrics of the system in multiple dimensions and automatically monitors them around the clock. Once a problem is detected, it will be delivered to the outside as soon as possible, and automated diagnostics are performed to preserve as much on-site information as possible. The OS console also provides a root cause analysis conclusion, supplying sufficient evidence for O&M personnel to locate the issue.
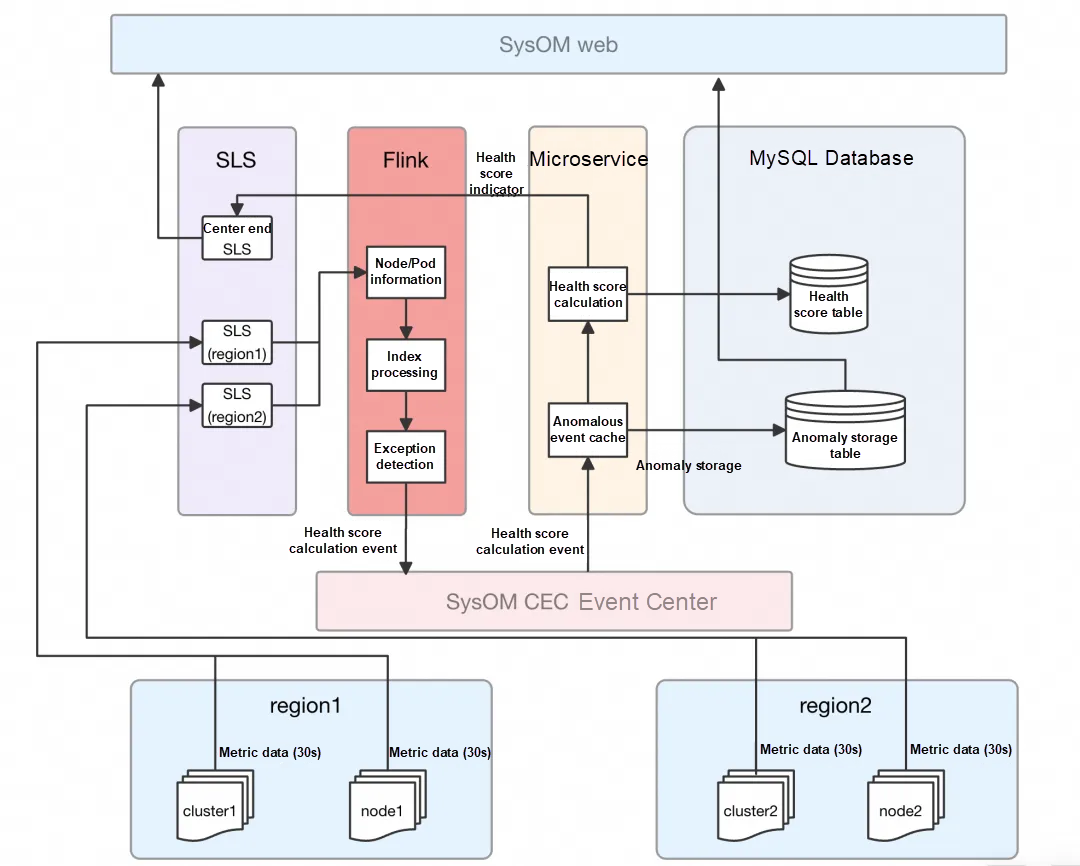
In the implementation process, the OS console adopts the implementation solution of Flink + microservices, which uses the advantages of microservice modularity to ensure that multiple microservices do not interfere with each other and improve the stability of the system. It also leverages the advantages of Flink for stream data processing to improve the efficiency of anomaly detection.

During alert delivery, the OS console takes into account the possible alert fatigue problem that may occur when alerts are sent. To optimize alert management and improve user experience, the OS console provides the following solutions:
1. Alert aggregation and duration display: The system automatically merges similar alert events that are triggered in the same period and clearly indicates the duration of the exception in the alert notification.
2. User-defined attention level interface: A configurable attention adjustment interface is provided, allowing end-users to flexibly set the attention levels for different types of alert events according to their own needs and business scenarios. In this way, diversified O&M requirements can be better met.
3. Intelligent alert suppression prompt mechanism: When detecting that a certain type of unanswered alerts frequently occur in a short period, the system will proactively remind users, advising them to consider whether to reduce their attention to such events or ignore them completely. If the user chooses to perform the corresponding operation, the occurrence frequency of similar alerts in the future will be adjusted according to the newly set rule, so as to effectively avoid unnecessary interference.
4. Automated root cause analysis and immediate feedback: When a new alert is generated, the system immediately starts the built-in diagnostic process to quickly locate the fault source and update the detailed fault cause analysis results to the alert details in real time.


Intelligent monitoring faces issues such as excessive indicators, difficulty in understanding, reliance on expert experience, and challenges in post-incident troubleshooting. AIOps analyzes operational data through machine learning algorithms to optimize system stability and resource utilization efficiency. SysOM provides a dual-module anomaly detection algorithm for several types of indicators, including Latency, load, Errors, and Saturation. It also provides custom configuration interfaces to meet individual requirements.
In the future, the OS console will be committed to exploring the potential of anomaly detection in depth. By continuously optimizing detection algorithms and improving the anomaly detection architecture, the OS console aims to provide users with a more excellent service experience. We will focus on enhancing the intelligence level of the system and adopt advanced technologies of machine learning and artificial intelligence. By doing so, we will ensure that abnormal situations can be accurately identified and responded to in real time and significantly improve the stability and security of the system. In addition, we will continue to improve the exception handling mechanism to ensure that it can adapt to the increasingly complex system environment and create a more secure and reliable OS for users.
In the future, the OS console will integrate with various alert platforms to reach O&M personnel through more diverse channels.
How the Alibaba Cloud OS Console Tackles Network Packet Loss in One Move
These O&M Challenges: How Alibaba Cloud OS Console Solves Them in One Stop

102 posts | 6 followers
FollowAlibaba Cloud Community - January 4, 2026
OpenAnolis - February 2, 2026
OpenAnolis - January 21, 2025
OpenAnolis - March 4, 2026
OpenAnolis - September 4, 2025
OpenAnolis - September 4, 2025

102 posts | 6 followers
Follow Alibaba Cloud Linux
Alibaba Cloud Linux is a free-to-use, native operating system that provides a stable, reliable, and high-performance environment for your applications.
Learn More Container Service for Kubernetes
Alibaba Cloud Container Service for Kubernetes is a fully managed cloud container management service that supports native Kubernetes and integrates with other Alibaba Cloud products.
Learn More Apsara Stack
Apsara Stack is a full-stack cloud solution created by Alibaba Cloud for medium- and large-size enterprise-class customers.
Learn More ACK One
Provides a control plane to allow users to manage Kubernetes clusters that run based on different infrastructure resources
Learn MoreMore Posts by OpenAnolis