By Xiao Zhenwei

As cloud infrastructure continues to scale, data types such as AI training datasets, real-time logs, and multimedia content are growing exponentially, making cloud storage the de facto standard. This growth has also caused a sharp increase in I/O requests. In multi-tenant cloud environments, multiple tenants share the same underlying storage resources. High-concurrency access can easily lead to I/O resource contention, resulting in performance bottlenecks. Moreover, the widespread adoption of hybrid and multi-cloud architectures causes frequent data transfer across different cloud platforms. Varying storage strategies and monitoring systems further complicate the troubleshooting of I/O issues. To improve troubleshooting efficiency, the Alibaba Cloud Operating System Console focuses on high-frequency I/O anomaly scenarios and provides one-click I/O diagnostics that cover the full lifecycle from anomaly detection and root cause analysis to actionable remediation suggestions.
Users often lack the ability to distinguish between different types of I/O anomalies, such as determining whether an issue is caused by high I/O latency or by saturated I/O throughput. Without this capability, they cannot proactively use appropriate diagnostics tools and must rely on O&M engineers to step in, resulting in inefficient diagnostics workflows and higher labor costs. The one-click I/O diagnostics feature focuses on high-frequency issues such as high I/O latency, abnormal I/O traffic, and high iowait. It detects anomalies in the I/O subsystem and helps users automatically and quickly determine the issue type.
Traditional monitoring systems primarily rely on OS-level I/O metrics such as await, util, tps, and bps, and use metric spikes as the basis for alerts. However, by the time these metrics show abnormalities, the critical window for capturing detailed diagnostics information may have already passed, making it impossible to collect fine-grained, issue-specific evidence needed for root cause analysis. Being able to detect anomalies quickly and take immediate action is therefore essential for preserving the best opportunity to capture valuable diagnostics data.
Current monitoring systems often suffer from "data silos," where metrics exist independently and lack a clear and intuitive mapping to specific I/O issue types. For example, when the util metric (disk device busy ratio) is high, monitoring systems must also check metrics such as await and compare them with the theoretical limits of disk IOPS and throughput to form a comprehensive judgment. Even after the issue type is identified, monitoring systems still need prior knowledge of how to use various diagnostics tools and determine appropriate parameters based on metric values. SysOM’s one-click I/O diagnostics abstracts away these complex correlations and directly provides an analysis report.
The SysOM component in the Alibaba Cloud Operating System Console already supports diagnostics for common I/O issues such as high I/O latency, abnormal I/O traffic, and high iowait. However, customers rarely permit diagnostics tools to run continuously on production machines to capture data. The one-click I/O diagnostics feature is designed to operate within a defined diagnostics window. It periodically samples I/O monitoring metrics to detect anomalies, narrows down the scope of the issue, and then triggers sub-diagnostics tools to produce a report, forming a closed loop of issue detection, diagnostics, and root cause analysis.
Because metric thresholds vary across different business scenarios, applying a single static threshold may produce false alerts or missed anomalies. Therefore, the one-click I/O diagnostics feature uses dynamic thresholds to identify anomalies. The following figure shows the overall architecture.
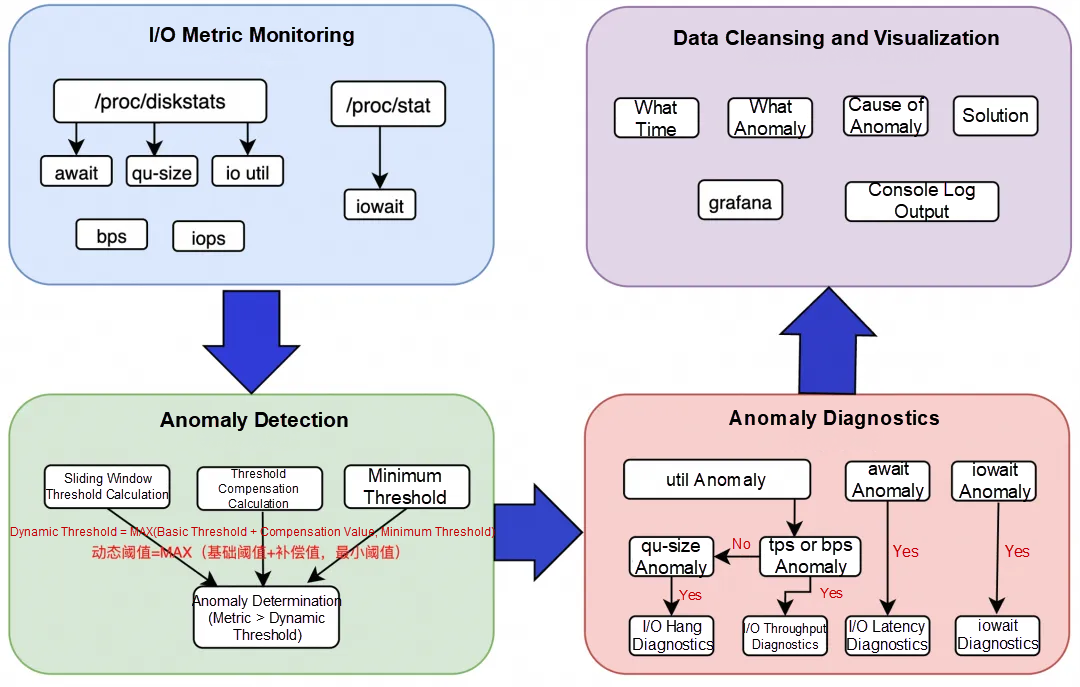
I/O metric monitoring: collects key I/O metrics from the system, such as await, util, tps, iops, qu-size, and iowait.
Anomaly detection: detects anomalies. When the collected I/O metrics exceed their dynamic thresholds, anomalies are identified. The core of anomaly detection lies in calculating these dynamic thresholds, which will be explained in detail later.
Anomaly diagnostics: triggers the corresponding diagnostics tool based on the specific metric anomaly detected, while keeping limits on the trigger frequency.
Data cleansing and visualization: processes and visualizes diagnostics results to provide clear root cause explanations and actionable suggestions.
When one-click diagnostics is triggered, the system periodically (with the cycle configurable in milliseconds) collects key I/O metrics and calculates their values, including iowait, iops, bps, qu-size, await, and util, and then checks them for anomalies.
To detect I/O anomalies within seconds after they occur, the system aggregates isolated I/O metrics to capture issues such as I/O bursts. The core of this process is the dynamic threshold calculation, which consists of three steps: calculating a basic threshold, a compensation threshold, and a minimum threshold.
I/O metrics are essentially time-series data. In most cases, the system remains in a normal state throughout a given time window. As a result, the metric curve typically stays stable. When an anomaly occurs, it manifests as a sharp spike that deviates significantly from this stable trend. Therefore, the first step is to use the basic threshold calculated in this section to filter out these spikes in the I/O metric series.
We continuously observe the data through a sliding window and calculate the maximum deviation from the mean within each window as the "instantaneous fluctuation value." The average of these instantaneous fluctuation values is then taken as the basic threshold. This threshold is continuously updated in an adaptive manner to reflect the latest fluctuation characteristics of the data.
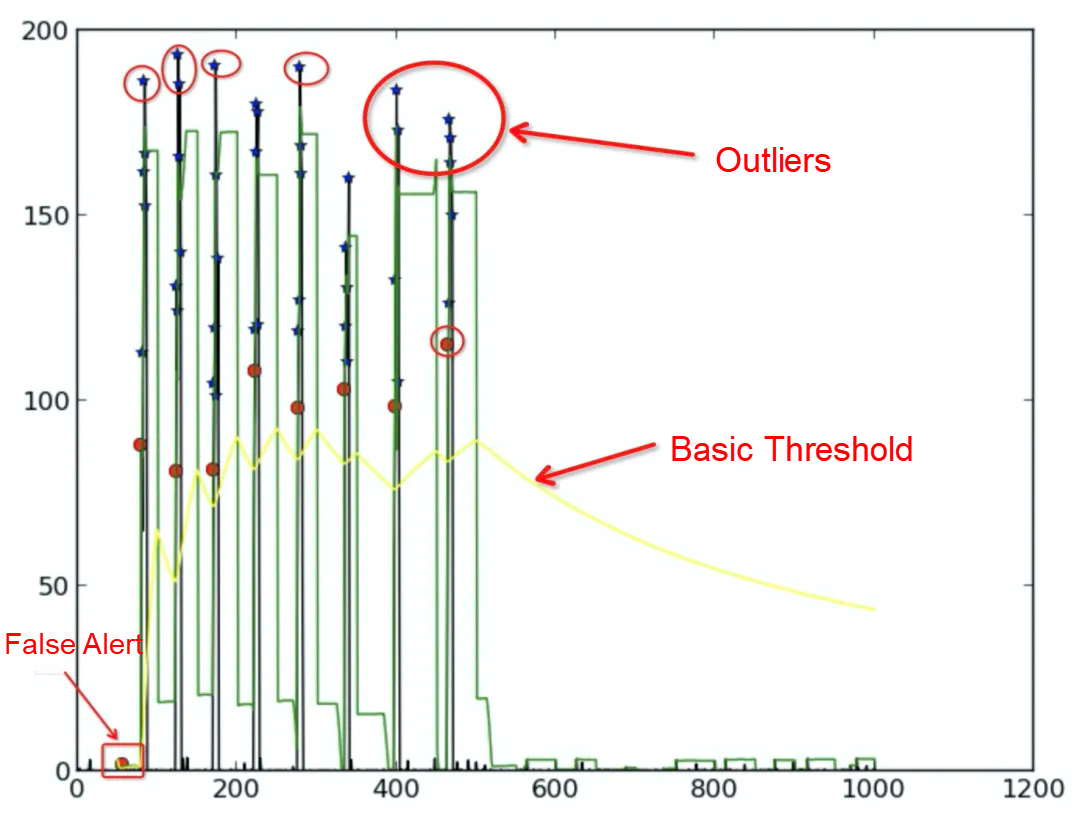
The basic threshold curve (illustrated as the yellow line) reflects the actual fluctuations of the I/O metric. However, when the system is stable, I/O metrics usually oscillate within a limited range. To avoid excessive sensitivity and reduce false alerts, we calculate a compensation threshold and add it to the basic threshold. This prevents the basic threshold from dropping too quickly and thereby filters out false alerts.
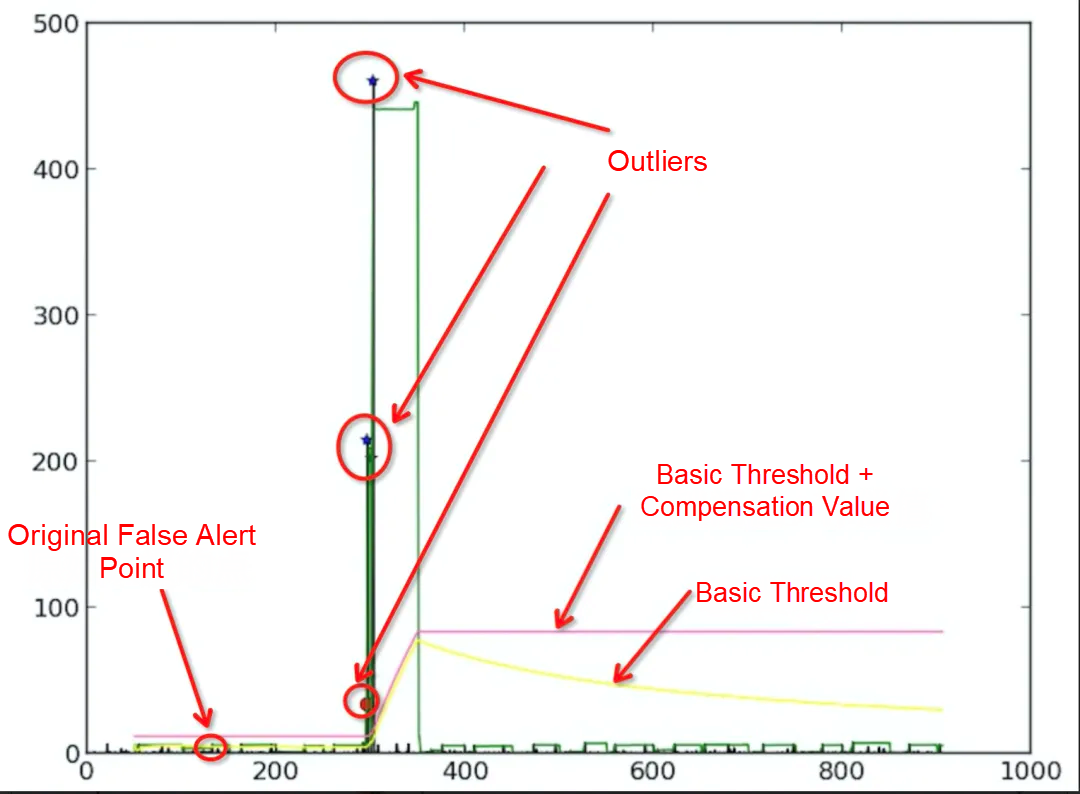
When the basic threshold continuously declines for a period, we consider the system to have entered a "steady-state" mode. Then, we filter out obvious noise and calculate a steady-state compensation value from the remaining "quiet" data to represent small fluctuations under stability. Before this steady-state compensation value is formally established, we temporarily use the maximum basic threshold observed within the current window as the compensation value, and reset it at the start of each new window. If the basic threshold stops falling or rebounds, the mechanism resets and returns to a macro (coarser) observation mode.
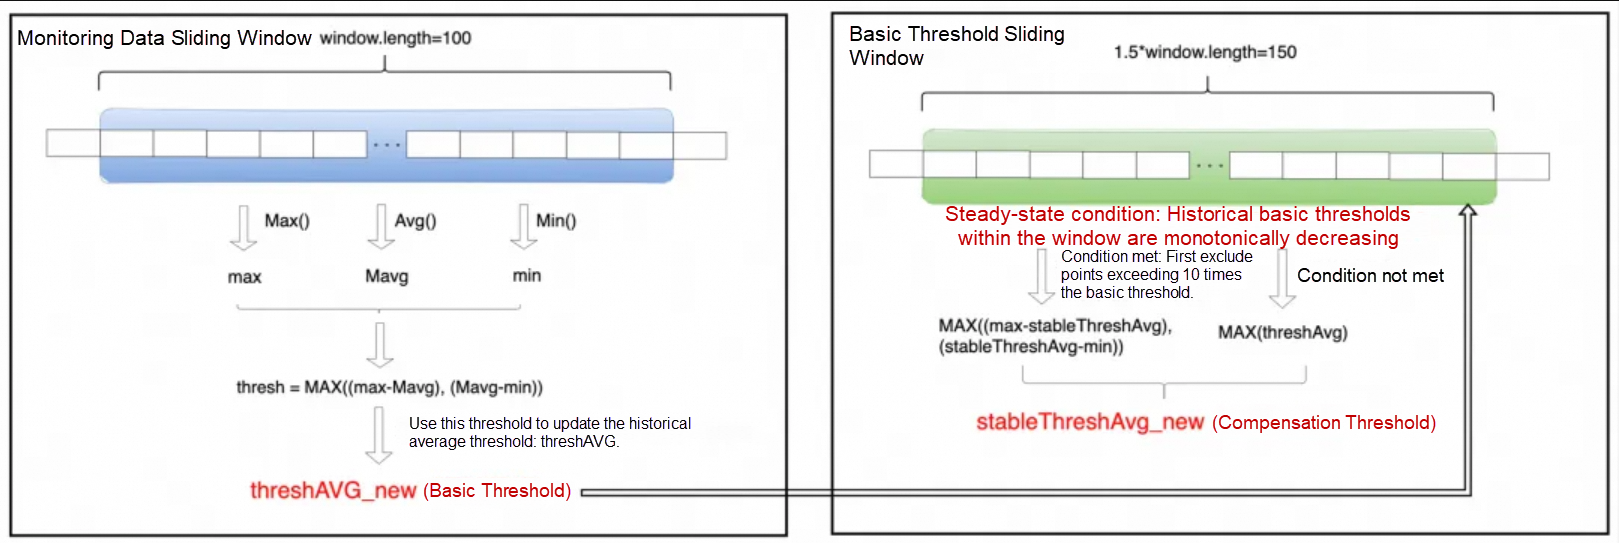
The minimum static threshold is a predefined lower bound. The final anomaly threshold is defined as the greater of the minimum static threshold and the dynamically adjusted threshold (basic threshold + compensation value). This ensures that only values exceeding both the business tolerance boundary and the system's expected dynamic fluctuation range are considered anomalous.
Importantly, if a metric already exceeds the minimum static threshold, the dynamically adjusted threshold calculation is simplified: The steady-state compensation value is ignored, and the basic threshold alone is used for detection, thereby concentrating on more pronounced anomalies.
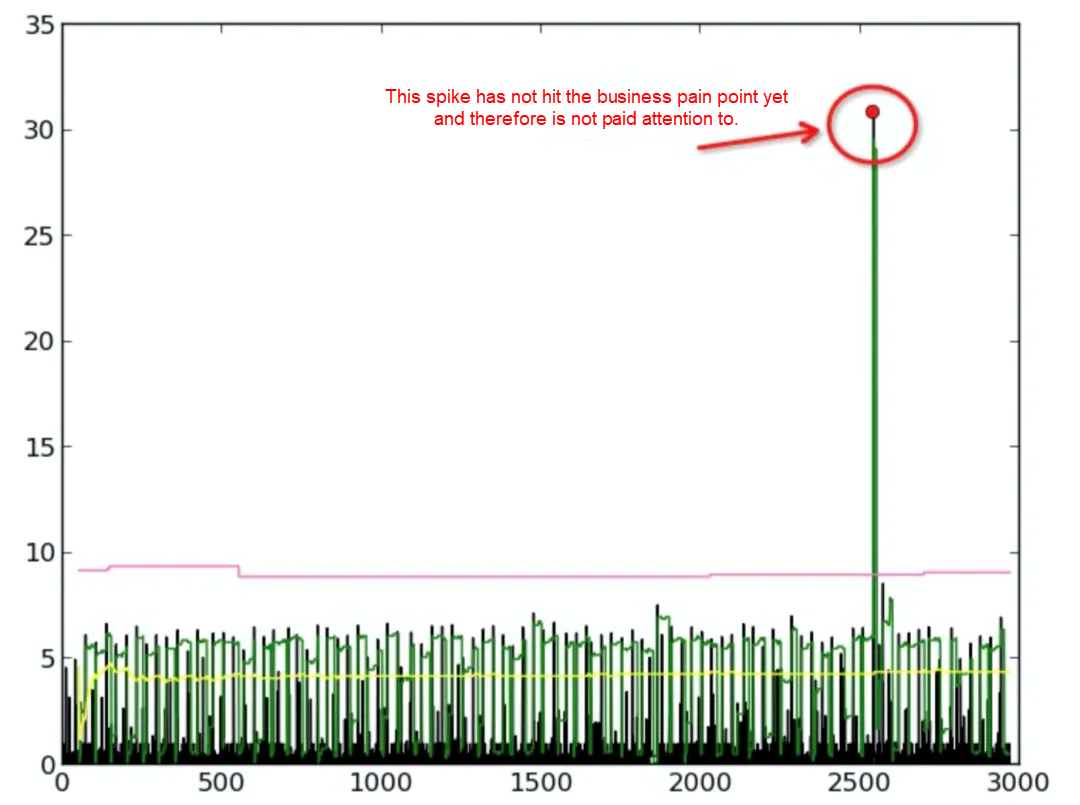
An anomaly is identified when a collected I/O metric exceeds the dynamic threshold. Although each anomaly type applies its own detection logic, all follow the following principles:
• Alert threshold determination: Establish an alert line by taking the greater of the minimum static threshold (the lowest tolerance boundary defined by the business) and the dynamic threshold (the system-calculated range that represents normal fluctuations).
• Trigger diagnostics: If the current metric value exceeds this alert line and all monitoring and diagnostics conditions are met, the system immediately initiates a diagnostics action.
• Dynamic learning: The system continuously updates the dynamic threshold based on newly collected metric data, ensuring that it always reflects the most up-to-date normal fluctuation pattern.
When an I/O anomaly is detected, the one-click diagnostics tool automatically invokes diagnostics modules to capture and analyze key information in real time, enabling fast issue identification. To avoid overly frequent diagnostics, the system applies the following controls:
• "Cooldown period" (triggerInterval): defines the minimum allowable interval between two diagnostics actions, ensuring that the system does not repeatedly diagnose issues within a short period.
• "Anomaly counter" (reportInterval): regulates the criteria for initiating diagnostics actions. If the value is set to 0, diagnostics actions are triggered whenever an anomaly occurs and the cooldown period has elapsed. Otherwise, diagnostics actions are triggered only if sufficient anomaly events accumulate within the specified time window after the cooldown period.
After diagnostics data is captured, determining where to start and how to identify relevant clues among numerous data points can be challenging. Focused, structured analysis is therefore essential. The one-click I/O diagnostics tool provides this capability by distilling the information and reporting concise, issue-relevant conclusions:
• For I/O burst anomalies, the tool reports the processes that contributed the most I/O during the anomaly window. Uniquely, it can also identify cases where a process generates buffer I/O writes that are later flushed by kworker, and correctly attribute the I/O source.
• For high I/O latency anomalies, the tool reports the latency distribution recorded during the anomaly window and identifies the path with the highest latency.
• For high iowait anomalies, the tool reports the processes responsible for high iowait and the underlying factors that triggered the high wait time.
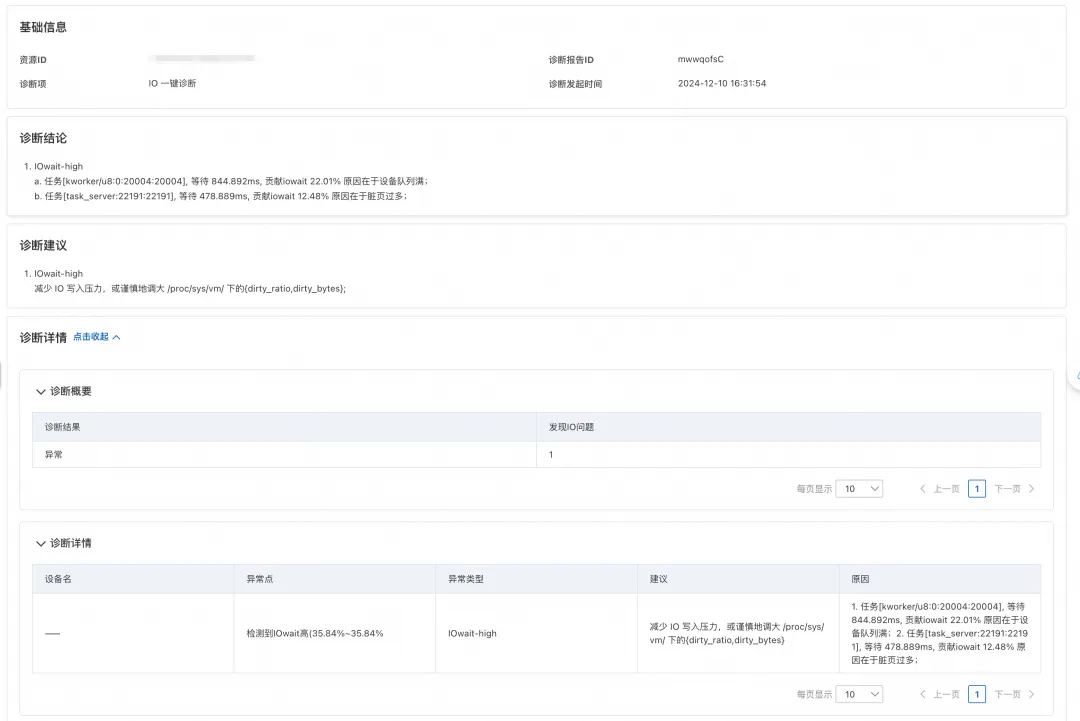
For scenarios involving high iowait, one-click I/O diagnostics can directly pinpoint which processes are waiting for disk I/O and the duration of their wait, enabling the clear identification of the blocking cause. As shown in the following figure, the tool diagnosed that the business workload was generating excessive I/O pressure, leading to a large number of dirty pages. As a result, the task_server process experienced prolonged I/O wait time. Based on this finding, the report suggests cautiously tuning the dirty_ratio and dirty_bytes parameters to reduce flushing pressure and help alleviate I/O load.
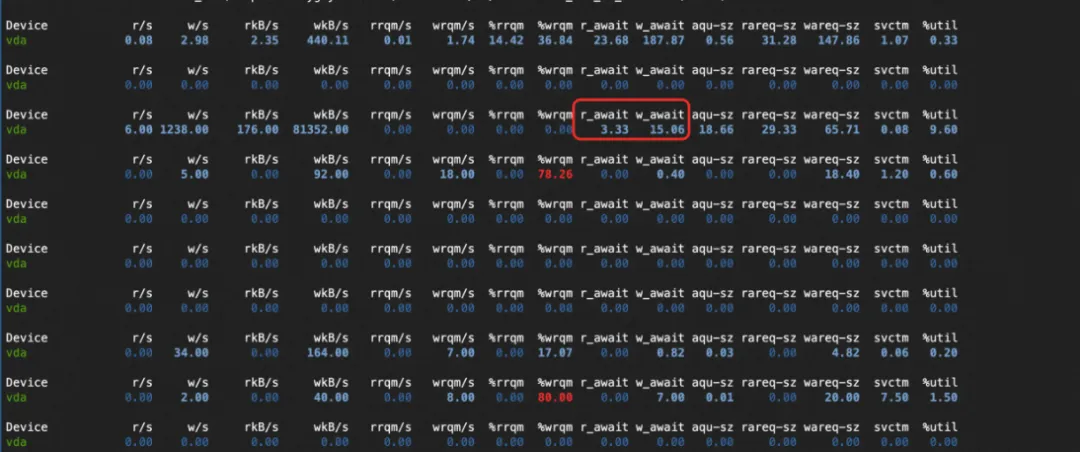
A user observed abnormally high write latency on their machine from monitoring data, and was recommended to use one-click I/O diagnostics for root cause analysis.
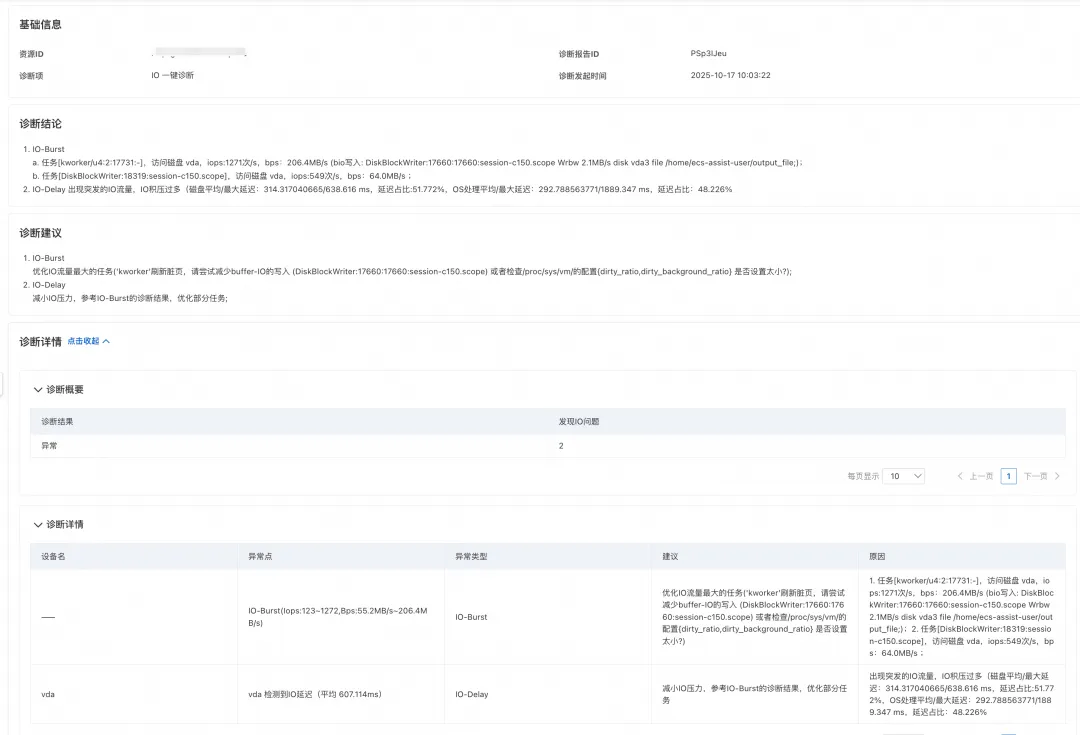
The results returned showed that the DiskBlockWrite process was generating significant I/O pressure, with most of the latency occurring during disk flushing. This helped the user pinpoint the underlying cause of the high latency. Accordingly, the report recommends reducing buffer I/O writes or adjusting parameters such as dirty_ratio and dirty_background_ratio to mitigate the latency issue.
Alibaba Cloud Operating System Console (URL for PCs): https://alinux.console.aliyun.com/
These O&M Challenges: How Alibaba Cloud OS Console Solves Them in One Stop
Java Memory Diagnostics Available in Alibaba Cloud OS Console

102 posts | 6 followers
FollowApache Flink Community - August 1, 2025
ApsaraDB - February 4, 2026
Alibaba Cloud Indonesia - March 20, 2026
OpenAnolis - March 4, 2026
Alibaba Container Service - January 15, 2026
Xi Ning Wang(王夕宁) - July 21, 2023

102 posts | 6 followers
Follow Bastionhost
A unified, efficient, and secure platform that provides cloud-based O&M, access control, and operation audit.
Learn More Managed Service for Grafana
Managed Service for Grafana displays a large amount of data in real time to provide an overview of business and O&M monitoring.
Learn More Alibaba Cloud Linux
Alibaba Cloud Linux is a free-to-use, native operating system that provides a stable, reliable, and high-performance environment for your applications.
Learn More ChatAPP
Reach global users more accurately and efficiently via IM Channel
Learn MoreMore Posts by OpenAnolis