
ChaosBlade is an open-source experimental injection tool from Alibaba that follows the principles of chaos engineering and chaos experiment models. It helps enterprises improve the fault tolerance of distributed systems and ensures business continuity during enterprise cloud migration or cloud-native system migration.
It supports scenarios like basic resources, Java applications, C++ applications, Docker containers, and Kubernetes platforms. This project encapsulates the scene into separate projects according to the domain implementation, which enables the standardized implementation of the scene in the domain and facilitates the horizontal and vertical expansion of the scene. The unified call of ChaosBlade cli can be realized by following the chaos experiment model.
Currently, there are some performance problems in fault injection under Java scenarios. These problems are mainly reflected in the significant jitter of CPU usage rate during fault injection. The CPU usage rate may reach 100% in severe cases. This situation does not impact offline services too much, but it has a serious negative impact on online services because a high CPU usage rate may lead to poor overall performance of services and affect the time consumption of interfaces.
Optimizing the performance of the ChaosBlade in Java scenarios will control the jitter of the CPU usage rate during fault injection, and the 100% CPU usage rate will no longer occur. We made a test where the fault of Dubbo custom exception throwing is injected into online service instances of 8C, 4G, and QPS 3K. The CPU usage rate can be controlled within the instantaneous jitter range of about 40%, and the overall performance is improved by nearly 2.5 times.
This article will introduce the problems that affect performance in detail and how to optimize these problems.
Before the introduction, let's learn about the fault injection process of ChaosBlade in Java scenarios:

The fault injection under the Java scenario is implemented based on the bytecode enhancement framework JVM-Sandbox. Injecting one fault is divided into two steps:
Simulate a simple HTTP service locally and control its CPU Idle to be around 50%. When an agent is attached through the command executed-blade prepare jvm --pid, the CPU idle rate drops rapidly and significantly. Fault injection in the production environment may directly lead to CPU idle rate drop and trigger alerts.

Collect the CPU profile to generate a flame graph to observe the CPU usage when the blade prepare is executed. The following figure shows that the loadPlugins method consumes the most resources:
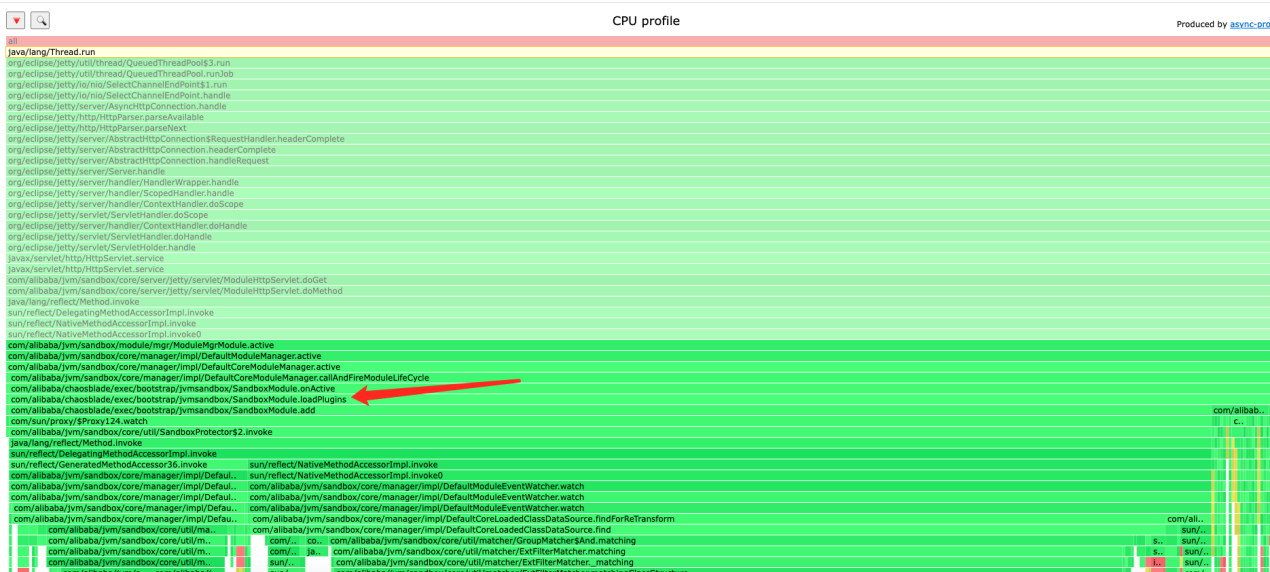
The loadPlugins method is used to load all plug-ins supported by ChaosBlade in Java scenarios, such as Dubbo, Redis, and Kafka. When these plug-ins are loaded, fault injection can be performed. The classes and methods defined in the plug-in are enhanced in bytecode during the loading of plug-ins.

The problem that causes high CPU consumption is that it takes a lot of time to load all plug-ins. In comparison, we will select one specific plug-in to do fault injection, but full loading is not the optimal solution.
Here is an optimization idea. Since a specific plug-in will be loaded when doing fault injection, you can solve the problem of high CPU consumption with the load on demand. We load the plug-in to where we want to do fault injection. The granularity of plug-in loading becomes smaller, and the CPU consumption is naturally lower.

Core code:
Load on demand is performed by loading the specified plug-in during the fault injection:
private void lazyLoadPlugin(ModelSpec modelSpec, Model model) throws ExperimentException {
    PluginLifecycleListener listener = ManagerFactory.getListenerManager().getPluginLifecycleListener();
    if (listener == null) {
        throw new ExperimentException("can get plugin listener");
}
    PluginBeans pluginBeans = ManagerFactory.getPluginManager().getPlugins(modelSpec.getTarget());
if (pluginBeans == null) {
        throw new ExperimentException("can get plugin bean");    }
    if (pluginBeans.isLoad()) {
        return;    }
    listener.add(pluginBean);
    ManagerFactory.getPluginManager().setLoad(pluginBeans, modelSpec.getTarget());
}
Detailed code PR: https://github.com/ChaosBlade-io/ChaosBlade-exec-jvm/pull/233
The decline rate of the CPU Idle decreases:

CPU usage rate in the flame graph almost disappears:
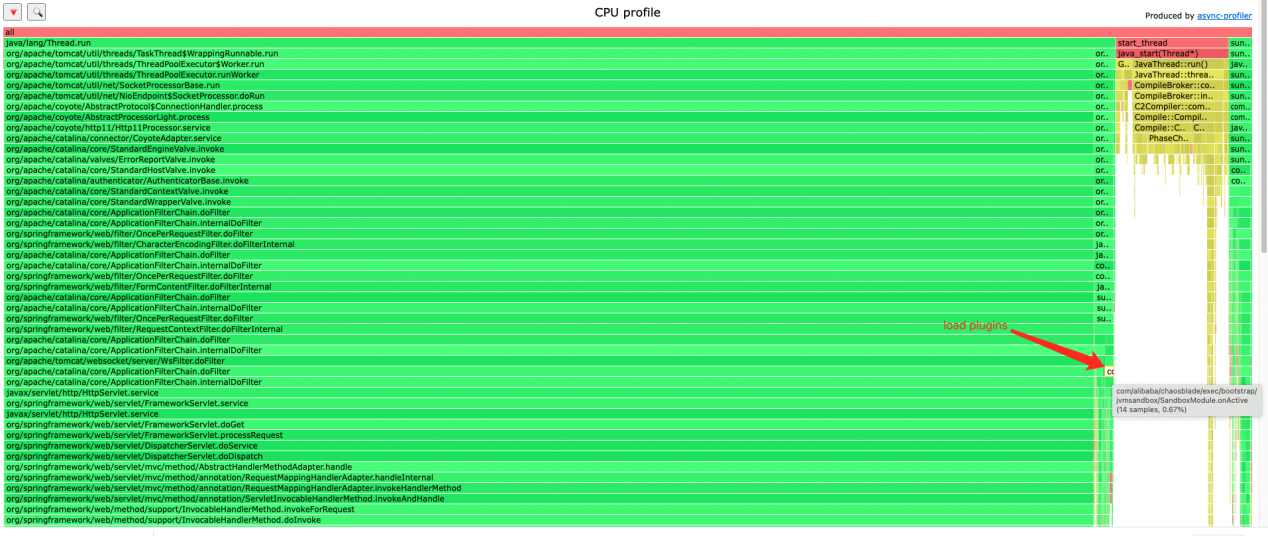
The fault injection causes the CPU Idle to fall to the bottom frequently. The duration of the lowest CPU Idle rate is relatively short, around 20 seconds. Sometimes the CPU Idle falling to the bottom is related to the business code of the target service or the JVM parameter setting of the target service. This article only introduces the problem of CPU Idle falling to the bottom caused by ChaosBlade directly or indirectly.

CPU Idle Falling to Bottom: It means the CPU idle rate is reduced to 0, which also means the CPU usage rate has reached 100%.
ChaosBlade allows you to do fault injection (like exception throwing) to a Dubbo provider or consumer. If a service is both a provider and a consumer, a bug is triggered if we do fault injection to the provider. This may cause the CPU Idle to fall to the bottom.
Normal Situation: If a service is both a provider and a consumer, its request processing process says the traffic first enters the provider, the traffic is handed over to the business logic to execute after processing, and finally, the request is forwarded through the consumer.

Fault Injection to Consumer: When ChaosBlade is used to do fault injection to the consumer, an exception is thrown when the traffic arrives at the consumer. The traffic will not be forwarded out, which achieves the effect of the simulated occurrence of a fault.

Fault Injection to Provider: When ChaosBlade is used to do fault injection to the provider, an exception is thrown when the traffic arrives at the provider, and the traffic will not be forwarded down.

The diagram above shows the expected effect. When ChaosBlade is used to do fault injection to the provider or consumer, both the provider and the consumer are injected with faults at the same time. This may cause additional resource waste.

Cause: The bytecode enhancement logic of ChaosBlade is based on the granularity of the plug-in. For example, Dubbo is a plug-in. However, plug-ins (such as Dubbo and Kafka) that support fault injection to both the provider and consumer will inject faults into both the provider and consumer.
When loading plug-ins, load on demand according to the specific plug-in name. For example, execute the command:
./blade create dubbo throwCustomException --provider --exception Java.lang.Exception --service org.apache.dubbo.UserProvider --methodname GetUser This means if you want to do fault injection to a Dubbo provider, you only need to load the provider plug-in for bytecode enhancement.
Modified core code:
private void lazyLoadPlugin(ModelSpec modelSpec, Model model) throws ExperimentException {
        // ...... Omitted
        for (PluginBean pluginBean : pluginBeans.getPluginBeans()) {
            String flag = model.getMatcher().get(pluginBean.getName());
            if ("true".equalsIgnoreCase(flag)) {
                listener.add(pluginBean);
                break;
            }
            listener.add(pluginBean);
        }
       // ...... Omitted
    }
}
Related PR: https://github.com/ChaosBlade-io/ChaosBlade-exec-jvm/pull/267
When using ChaosBlade to inject a fault of the custom script, the CPU Idle falls to the bottom. The custom script is a method supported in ChaosBlade JVM failure, which means users can write any piece of Java code and inject this piece of code into the corresponding target class and method. It is very flexible, and many things can be done with ChaosBlade's custom script to inject faults.
ChaosBlade Command:
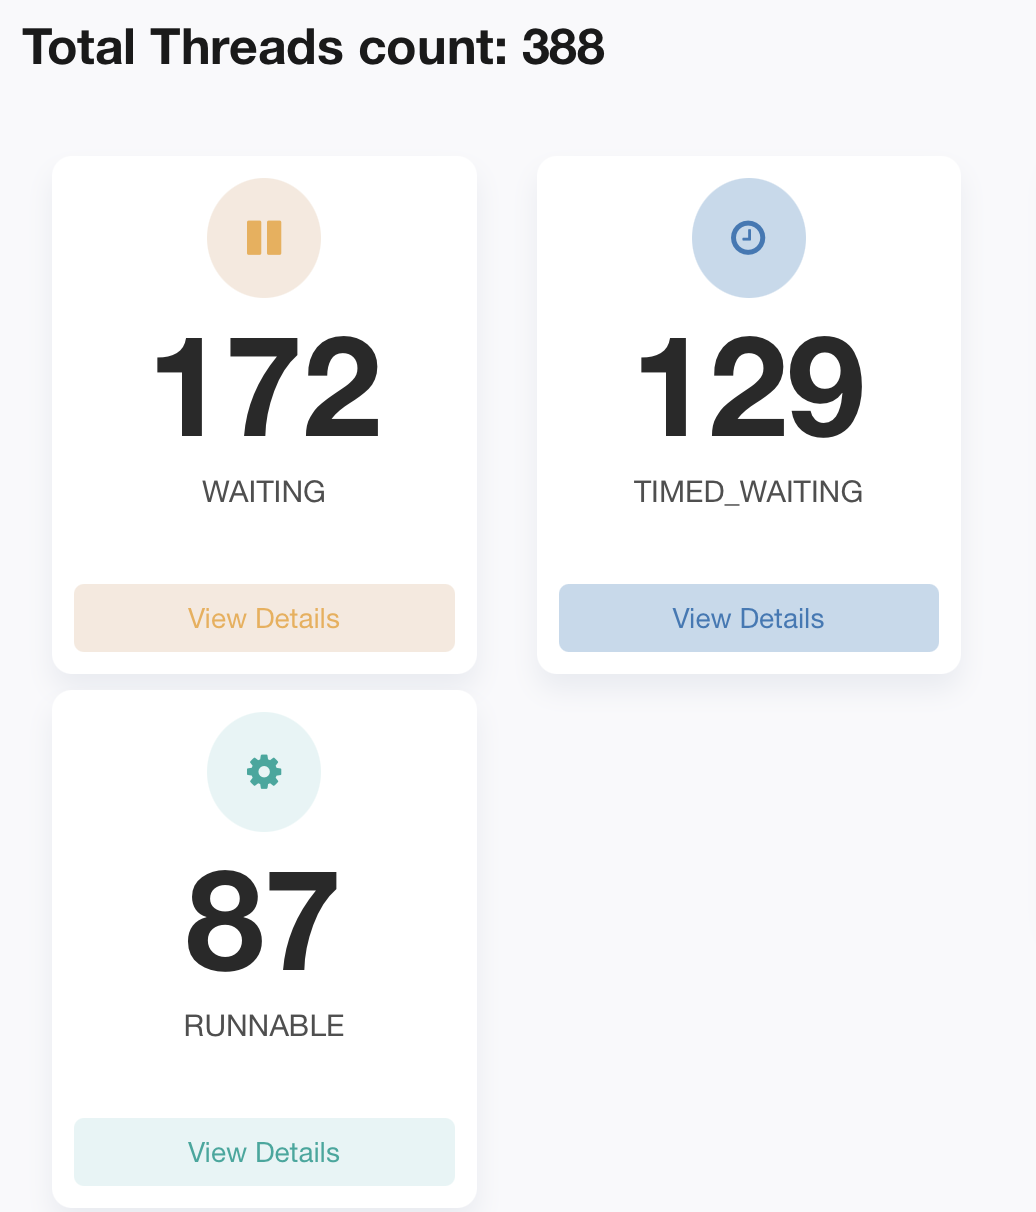
./blade c jvm script --classname com.example.xxx.HelloController --methodname Hello --script-content .....We captured the flame graph and the jstack log during fault injection and found some problems through the thread stack printed by jstack.
Before fault injection:
After fault injection:
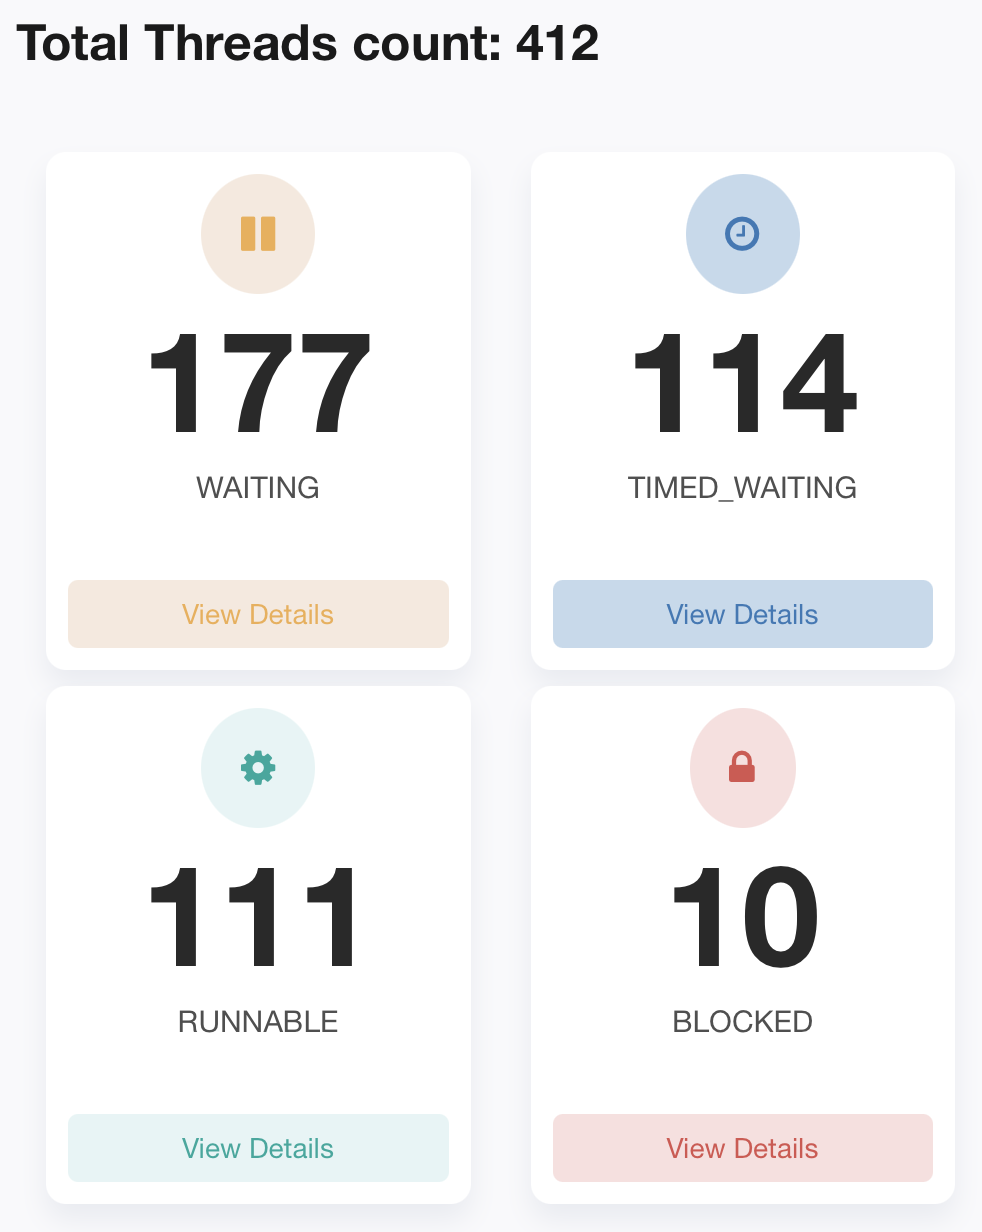
BLOCKED Thread Stack:
Stack Trace is:
Java.lang.Thread.State: RUNNABLE
at Java.util.zip.ZipFile.getEntryTime(Native Method)
at Java.util.zip.ZipFile.getZipEntry(ZipFile.Java:586)
at Java.util.zip.ZipFile.access$900(ZipFile.Java:60)
at Java.util.zip.ZipFile$ZipEntryIterator.next(ZipFile.Java:539)
- locked <0x00000006c0a57670> (a sun.net.www.protocol.jar.URLJarFile)
at Java.util.zip.ZipFile$ZipEntryIterator.nextElement(ZipFile.Java:514)
at Java.util.zip.ZipFile$ZipEntryIterator.nextElement(ZipFile.Java:495)
at Java.util.jar.JarFile$JarEntryIterator.next(JarFile.Java:258)
at Java.util.jar.JarFile$JarEntryIterator.nextElement(JarFile.Java:267)
at Java.util.jar.JarFile$JarEntryIterator.nextElement(JarFile.Java:248)
at com.alibaba.ChaosBlade.exec.plugin.jvm.script.Java.JavaCodeScriptEngine$InMemoryJavaFileManager.processJar(JavaCodeScriptEngine.Java:421)
at com.alibaba.ChaosBlade.exec.plugin.jvm.script.Java.JavaCodeScriptEngine$InMemoryJavaFileManager.listUnder(JavaCodeScriptEngine.Java:401)
at com.alibaba.ChaosBlade.exec.plugin.jvm.script.Java.JavaCodeScriptEngine$InMemoryJavaFileManager.find(JavaCodeScriptEngine.Java:390)
at com.alibaba.ChaosBlade.exec.plugin.jvm.script.Java.JavaCodeScriptEngine$InMemoryJavaFileManager.list(JavaCodeScriptEngine.Java:375)
at com.sun.tools.Javac.api.ClientCodeWrapper$WrappedJavaFileManager.list(ClientCodeWrapper.Java:231)
at com.sun.tools.Javac.jvm.ClassReader.fillIn(ClassReader.Java:2796)
at com.sun.tools.Javac.jvm.ClassReader.complete(ClassReader.Java:2446)
at com.sun.tools.Javac.jvm.ClassReader.access$000(ClassReader.Java:76)
at com.sun.tools.Javac.jvm.ClassReader$1.complete(ClassReader.Java:240)
at com.sun.tools.Javac.code.Symbol.complete(Symbol.Java:574)
at com.sun.tools.Javac.comp.MemberEnter.visitTopLevel(MemberEnter.Java:507)
at com.sun.tools.Javac.tree.JCTree$JCCompilationUnit.accept(JCTree.Java:518)
at com.sun.tools.Javac.comp.MemberEnter.memberEnter(MemberEnter.Java:437)
at com.sun.tools.Javac.comp.MemberEnter.complete(MemberEnter.Java:1038)
at com.sun.tools.Javac.code.Symbol.complete(Symbol.Java:574)
at com.sun.tools.Javac.code.Symbol$ClassSymbol.complete(Symbol.Java:1037)
at com.sun.tools.Javac.comp.Enter.complete(Enter.Java:493)
at com.sun.tools.Javac.comp.Enter.main(Enter.Java:471)
at com.sun.tools.Javac.main.JavaCompiler.enterTrees(JavaCompiler.Java:982)
at com.sun.tools.Javac.main.JavaCompiler.compile(JavaCompiler.Java:857)
at com.sun.tools.Javac.main.Main.compile(Main.Java:523)
at com.sun.tools.Javac.api.JavacTaskImpl.doCall(JavacTaskImpl.Java:129)
at com.sun.tools.Javac.api.JavacTaskImpl.call(JavacTaskImpl.Java:138)
at com.alibaba.ChaosBlade.exec.plugin.jvm.script.Java.JavaCodeScriptEngine.compileClass(JavaCodeScriptEngine.Java:149)
at com.alibaba.ChaosBlade.exec.plugin.jvm.script.Java.JavaCodeScriptEngine.compile(JavaCodeScriptEngine.Java:113)
at com.alibaba.ChaosBlade.exec.plugin.jvm.script.base.AbstractScriptEngineService.doCompile(AbstractScriptEngineService.Java:82)
at com.alibaba.ChaosBlade.exec.plugin.jvm.script.base.AbstractScriptEngineService.compile(AbstractScriptEngineService.Java:69)
at com.alibaba.ChaosBlade.exec.plugin.jvm.script.model.DynamicScriptExecutor.run(DynamicScriptExecutor.Java:74)
at com.alibaba.ChaosBlade.exec.common.injection.Injector.inject(Injector.Java:73)
at com.alibaba.ChaosBlade.exec.common.aop.AfterEnhancer.afterAdvice(AfterEnhancer.Java:46)
at com.alibaba.ChaosBlade.exec.common.plugin.MethodEnhancer.afterAdvice(MethodEnhancer.Java:47)
at com.alibaba.ChaosBlade.exec.bootstrap.jvmsandbox.AfterEventListener.onEvent(AfterEventListener.Java:93)
at com.alibaba.jvm.sandbox.core.enhance.weaver.EventListenerHandler.handleEvent(EventListenerHandler.Java:116)
at com.alibaba.jvm.sandbox.core.enhance.weaver.EventListenerHandler.handleOnEnd(EventListenerHandler.Java:426)
at com.alibaba.jvm.sandbox.core.enhance.weaver.EventListenerHandler.handleOnReturn(EventListenerHandler.Java:363)
Through the thread stack, we can see that the thread is mainly blocked when decompressing jar files. Why is the thread blocked here?
When ChaosBlade injects a custom script, the custom script (Java code) is only treated as a character string. When the plug-in is activated, the string is parsed and then turned into Java code for JVM to load, compile, and execute the code.
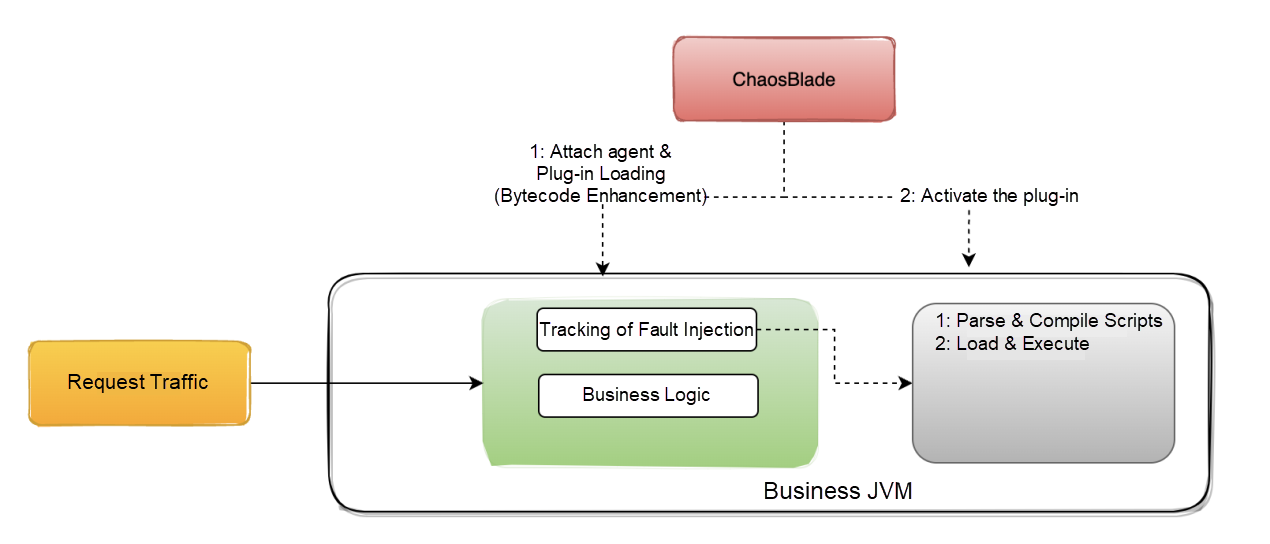
This is the problem. External traffic is also continuously calling the current service during fault injection. According to the logic above, it is possible to cause a large number of requests to parse the custom script during activating the plug-in because external traffic is also constantly calling the current service. It may cause the thread to be blocked. The process from parsing the custom script to getting JVM to load is relatively complex and slow, but it is necessary to ensure thread safety in some cases.
ChaosBlade also does the cache. As long as the custom script is compiled once, the subsequent requests will directly execute the script. However, such a cache cannot be compiled well in the case of concurrent requests.
We should come up with an optimization method based on the investigation above to advance the loading time of custom scripts.
ChaosBlade fault injection is divided into two steps. If you cannot get the custom script information when attaching the agent in the first step, load the custom script before activating the plug-in in the second step. (Once the plug-in is activated, the traffic will be executed to the fault injection tracking method area to trigger the compilation of the script.)
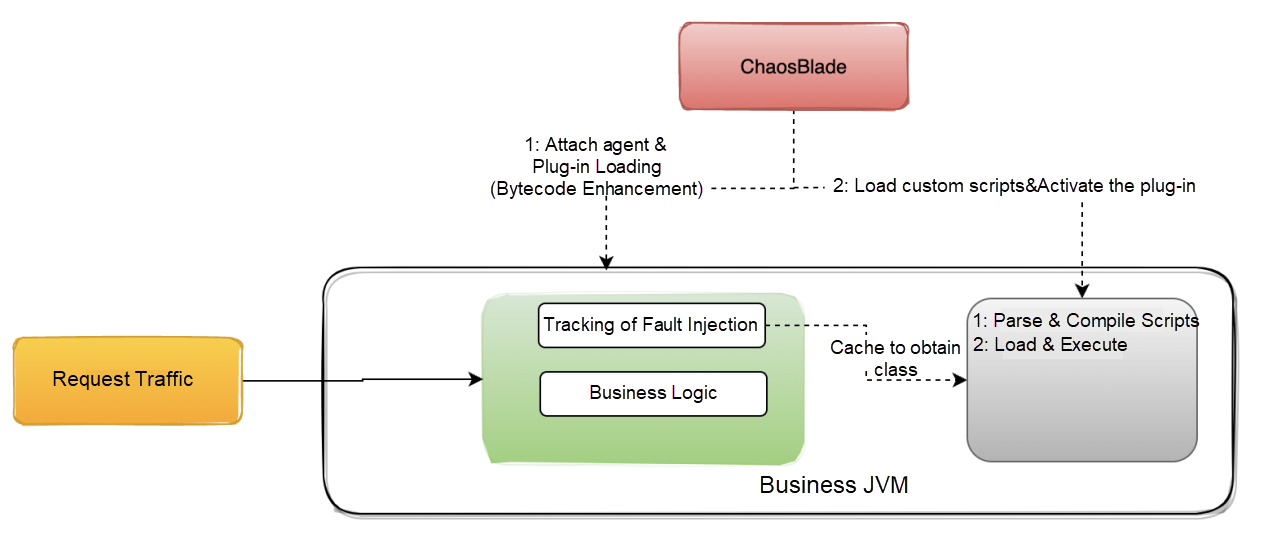
This optimization idea applies to the custom script fault and the fault of custom exception throwing.
Reflective loading will only be carried out in the fault execution of custom exception throwing according to the abnormal class characters input by the user when the traffic comes. The bottom layer of ClassLoader also needs to be locked, which may cause blocked threads.
Optimization Method: Add a fault pre-execution interface, which can be implemented for plug-ins that need to perform certain actions before fault injection.
public interface PreActionExecutor {
    /**
     * Pre run executor
     *
     * @param enhancerModel
     * @throws Exception
     */
    void preRun(EnhancerModel enhancerModel) throws ExperimentException;
}
private void applyPreActionExecutorHandler(ModelSpec modelSpec, Model model)
throws ExperimentException {
ActionExecutor actionExecutor = modelSpec.getActionSpec(model.getActionName()).getActionExecutor();
if (actionExecutor instanceof PreActionExecutor) {
EnhancerModel enhancerModel = new EnhancerModel(EnhancerModel.class.getClassLoader(), model.getMatcher());
enhancerModel.merge(model);
((PreActionExecutor) actionExecutor).preRun(enhancerModel);
}
}Related PR: https://github.com/ChaosBlade-io/ChaosBlade-exec-jvm/pull/269
There are two main aspects of the CPU Idle falling to the bottom caused by log printing:
1. The first aspect is the internal log framework of the business system, such as log4j/logback for synchronous log printing. After the fault injection (such as exception throwing), it is likely to cause a large number of threads to be blocked because of the exception processing and log printing of the business system. Synchronous log printing requires locking operation, and the exception stack is relatively large, so the printing is time-consuming. Therefore, a large number of threads may be blocked when the QPS is high.
- locked <0x00000006f08422d0> (a org.apache.log4j.DailyRollingFileAppender)
at org.apache.log4j.helpers.AppenderAttachableImpl.appendLoopOnAppenders(AppenderAttachableImpl.Java:66)
at org.apache.log4j.Category.callAppenders(Category.Java:206)
- locked <0x00000006f086daf8> (a org.apache.log4j.Logger)
at org.apache.log4j.Category.forcedLog(Category.Java:391)
at org.apache.log4j.Category.log(Category.Java:856)
at org.slf4j.impl.Log4jLoggerAdapter.log(Log4jLoggerAdapter.Java:601)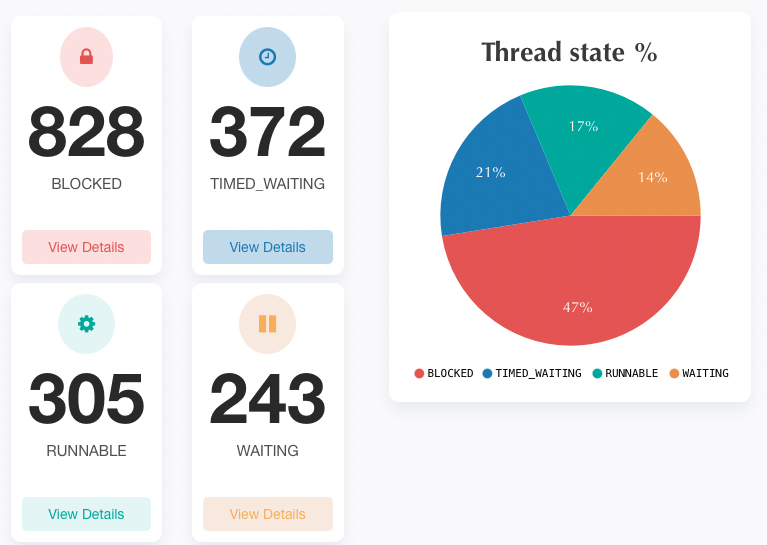
2. The second one is the ChaosBlade log printing. The info logs are output each time the fault injection rule matches successfully.
LOGGER.info("Match rule: {}", JsonUtil.writer().writeValueAsString(model));When entering logs, the fault model is output through Jackson serialization. This triggers class loading (locking operation) and may cause a large number of threads blocked when there are a large number of requests.
Plain Text
Java.lang.Thread.State: RUNNABLE
at Java.lang.String.charAt(String.Java:657)
at Java.io.UnixFileSystem.normalize(UnixFileSystem.Java:87)
at Java.io.File.<init>(File.Java:279)
at sun.net.www.protocol.file.Handler.openConnection(Handler.Java:80)
- locked <0x00000000c01f2740> (a sun.net.www.protocol.file.Handler)
at sun.net.www.protocol.file.Handler.openConnection(Handler.Java:72)
- locked <0x00000000c01f2740> (a sun.net.www.protocol.file.Handler)
at Java.net.URL.openConnection(URL.Java:979)
at sun.net.www.protocol.jar.JarFileFactory.getConnection(JarFileFactory.Java:65)
at sun.net.www.protocol.jar.JarFileFactory.getPermission(JarFileFactory.Java:154)
at sun.net.www.protocol.jar.JarFileFactory.getCachedJarFile(JarFileFactory.Java:126)
at sun.net.www.protocol.jar.JarFileFactory.get(JarFileFactory.Java:81)
- locked <0x00000000c00171f0> (a sun.net.www.protocol.jar.JarFileFactory)
at sun.net.www.protocol.jar.JarURLConnection.connect(JarURLConnection.Java:122)
at sun.net.www.protocol.jar.JarURLConnection.getInputStream(JarURLConnection.Java:152)
at Java.net.URL.openStream(URL.Java:1045)
at Java.lang.ClassLoader.getResourceAsStream(ClassLoader.Java:1309)
......
at Java.lang.reflect.Method.invoke(Method.Java:498)
at com.fasterxml.jackson.databind.ser.BeanPropertyWriter.serializeAsField(BeanPropertyWriter.Java:689)
at com.fasterxml.jackson.databind.ser.std.BeanSerializerBase.serializeFields(BeanSerializerBase.Java:755)
at com.fasterxml.jackson.databind.ser.BeanSerializer.serialize(BeanSerializer.Java:178)
at com.fasterxml.jackson.databind.ser.BeanPropertyWriter.serializeAsField(BeanPropertyWriter.Java:728)
at com.fasterxml.jackson.databind.ser.std.BeanSerializerBase.serializeFields(BeanSerializerBase.Java:755)
at com.fasterxml.jackson.databind.ser.BeanSerializer.serialize(BeanSerializer.Java:178)
at com.fasterxml.jackson.databind.ser.DefaultSerializerProvider._serialize(DefaultSerializerProvider.Java:480)
at com.fasterxml.jackson.databind.ser.DefaultSerializerProvider.serializeValue(DefaultSerializerProvider.Java:319)
at com.fasterxml.jackson.databind.ObjectWriter$Prefetch.serialize(ObjectWriter.Java:1516)
at com.fasterxml.jackson.databind.ObjectWriter._writeValueAndClose(ObjectWriter.Java:1217)
at com.fasterxml.jackson.databind.ObjectWriter.writeValueAsString(ObjectWriter.Java:1086)
at com.alibaba.ChaosBlade.exec.common.injection.Injector.inject(Injector.Java:69)
at com.alibaba.ChaosBlade.exec.common.aop.AfterEnhancer.afterAdvice(AfterEnhancer.Java:46)
at com.alibaba.ChaosBlade.exec.common.plugin.MethodEnhancer.afterAdvice(MethodEnhancer.Java:47)
at com.alibaba.ChaosBlade.exec.bootstrap.jvmsandbox.AfterEventListener.onEvent(AfterEventListener.Java:93)
at com.alibaba.jvm.sandbox.core.enhance.weaver.EventListenerHandler.handleEvent(EventListenerHandler.Java:116)
at com.alibaba.jvm.sandbox.core.enhance.weaver.EventListenerHandler.handleOnEnd(EventListenerHandler.Java:426)
at com.alibaba.jvm.sandbox.core.enhance.weaver.EventListenerHandler.handleOnReturn(EventListenerHandler.Java:363)
at Java.com.alibaba.jvm.sandbox.spy.Spy.spyMethodOnReturn(Spy.Java:192)The blocked thread caused by log printing of the business system is not within the scope of ChaosBlade optimization. If you encounter similar situations, you need to solve them by yourself.
Solution:
The optimization of ChaosBlade log printing is relatively simple. You only need to replace the part (from the match rule to serialized fault model), implement the Model into toString, and print the Model directly:
LOGGER.info("Match rule: {}", model);@Override
public String toString() {
return "Model{" +
"target='" + target + '\'' +
", matchers=" + matcher.getMatchers().toString() +
", action=" + action.getName() +
'}';
}Related PR: https://github.com/ChaosBlade-io/ChaosBlade-exec-jvm/pull/260
What is Metaspace? Here is the official introduction:
Metaspace is a native (as in: off-heap) memory manager in the hotspot.
It is used to manage memory for class metadata. Class metadata are allocated when classes are loaded. Their lifetime is usually scoped to the loading classloader - when a loader gets collected, all class metadata it accumulated is released in bulk.
Metaspace is a non-heap memory used to store class metadata. When a class is loaded, memory is allocated in Metaspace to store class metadata. When the ClassLoader is closed, references to the class metadata are correspondingly released. When Garbage Collection (GC) is triggered, the memory occupied by the class metadata will be collected in Metaspace.
After the fault injection of ChaosBlade is invalid, log on to the target machine to observe the log. First, the jvm-sandbox fails to attach the target jvm.

Second, a more critical log is found: Metaspace is out of memory.
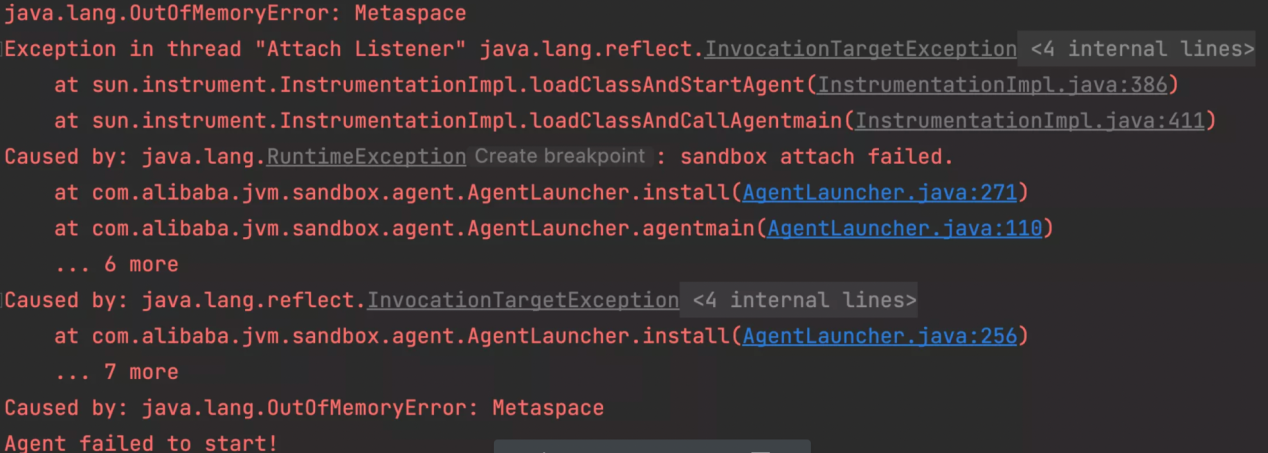
The process of ChaosBlade injecting faults under Java scenarios was introduced at the beginning of the article. It is known that when doing fault injection, the jvm-sandbox will be dynamically attached to the target process JVM. After attaching, the internal jar and custom module jar of sandbox will be loaded. A large number of classes will be loaded in this process. When loading classes, memory in Metaspace will be allocated to store class metadata.
Here are two ideas:
Log on to the target machine and use jinfo to observe the parameters of JVM. The MaxMetaspaceSize is set to 128 MB, which is not very large, because the default for MaxMetaspaceSize is -1 (unlimited or limited by local memory).
The business service adjusts the MaxMetaspaceSize to 256 MB. Then, restart the Java process and do fault injection again. Finally, the fault works normally.
However, the real problem is difficult to solve. The Metaspace OOM error still occurs after multiple fault injections, and the fault is still invalid. It seems the cause of Metaspace OOM is that the corresponding memory in Metaspace cannot be collected when the fault is cleared.
Since the ChaosBlade fault injection in Java scenarios is essentially done on one plug-in of jvm-sandbox, core logic (such as class loading and bytecode enhancement) are all on the jvm-sandebox. Therefore, we can directly locate the problem on the jvm-sandbox and use the demo project provided by jvm-sandbox to do reproduction.
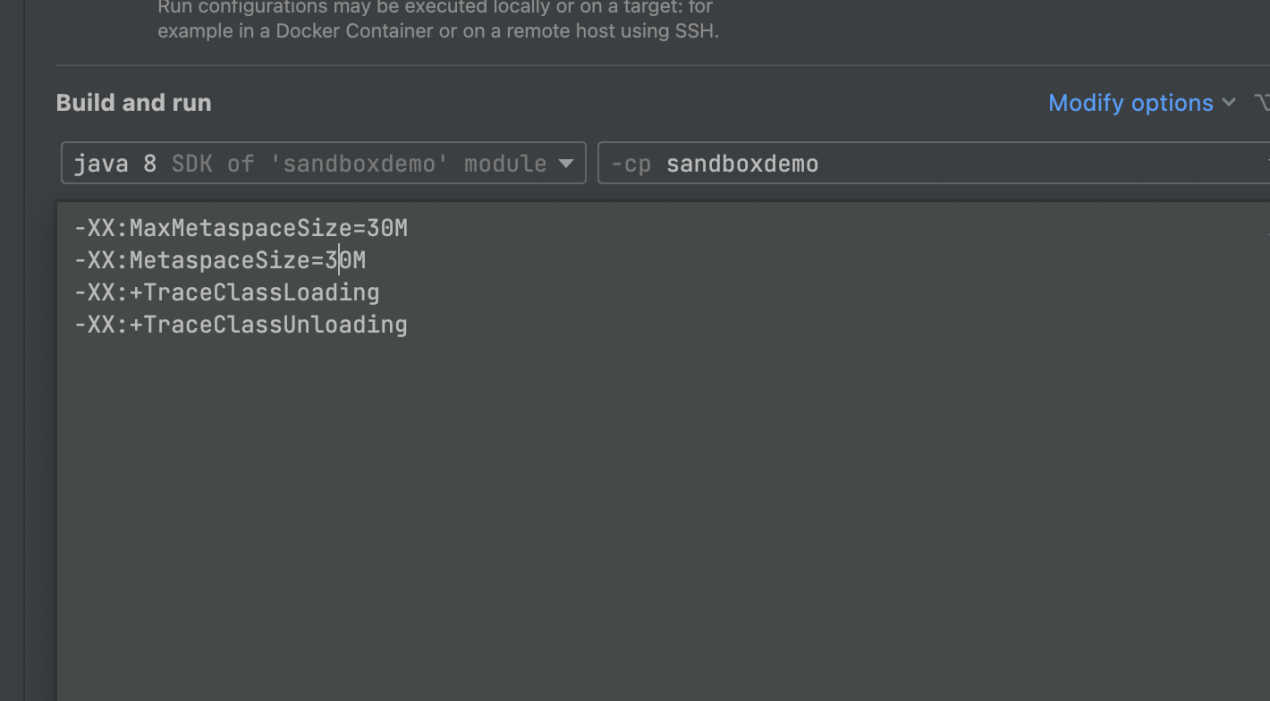
The startup parameter-MaxMetaspaceSize is set to 30 MB to reproduce OOM quickly because there are very few demo modules.
The TraceClassLoading and TraceClassUnloding parameters are used to observe information about JVM-SANDBOX loading/unloading classes during fault injection and clearing.
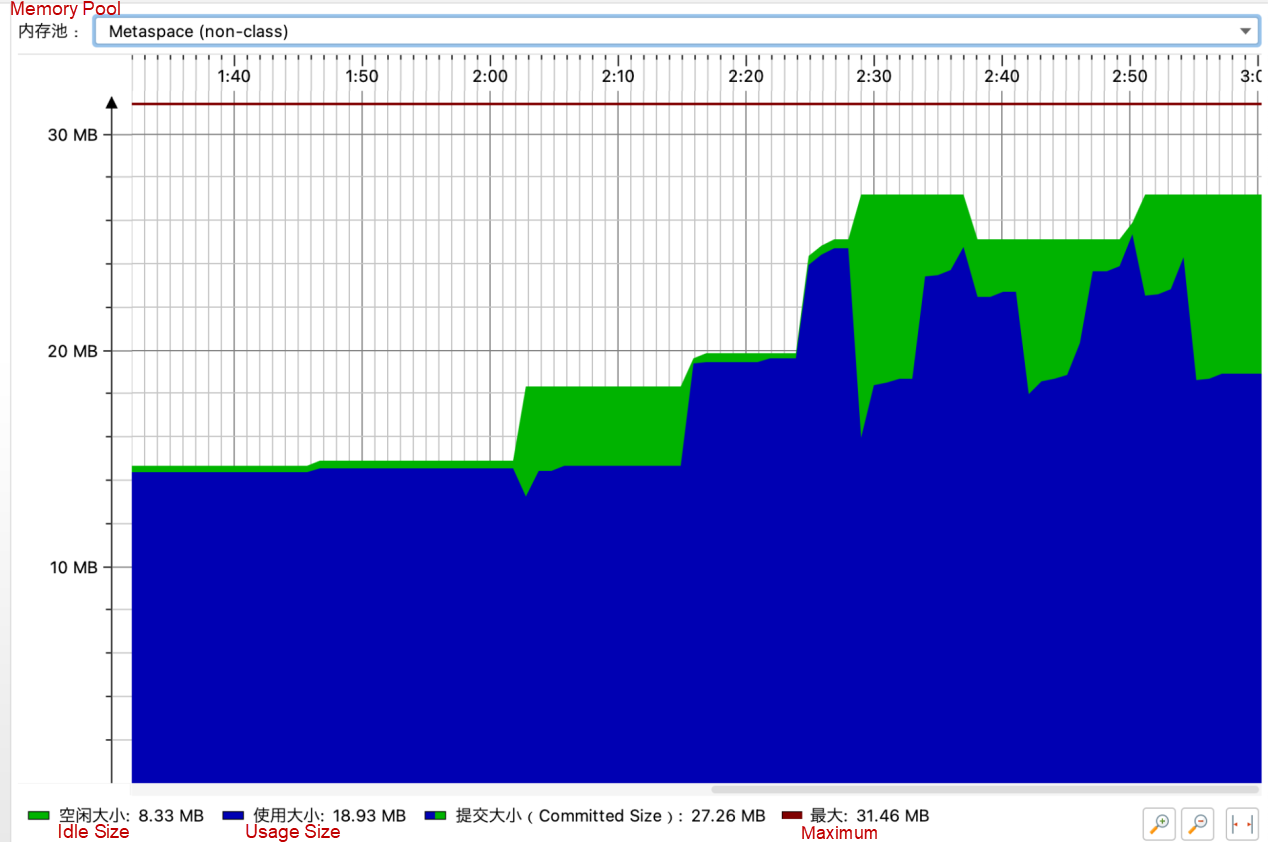
After multiple fault injections and fault clearing, Metaspace OOM in online services is reproduced. Metaspace has not been collected during multiple injections, and the curve representing the space occupation is rising throughout.
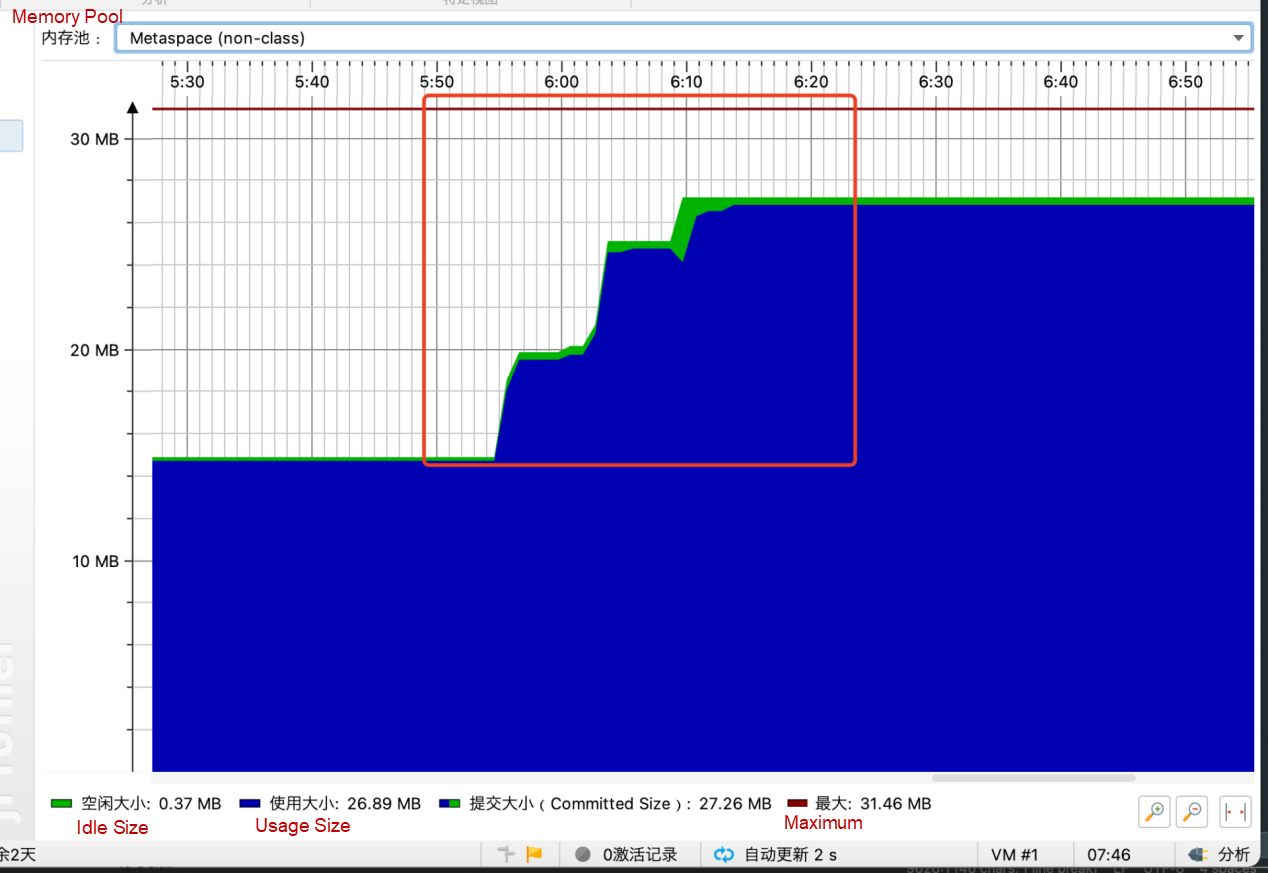
Metaspace OOM is caused because Metaspace has not been collected. Metaspace is collected on the premise that ClassLoader is closed, whereas ClassLoader is closed when JVM-SANDBOX is shut down. The custom ClassLoader in the JVM-SANDBOX inherits the URLClassLoader. The official introduction of the URLClassLoader closing method is listed below:
How can I close a URLClassLoader?
The URLClassLoader close()method effectively eliminates the problem of how to support updated implementations of the classes and resources loaded from a particular codebase and in particular from JAR files. In principle, once the application clears all references to a loader object, the garbage collector and finalization mechanisms will eventually ensure that all resources (such as the JarFile objects) are released and closed.
In summary, the URLClassLoader can be closed when all classes loaded by the ClassLoader are not referenced.
When the fault is cleared, the class in the jvm-sandbox is still referenced, causing the ClasLoader to fail to close.
After the fault is cleared, run DEBUG in the method area of target service to view the thread information, and you can find references to the two internal classes of jvm-sandbox (EventProcesser$Process,SandboxProtector) in threadLocal. This means the conjecture is right, and the cause of the problem is discovered.
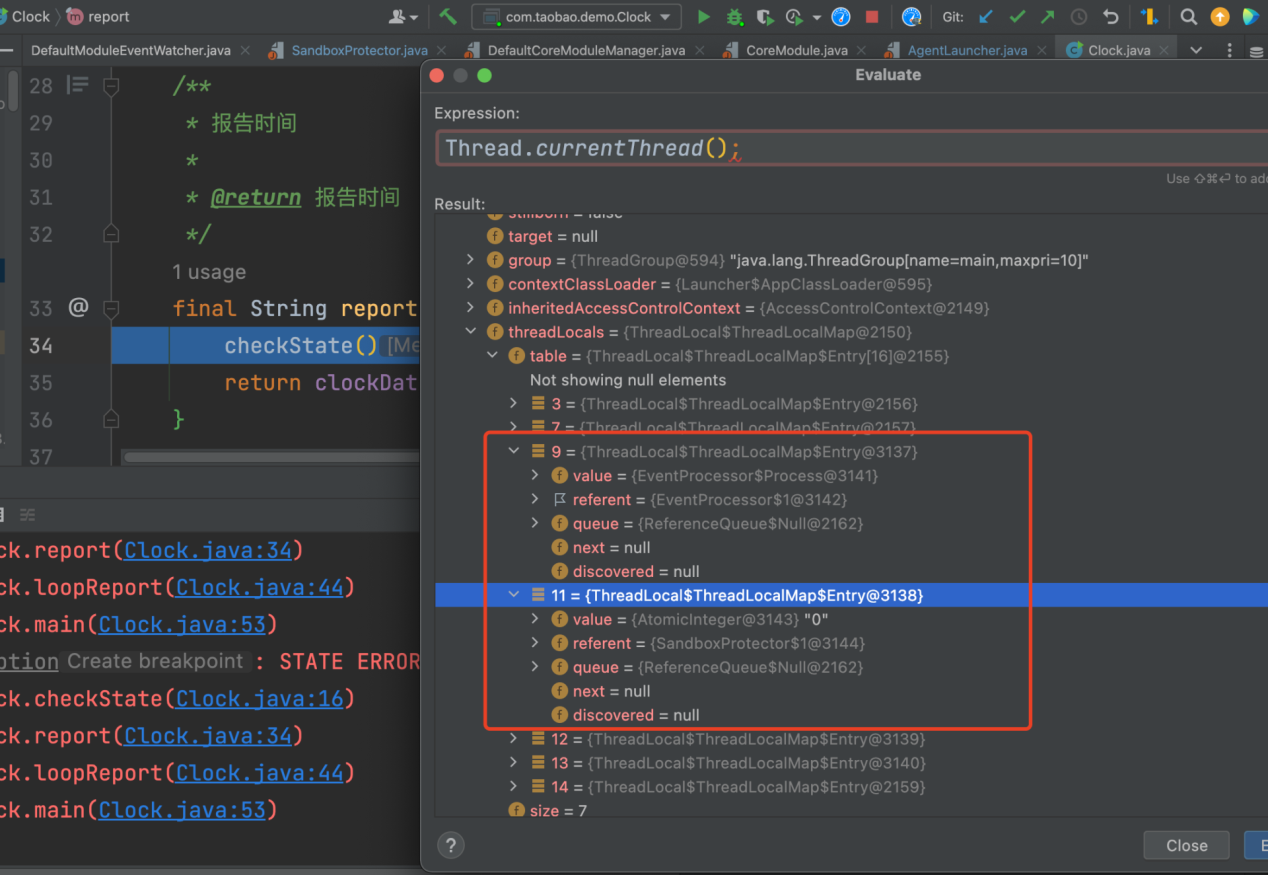
The source code of jvm-sandbox will not be analyzed here, but you can read this article for more information (Article in Chinese). The main reason is that there is a bug in the jvm-sandbox code implementation. In the following two cases, the ThreadLocal of processRef will not be removed in time, causing leakage:
1. In the process of fault injection, performing fault clearing will cause leakage. Example:
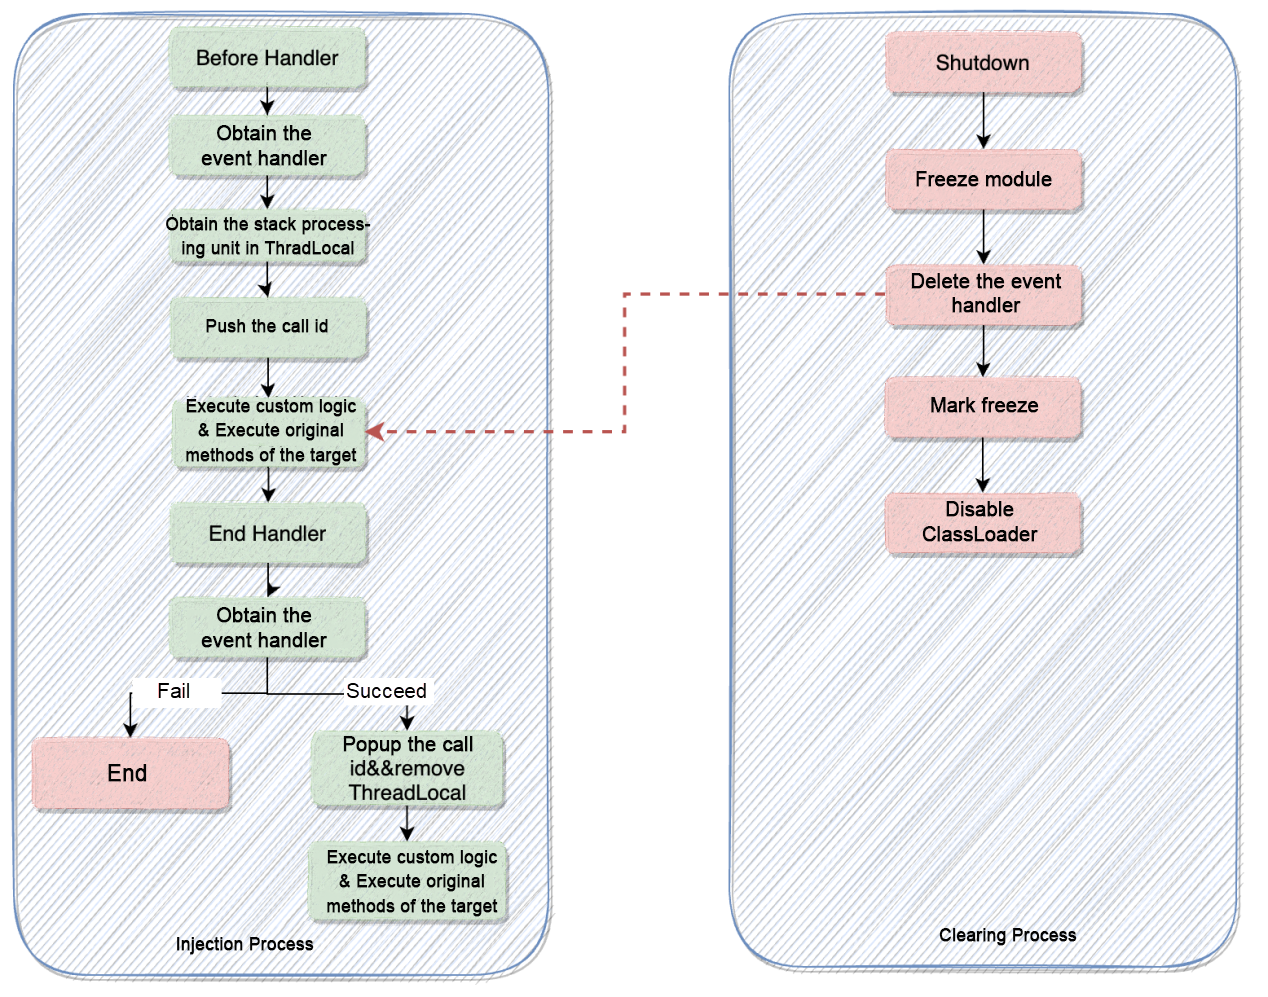
2. Assuming the jvm-sandbox feature-process change (such as immediate return and immediate exception throwing) is used, the essence says the ThreadLocal is not removed in time, resulting in leakage.
Since jvm-sandbox project is no longer active, we fork the jvm-sandbox project into ChaosBlade.
Optimized related PR: https://github.com/ChaosBlade-io/jvm-sandbox/pull/1
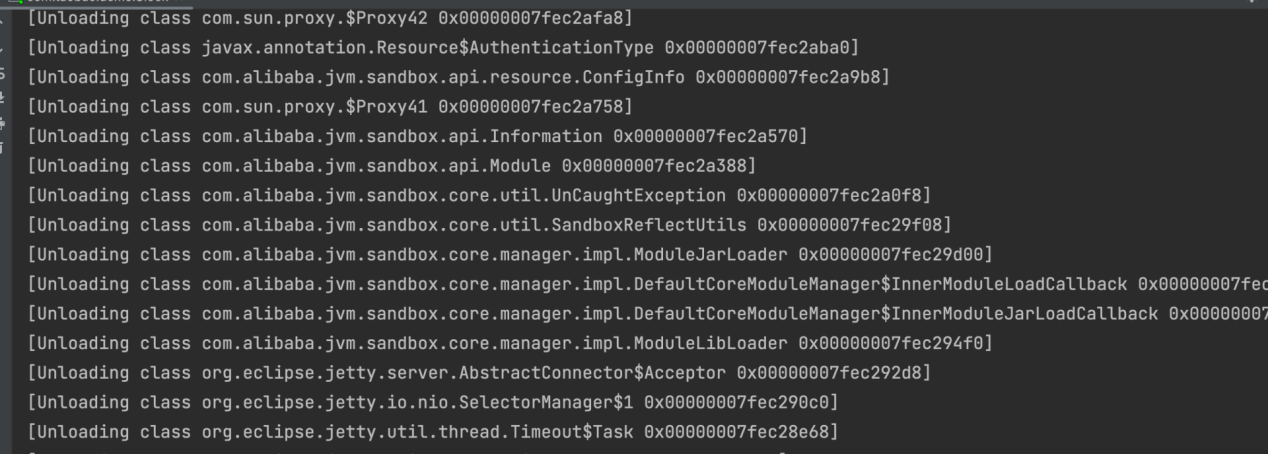
The startup parameters are still the same: MaxMetaspaceSize=30 MB. After optimization, Metaspace OOM will not occur during multiple fault injections and fault clearing, and Metaspace can be collected.
The information about the unloaded class is also printed.
We have solved the ThreadLocal leak problem in JVM-Sandbox, but it is still possible to cause Metaspace OOM due to the memory allocation and collection mechanism of Metaspace.
Please see this article for more information about Metaspace memory allocation and collection.
How can we completely solve the Metaspace OOM problem? Based on the optimization above, trigger a full GC before each fault injection, aiming to forcibly release the Metaspace occupied by the last jvm-sandbox.
Changed Part:
public static void agentmain(String featureString, Instrumentation inst) {
    System.gc();
    LAUNCH_MODE = LAUNCH_MODE_ATTACH;
    final Map<String, String> featureMap = toFeatureMap(featureString);
    writeAttachResult(
            getNamespace(featureMap),
            getToken(featureMap),
            install(featureMap, inst)
    );
}
This change can solve Metaspace OOM, but it also has disadvantages. As a result, a full GC will be triggered every time the agent is mounted during fault injection. So far, there is no better solution. We are considering developing this full GC operation into a configuration item and opening it through sandbox script, which allows users to choose whether to perform a full GC before fault injection as needed.
Related PR: https://github.com/ChaosBlade-io/jvm-sandbox/pull/6
In Java, compilers are mainly divided into three categories:
After fault injection through ChaosBlade, the essence says to use jvm-sandbox for bytecode enhancement of target classes and fault testing. This also triggers the just-in-time compilation of JVM.
The purpose of the JIT compilation of JVM is to convert the bytecode into the machine code so it can be executed more efficiently. However, resources will be consumed in the process of JVM JIT compilation. The most typical scenario is that the CPU usage rate of Java services will be relatively high when they are started and gradually return to stability after a period. This phenomenon is partly caused by the intervention of JIT compilation. Please see this article for more information about the JIT compilation (Article in Chinese).
It is normal for an increase in CPU usage rate caused by the JIT compilation. If the CPU usage rate occupied by the JIT compilation is particularly high, we need to pay attention to the parameters of the JIT compilation, including whether hierarchical compilation is enabled and the number of threads compiled.
ChaosBlade supports a wide range of fault injection scenarios, including a large number of plug-ins in the Java ecosystem. The advantage in fault injection under Java scenarios is clear.
After optimizing the problems described above, using ChaosBlade to do fault injection in Java scenarios will no longer cause the CPU Idle to fall to the bottom. The CPU jitter will be controlled within a small fluctuation range even when the fault injection is performed on services running online.
However, due to the JVM JIT compilation, the instantaneous jitter of the CPU during fault injection is still unavoidable. If you have any good methods/ideas, please submit the issue/PR to discuss together.
Official Website of ChaosBlade: https://chaosblade.io/
ChaosBlade GitHub : https://github.com/chaosblade-io/chaosblade
Zhang Binbin (GitHub account: binbin0325) is a ChaosBlade Committer, Nacos PMC, Apache Dubbo-Go Committer, and Sentinel-Golang Commiter. Currently, he mainly focuses on chaos engineering, middleware, and cloud-native.
Kruise Rollout v0.2.0: Support Gateway API and StatefulSet Rollout in Batches

692 posts | 56 followers
FollowAlibaba Cloud Native Community - April 22, 2021
Alibaba Cloud Community - October 14, 2022
Alibaba Clouder - May 24, 2019
Alibaba Cloud Native Community - March 3, 2022
Alibaba Developer - January 19, 2022
Aliware - May 20, 2019

692 posts | 56 followers
Follow Cloud Migration Solution
Secure and easy solutions for moving you workloads to the cloud
Learn More Database Migration Solution
Migrating to fully managed cloud databases brings a host of benefits including scalability, reliability, and cost efficiency.
Learn More ISV Solutions for Cloud Migration
Alibaba Cloud offers Independent Software Vendors (ISVs) the optimal cloud migration solutions to ready your cloud business with the shortest path.
Learn More Oracle Database Migration Solution
Migrate your legacy Oracle databases to Alibaba Cloud to save on long-term costs and take advantage of improved scalability, reliability, robust security, high performance, and cloud-native features.
Learn MoreMore Posts by Alibaba Cloud Native Community