By Ye Fei (GitHub Account: @tiny-x), an open-source community enthusiast and ChaosBlade committer, participating in promoting the ecosystem construction of chaos engineering in ChaosBlade.

In a distributed system architecture, it is difficult to assess the impact of a single fault on the entire system. This is because there are a wide variety of service components and intricate dependencies between services, and the request procedure is long. Imperfect basic services, such as monitoring alarms and log records, may also cause difficulties in fault response and troubleshooting. Therefore, it is a great challenge to build a highly available distributed system.
Chaos Engineering (CE) was developed specifically to overcome these challenges. Through injecting faults into the system in a controllable range or environment, developers can observe the system behavior and locate the system defects. By doing so, the ability and confidence to deal with chaos in a distributed system due to unexpected conditions are developed. Thus, the stability and high availability of the system are continuously improved.
The implementation process of Chaos Engineering is to formulate a chaos experiment plan, define steady metrics, make assumptions of fault-tolerant behavior in the system, execute chaos experiment, check steady metrics in system, and so on. For this reason, the entire chaos experiment process requires reliable, easy-to-use, and scenario-rich chaos experiment tools to inject faults. Complete distributed procedure tracking and system monitoring tools are also required. Tracking and monitoring tools aim to trigger the emergency response and early warning scheme, then to quickly locate the fault, and observe various system data metrics during the whole process.
In this article, we will introduce the chaos experiment tool ChaosBlade and the distributed system monitoring tool SkyWalking. We will also discuss about the high-availability microservices practices of ChaosBlade and SkyWalking through a microservices case.
ChaosBlade is a chaos engineering tool that follows the principles of chaos engineering experiments. It provides extensive fault scenarios to help distributed systems improve fault tolerance and recoverability. It can also implement the injection of underlying-layer faults, and ensure business continuity during migration to the cloud or Cloud Native system. ChaosBlade is easy-to-use, non-invasive, and highly scalable. It can continuously improve system stability and availability through fault injection within a controllable range or environment.
ChaosBlade is easy to use and supports a wide range of experiment scenarios, including the following:
ChaosBlade encapsulates scenarios into individual projects according to the domains. This not only realizes the scenario standardization in the domain, but also facilitates horizontal and vertical scaling of scenarios. By following the chaos experiment model, chaosblade CLI is called in a unified way.
SkyWalking is an open source APM system that includes monitoring, tracing, and diagnosis for distributed systems in Cloud Native architecture.
The core features are as follows:
It is very easy and convenient to install and use ChaosBlade. Various ChaosBlade scenarios are uniformly called through chaosblade CLI. After downloading and decompressing the corresponding tar package, the blade executable file is then used to perform chaos experiments. For downloading tar package, see: https://github.com/chaosblade-io/chaosblade/releases
The actual environment in this article is Linux-AMD64. Download the latest chaosblade-linux-amd64.tar.gz package and perform the following steps:
## Download
wget https://chaosblade.oss-cn-hangzhou.aliyuncs.com/agent/github/0.9.0/chaosblade-0.9.0-linux-amd64.tar.gz
## Decompress
tar -zxf chaosblade-0.9.0-linux-amd64.tar.gz
## Set environment variables
export PATH=$PATH:chaosblade-0.9.0/
## Test
blade –hAfter the installation, the blade executable file is only required to create chaos experiments for all supported scenarios. First, use the blade -h command to check the service. After selecting the sub-command, the -h can be used downward to see the complete usage case and the detailed description of each parameter:
The blade -h command can be executed to check which commands are supported:
An easy to use and powerful chaos engineering experiment toolkit

Usage:
  blade [command]

Available Commands:
  create      Create a chaos engineering experiment
  destroy     Destroy a chaos experiment
...For example, to create a full-load CPU scenario, the blade create cpu fullload –h command can be executed to check specific scenario parameters and select relevant parameters to run the command:
Create chaos engineering experiments with CPU load

Usage:
  blade create cpu fullload

Aliases:
  fullload, fl, load

Examples:

# Create a CPU full load experiment
blade create cpu load

#Specifies two random kernel's full load
blade create cpu load --cpu-percent 60 --cpu-count 2
...

Flags:
      --blade-release string     Blade release package,use this flag when the channel is ssh
      --channel string           Select the channel for execution, and you can now select SSH
      --climb-time string        durations(s) to climb
      --cpu-count string         Cpu count
      --cpu-list string          CPUs in which to allow burning (0-3 or 1,3)
      --cpu-percent string       percent of burn CPU (0-100)
...ChaosBlade supports three methods to resume an experiment as shown in the followings:
blade destroy uid command can be executed to resume the experiment.For more information about SkyWalking installation and usage, see: https://github.com/apache/skywalking/tree/v8.1.0/docs
After the tool is deployed, it's time to introduce the building of a highly available microservices system by taking cases as references. Through fault injection and system behavior observation, ChaosBlade and SkyWalking can locate problems and discover system defects to build a highly available microservices system.
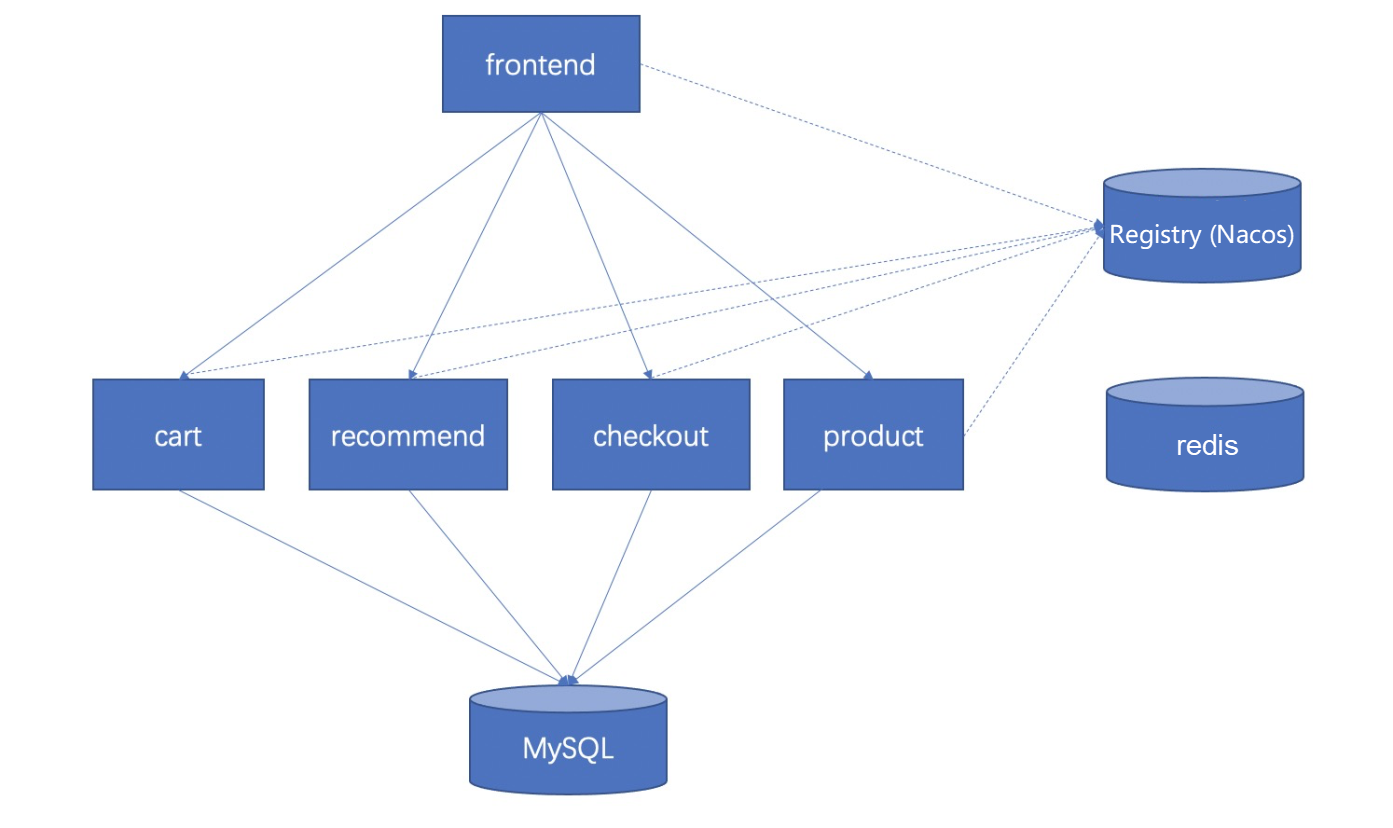
In this case, a microservice application is deployed for experiments, and A/B testing is used to simulate system requests. The microservice application services include the frontend, shopping cart, recommendation service, product, order, and so on. The components include Springboot, Nacos, MySQL, Redis, Lettuce, Dubbo are used. ChaosBlade supports most of the application components. ChaosBlade is used to inject chaos experiments to verify the application fault tolerance capability. SkyWalking is used for application monitoring and problem locating.
The overall architecture of the application is as follows. The frontend calls cart and products through the powerful dependency of Dubbo.
Next, a chaos experiment will be performed using ChaosBlade according to the steps.
Create a chaos experiment plan, and then call downstream services to frequently delay data. Use A/B testing to simulate normal interface access to the cart. Start two threads, and perform interface access by 10,000 times.
ab -n 10000 -c 2 http://127.0.0.1:8083/cartDefine system steady metrics, and select /cart endpoint in the SkyWalking console. The steady metrics are as follows:
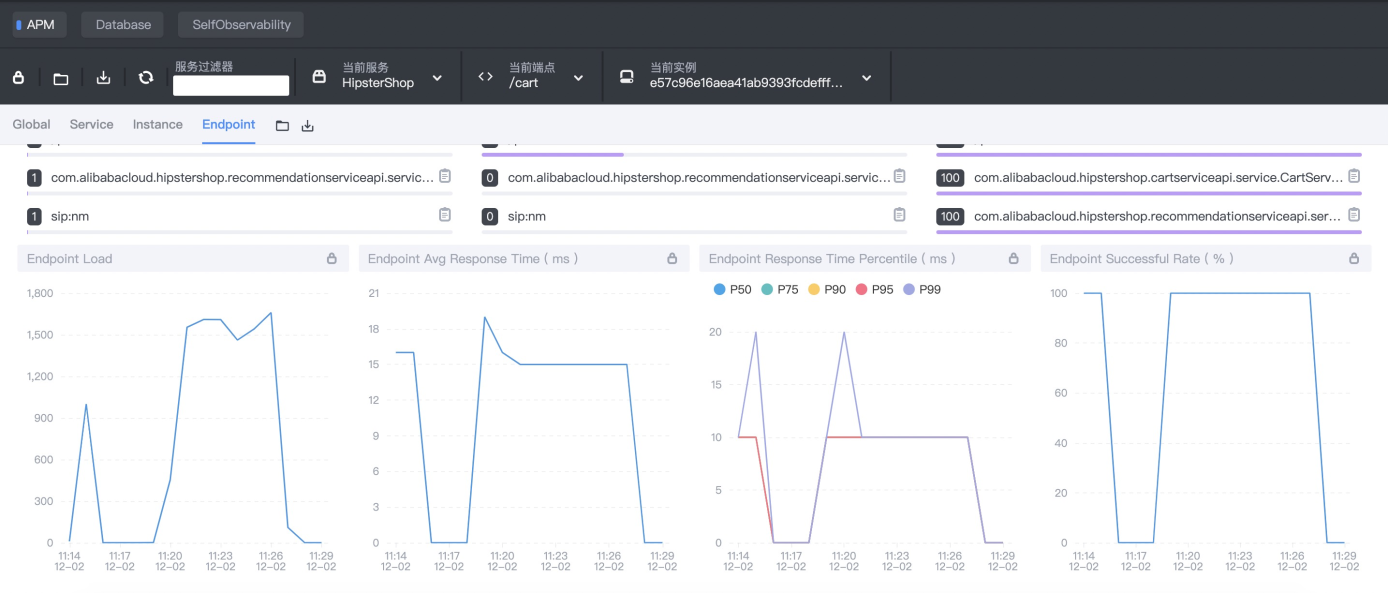
The ChaosBlade installation and its simple usage are described in the previous section. Now, a latency fault (30 seconds of delay) is injected into the downstream Dubbo cart service by ChaosBlade. Then, blade create dubbo delay –h command is executed to check how Dubbo calls the delay:
Dubbo interface to do delay experiments, support provider and consumer

Usage:
  blade create dubbo delay

Examples:
# Invoke com.alibaba.demo.HelloService.hello() service, do delay 3 seconds experiment
blade create dubbo delay --time 3000 --service com.alibaba.demo.HelloService --methodname hello --consumer

Flags:
      --appname string          The consumer or provider application name
      --consumer                To tag consumer role experiment.
      --effect-count string     The count of chaos experiment in effect
      --effect-percent string   The percent of chaos experiment in effect
      --group string            The service group
  -h, --help                    help for delay
      --methodname string       The method name
      --offset string           delay offset for the time
      --override                only for java now, uninstall java agent
      --pid string              The process id
      --process string          Application process name
      --provider                To tag provider experiment
      --service string          The service interface
      --time string             delay time (required)
      --timeout string          set timeout for experiment in seconds
      --version string          the service version

Global Flags:
  -d, --debug        Set client to DEBUG mode
      --uid string   Set Uid for the experiment, adapt to docker
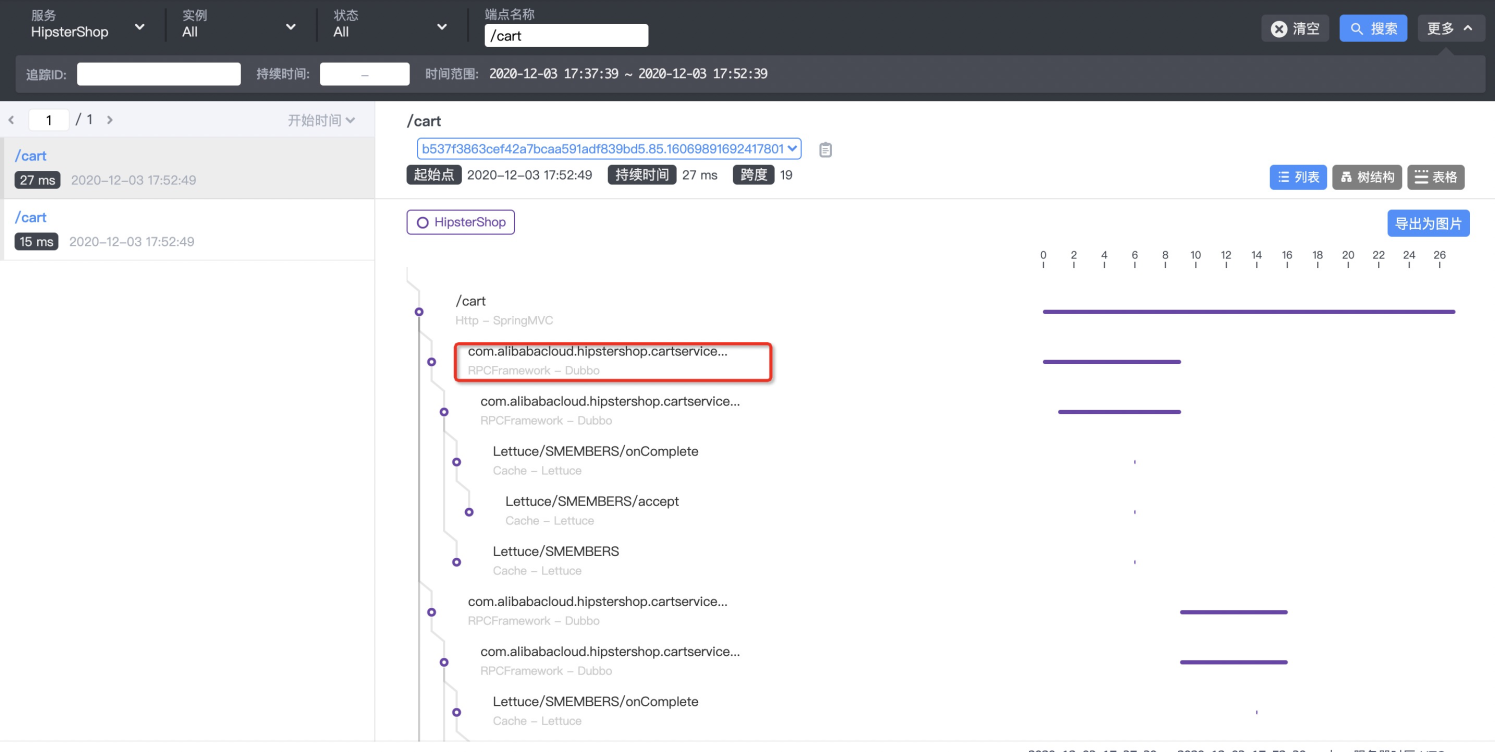
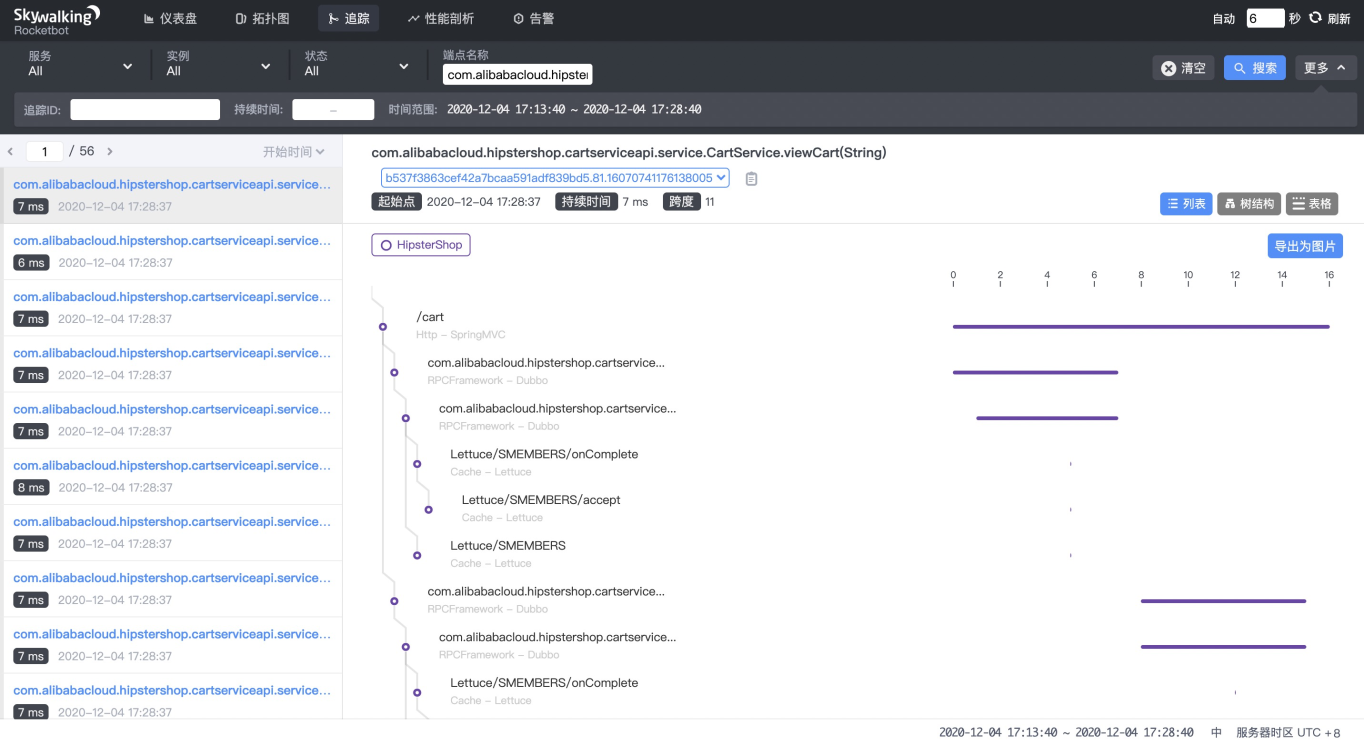
According to the case and parameter explanation, the upstream service client needs to inject a latency fault (30 seconds of latency). With SkyWalking, the Dubbo service information on the procedure can be easily found. Search for the procedure with the endpoint /cart first, and find the Dubbo service, as shown in the following figure:
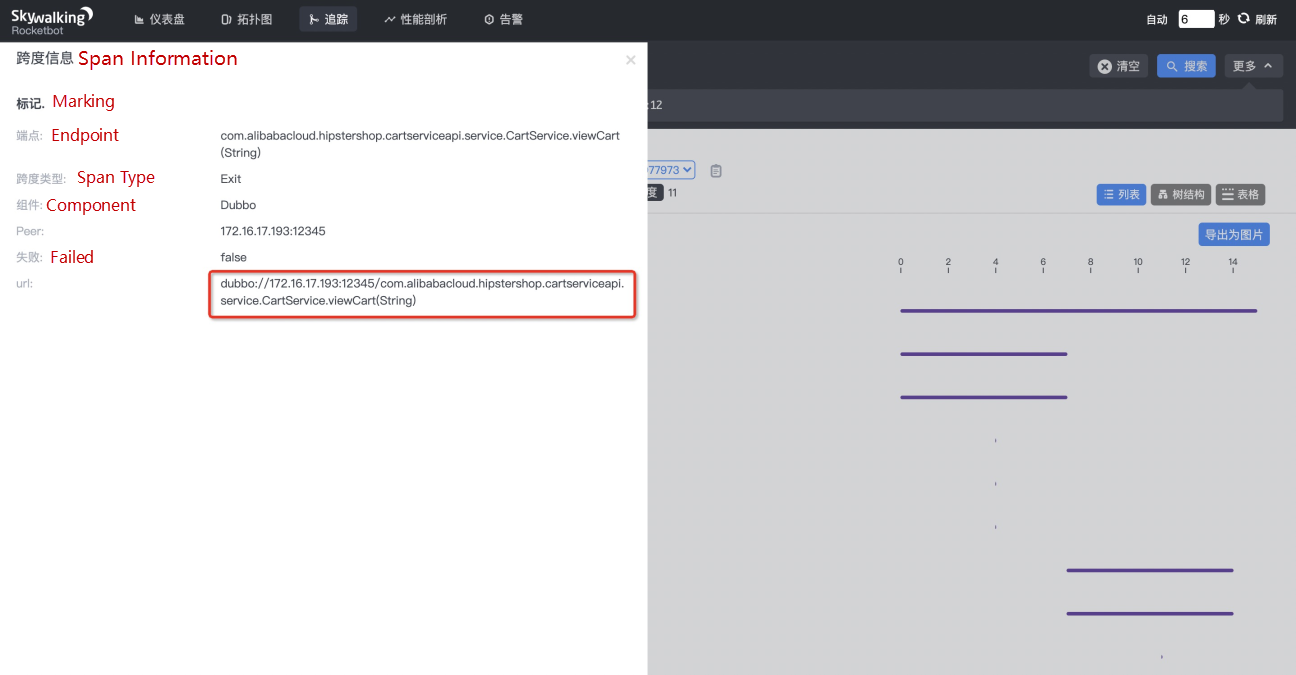
Click in to check the detailed span information of the Dubbo service. After obtaining the URL of the Dubbo service, the parameters required to use ChaosBlade to inject the upstream service delay are obtained. Therefore, our final parameter structure is:
Issue command and inject fault:
blade create dubbo delay --time 30000 --service com.alibabacloud.hipstershop.cartserviceapi.service.CartService --methodname viewCart --process frontend --consumerCheck the system metrics after fault injection, and check the metrics on SkyWalking:
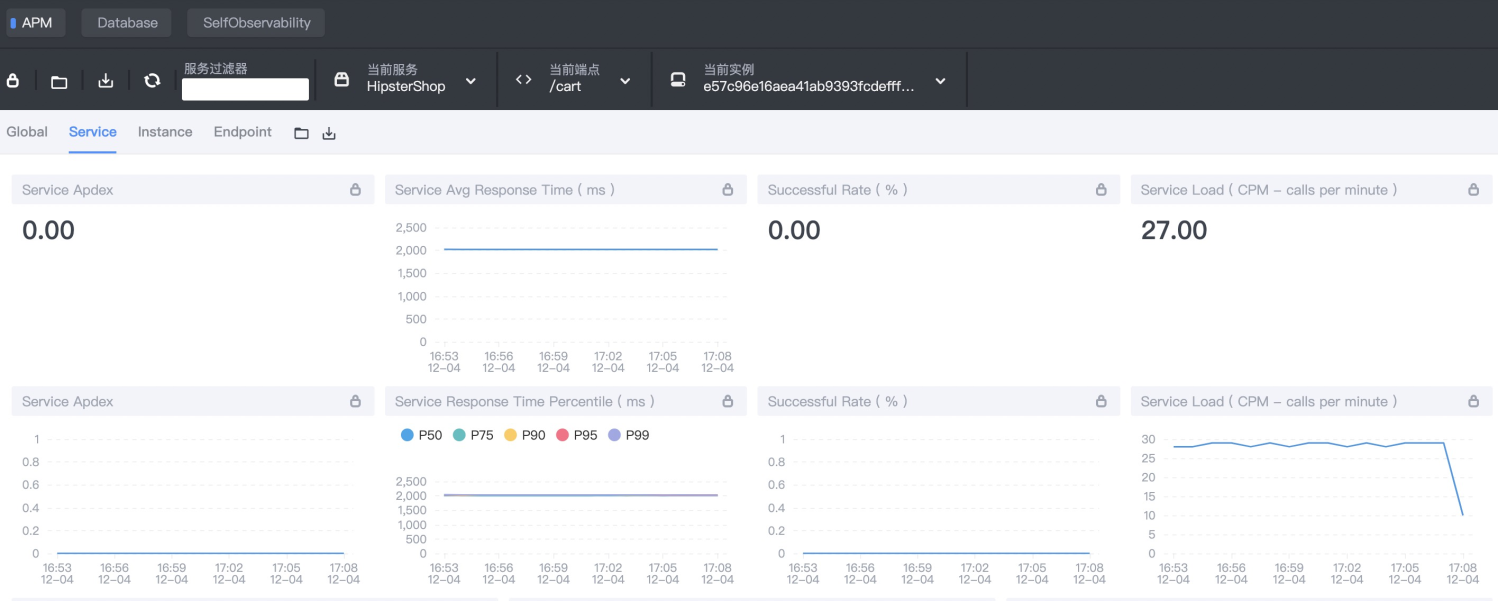
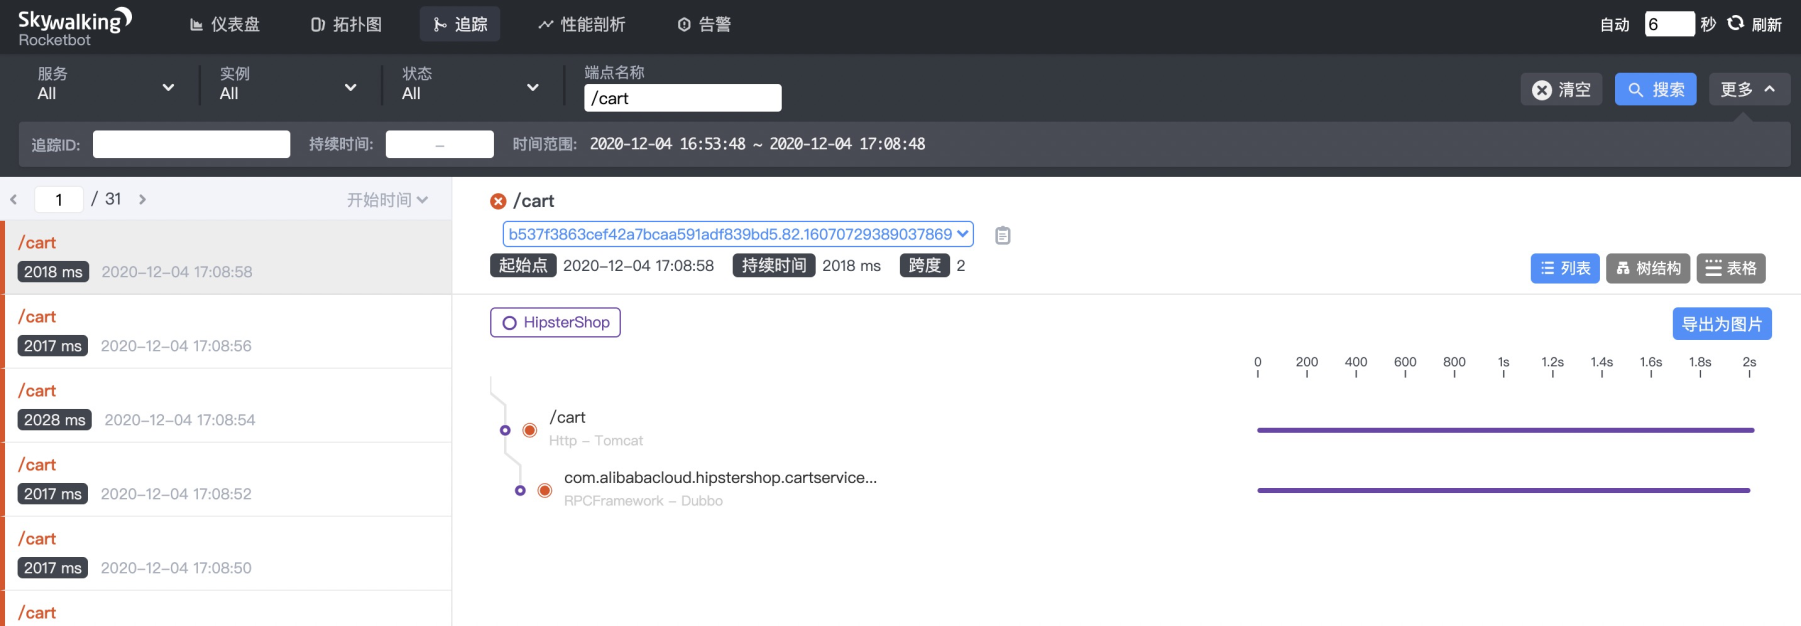
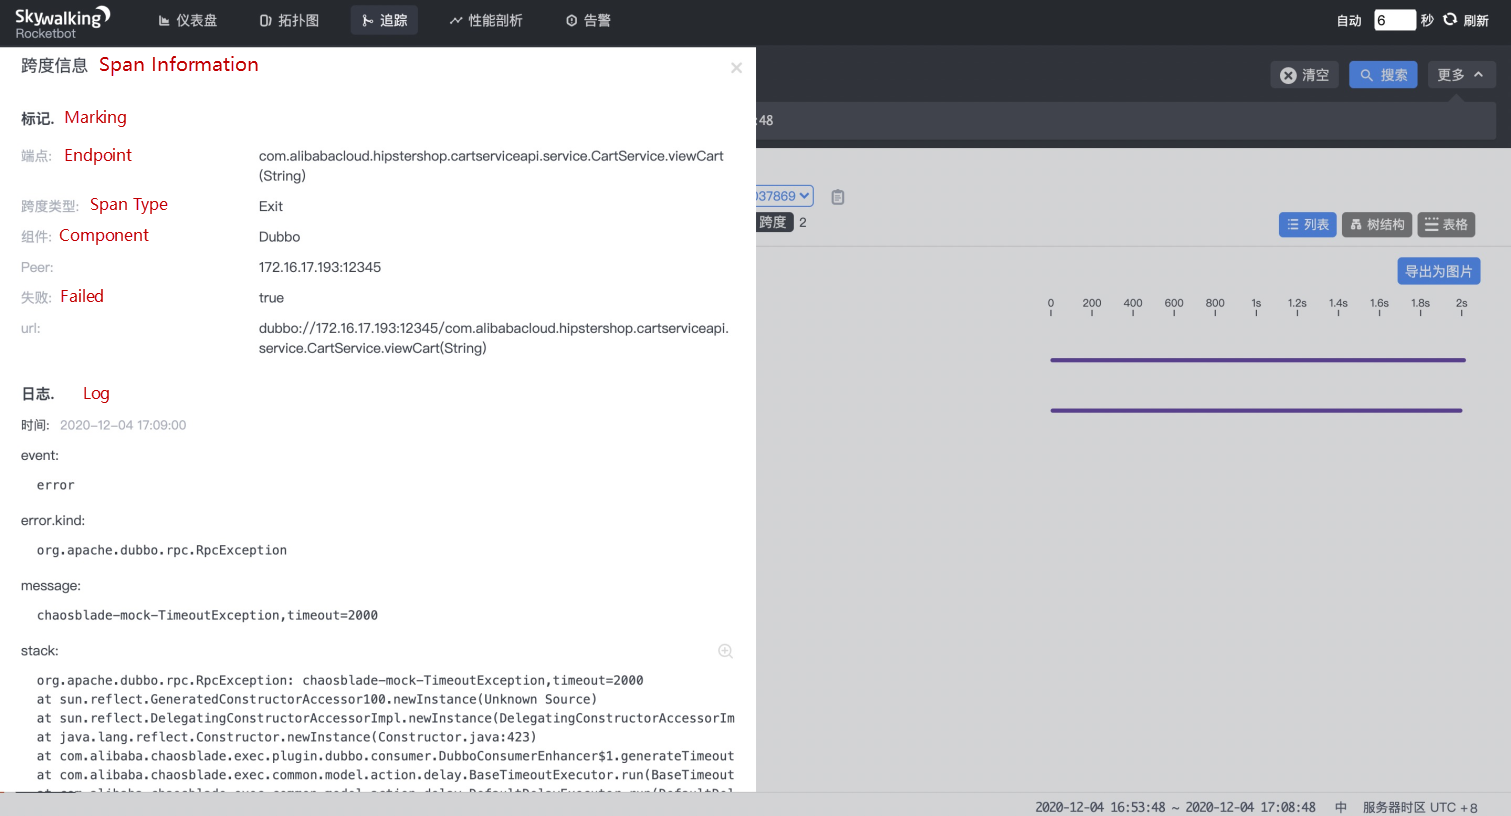
Conclusion: The upstream service is configured with the call timeout period, but without service blow policy, which is actually not as expected.
| Policy | Problem Description | Expectation |
| Call timeout period | The client can receive a response in two seconds at most. | Expected |
| Service blow policy/service degradation | The response time of each client request is more than two seconds, and the page returns the unreadable error message to the users. | Not as expected |
Configure the service blow policy/service degradation.
During running, Dubbo service provider fails to access the registry. The fault of network packet loss (100%) is injected in the registry.
Define system steady metrics and select service endpoints in the SkyWalking console. The steady metrics are as follows:
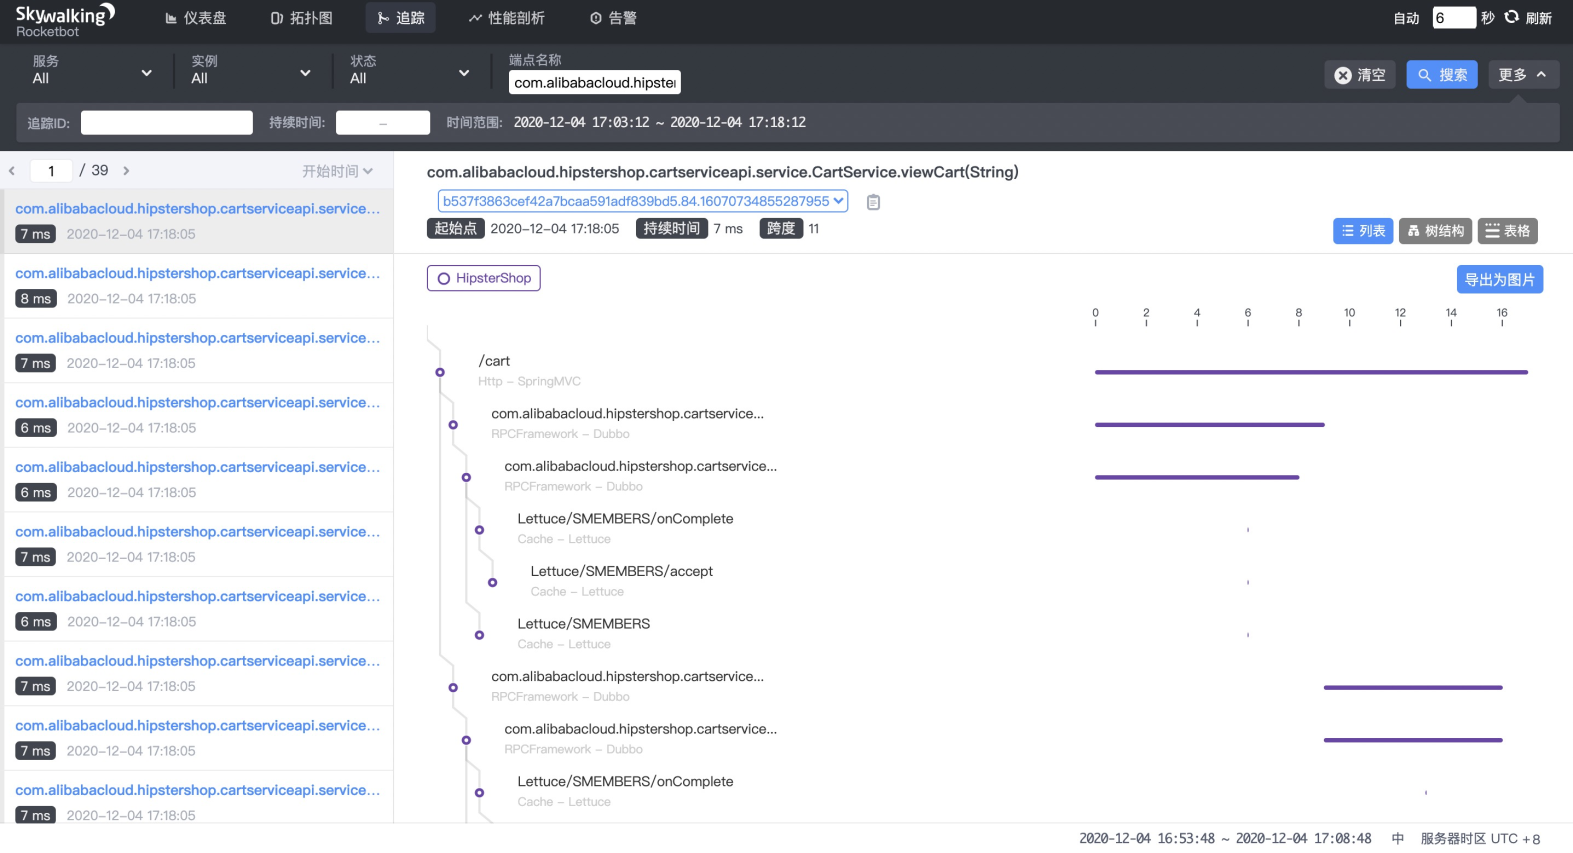
Upstream and Downstream services will not be affected.
Inject packet loss fault (100%) in registry port. In this case, Nacos is used as the registry for Dubbo. The default port is 8848, and the network interface card (NIC) is eth0. The command parameters are as follows:
Issue command and inject fault:
blade create network loss --interface eth0 --percent 100 --local-port 8848Select the service endpoint in the SkyWalking console after fault injection. Steady metrics are as follows:
Conclusion: The service is weakly dependent on the registry and the service itself has a local cache, which is in line with the expected assumption.
| Policy | Problem description | Expectation |
| Local cache for the service | Upstream and downstream services are not affected. | Expected |
Assume that the application is now deployed in a Kubernetes cluster. The horizontal scaling capability of the registry can be verified. ChaosBlade also supports Kubernetes cluster scenarios. .
In the above cases, it has been tested whether the service is configured with timeout and blow policies. The weak dependency of Dubbo on the registry and the local cache for the service are also verified. Can't wait to experience it in your own system, right? ChaosBlade provides a wide range of experiment scenarios for everyone. It not only supports basic resources and applications, but also is a powerful tool for Cloud Native platforms. ChaosBlade is user-friendly and provides detailed parameters to control the minimum explosion radius of the fault. ChaosBlade will make it very easy for everyone to get started.
It is not enough to only talk on paper. Here an additional simple case is provided for everyone to practice. We often deal with relational databases in application development. When the application traffic increases rapidly, bottlenecks often occur on the database side, resulting in a lot of slow SQLs. When there is no slow SQL alert, it is difficult to find the original SQL for optimization. Therefore, slow SQL alert is very important. To verify whether an application supports this capability, ChaosBlade injects slow SQL fault of MySQL. Then, it executes "blade create mysql delay –h" command to see how MySQL calls the delay:
Mysql delay experiment

Usage:
  blade create mysql delay

Examples:
# Do a delay 2s experiment for mysql client connection port=3306 INSERT statement
blade create mysql delay --time 2000 --sqltype select --port 3306

Flags:
      --database string         The database name which used
      --effect-count string     The count of chaos experiment in effect
      --effect-percent string   The percent of chaos experiment in effect
  -h, --help                    help for
      --host string             The database host
      --offset string           delay offset for the time
      --override                only for java now, uninstall java agent
      --pid string              The process id
      --port string             The database port which used
      --process string          Application process name
      --sqltype string          The sql type, for example, select, update and so on.
      --table string            The first table name in sql.
      --time string             delay time (required)
      --timeout string          set timeout for experiment in seconds

Global Flags:
  -d, --debug        Set client to DEBUG mode
      --uid string   Set Uid for the experiment, adapt to docker
As shown, ChaosBlade provides a complete example and supports parameters with a smaller granularity, such as SQL types and table names. Try to perform a 10s of delay for the "select" operation when port 3306 is connected. Is there an alert in your application when the traffic hits?
blade create mysql delay --time 10000 --sqltype select --port 3306Command parameter explanation:
This article describes the application of Chaos Engineering in complex distributed architectures. It also introduces chaos experiments with ChaosBlade and SkyWalking to analyze and optimize the system, based on the fault performance. Thus, the stability and high availability of the system is continuously improved. ChaosBlade not only supports basic resources and applications, but also serves as a useful tool on the Cloud Native platform. You are welcomed to use it.
ChaosBlade project is available at this address: https://github.com/chaosblade-io/chaosblade. You are welcome to join us and work together! Visit the following page for the Contribution Guide.
OpenKruise: A Powerful Tool for Sidecar Container Management

681 posts | 56 followers
FollowAlibaba Clouder - May 24, 2019
Alibaba Cloud Native Community - March 3, 2022
Alibaba Cloud Native Community - November 27, 2025
Aliware - May 20, 2019
Alibaba Cloud Native Community - February 8, 2025
Alibaba Cloud Community - March 8, 2022

681 posts | 56 followers
Follow Microservices Engine (MSE)
MSE provides a fully managed registration and configuration center, and gateway and microservices governance capabilities.
Learn More Container Service for Kubernetes
Alibaba Cloud Container Service for Kubernetes is a fully managed cloud container management service that supports native Kubernetes and integrates with other Alibaba Cloud products.
Learn More Managed Service for Prometheus
Multi-source metrics are aggregated to monitor the status of your business and services in real time.
Learn More ACK One
Provides a control plane to allow users to manage Kubernetes clusters that run based on different infrastructure resources
Learn MoreMore Posts by Alibaba Cloud Native Community
Dikky Ryan Pratama May 9, 2023 at 5:51 am
finally I found how to use ChaosBlade, thanks