The Trace Explorer feature enables real-time analysis of stored full trace data based on filter conditions or aggregation dimensions. This helps meet custom diagnostic requirements in various scenarios.
Filter traces
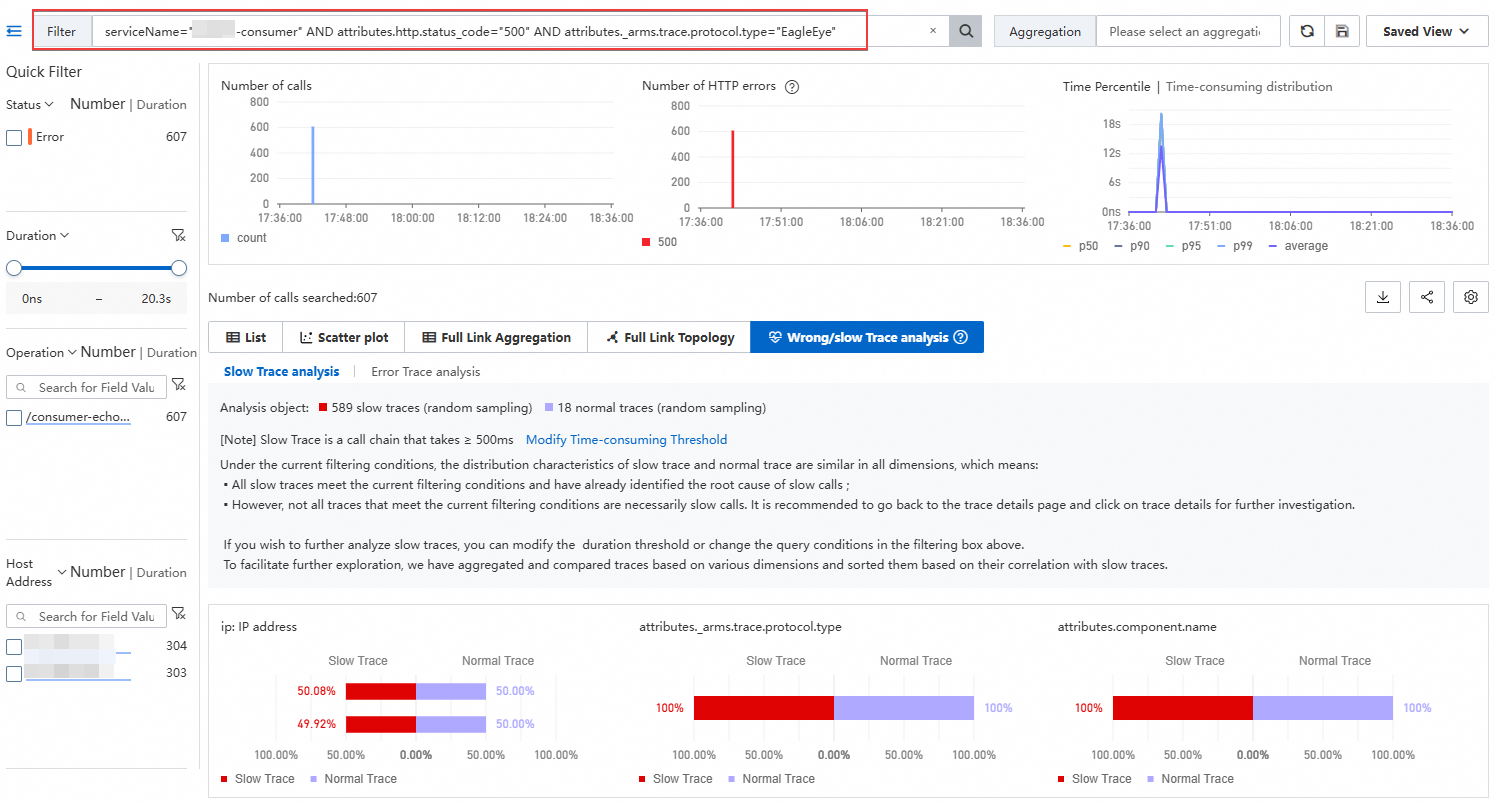
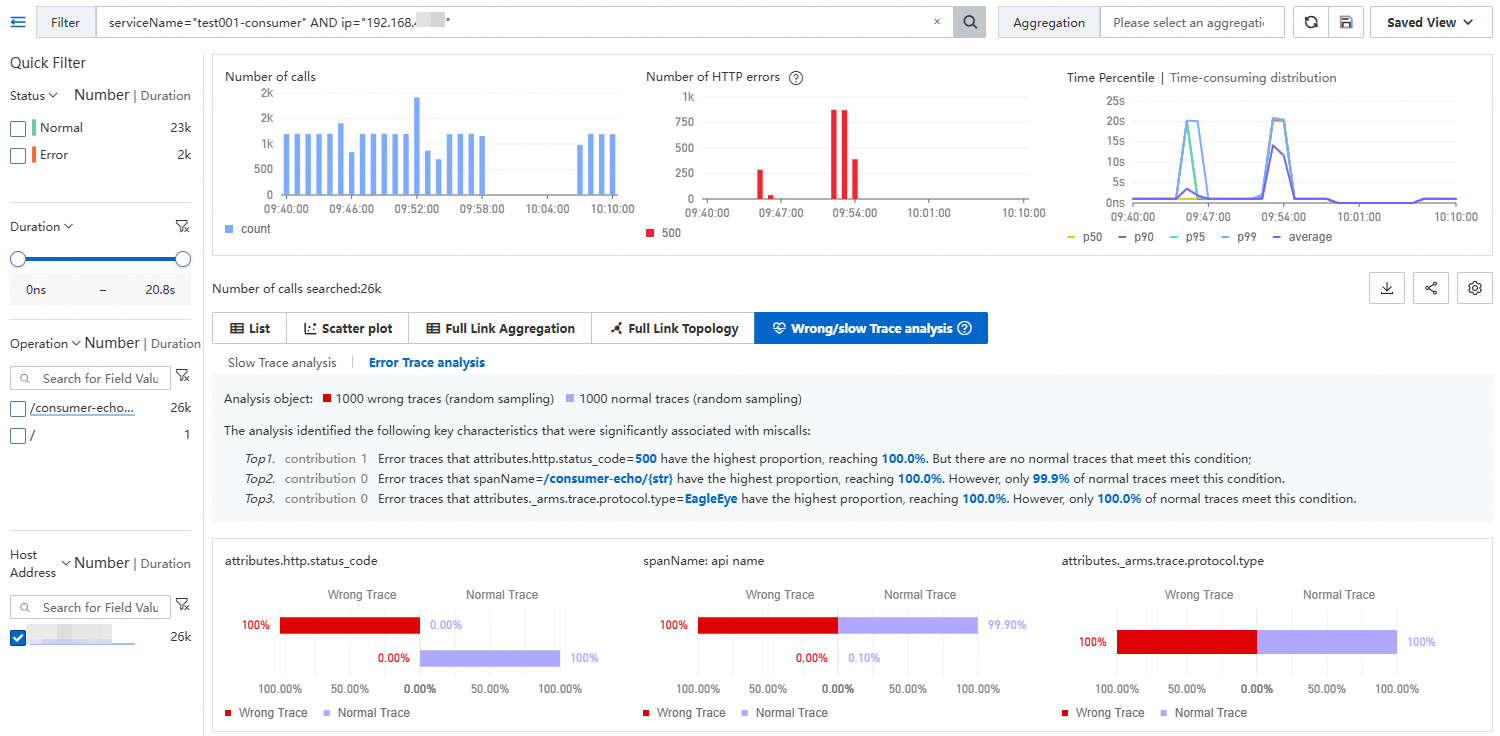
On the Trace Explorer tab, filter traces using the following instructions.
In the Quick Filter section on the left, quickly filter traces by Status, Duration, Interface Name, and Host Address dimensions.
The specified filter conditions are displayed in the search bar.
Click the text box on the right of the filter, select the required query conditions in the Common Queries panel, or directly enter the query statement in the text box. For more information about the query syntax, see Query syntax for Trace Explorer.
Click the drop-down list on the right of Aggregate to filter the required aggregation conditions.
NoteClick the
 icon on the right of the text box to save the current filter conditions.
Click Saved Views on the right of the text box to view the saved filter conditions. Click the target filter condition to quickly view the trace information under the corresponding filter condition.
Trace list
After completing the filter settings, the Trace Explorer tab displays the filtered trace query information, including the column chart of the number of calls and HTTP errors, the time series curve of call duration, and the Span list and Trace list.
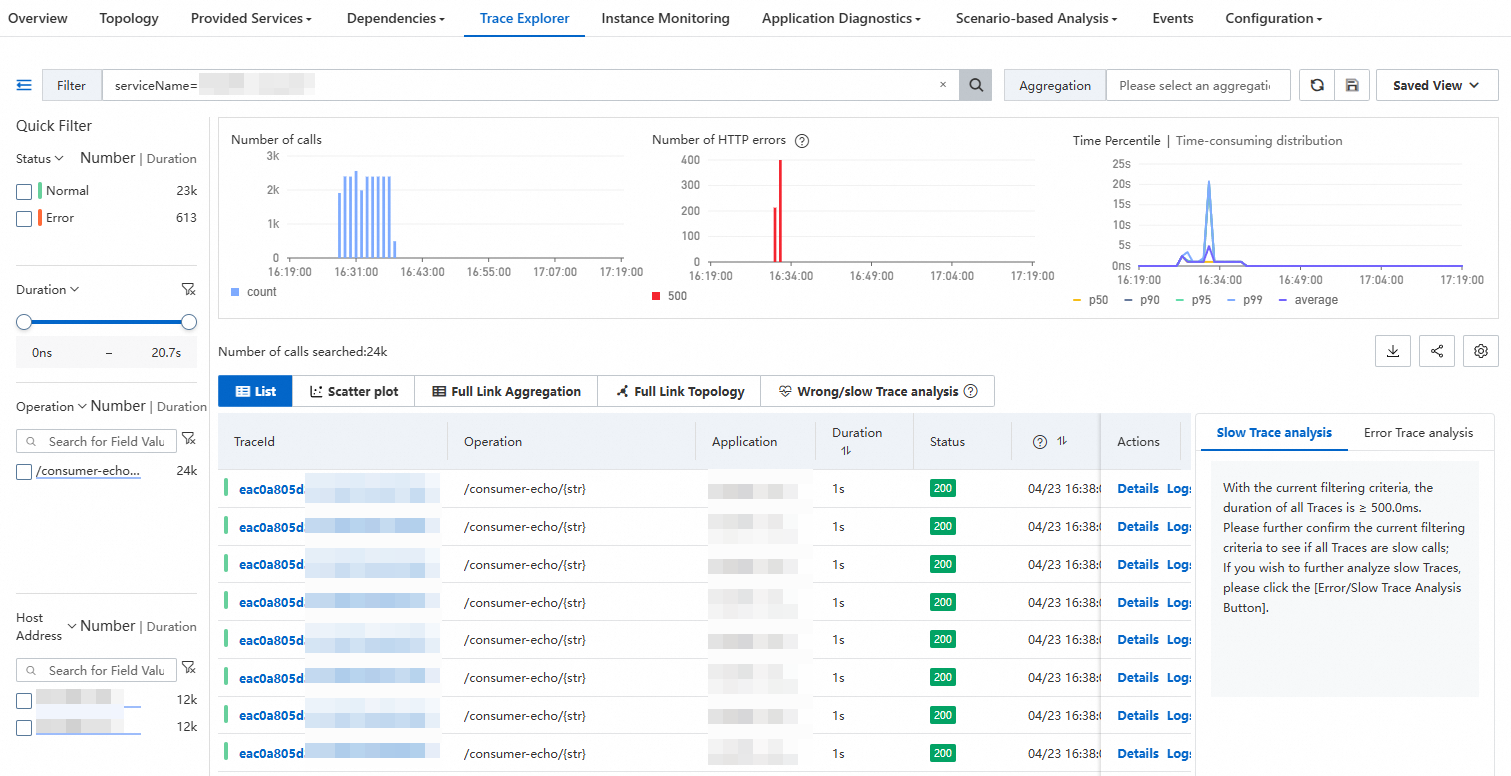
Description of icons in the Status column:
 : The span status is normal. This is obtained from the statusCode field of the span. When statusCode=1, it indicates that the span status is normal.
 : The span status is abnormal. This is obtained from the statusCode field of the span. When statusCode=2, it indicates that the span status is abnormal.
 : The span contains exceptions. This is obtained from the attributes.excep.ids field of the span. When this field is not empty, it indicates that the span contains exceptions.
2XX (green), 3XX (yellow), 4XX (orange), 5XX (red): HTTP status code. This is obtained from the attributes.http.status_code or attributes.http.response.status_code field of the span. When the span contains these two fields, the HTTP status code is displayed with priority, and the normal or abnormal status is not displayed.
In the Span list and Trace list sections, you can perform the following operations:
Click the TraceId of the target trace or Details in the Actions column on the right to view the trace details and topology view. For more information, see Trace details.
Click Logs in the Actions column on the right of the target trace to view the log information corresponding to the trace. For more information, see Log analysis.
The Trace list displays the Root Span for each TraceId by default. Click the
 icon to expand and view all spans under the TraceId.
Click the
 icon in the upper-right corner to add or hide parameters displayed in the list.
Move the pointer over the trace parameter and click the
 icon on the right to add the current parameter value as a filter condition.
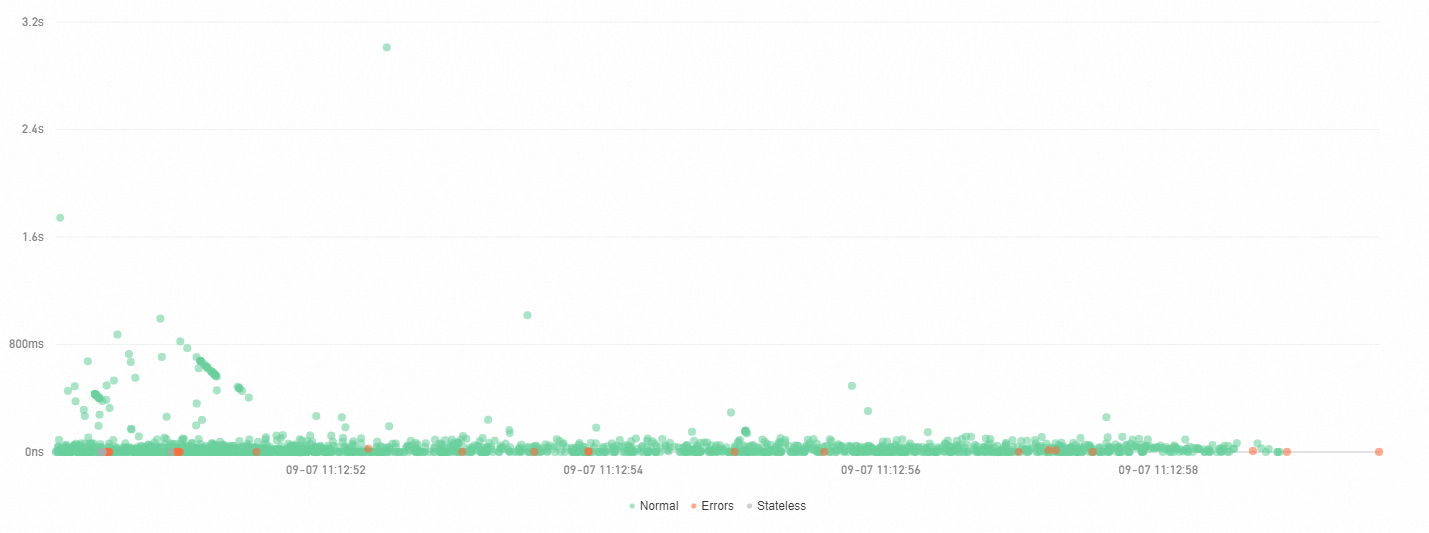
Scatter chart
On the Scatter plot tab, time points are distributed along the X axis and the duration is distributed along the Y axis. You can move the pointer over a point to view the basic information of the trace, and click a point to view trace details.
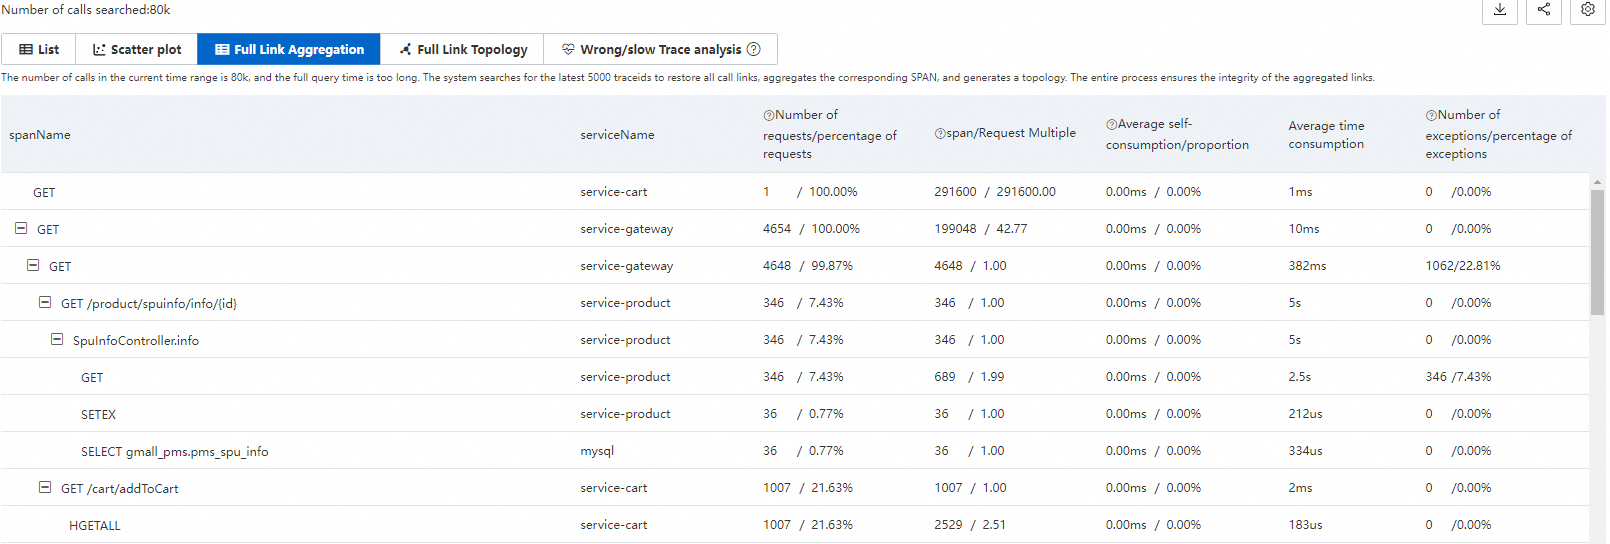
Trace aggregation details
Trace Explorer allows you to analyze a queried span based on various dimensions. However, you may need to analyze traces that consist of a large number of spans. The trace aggregation feature allows you to query up to 5,000 distributed traces by using specified conditions and query the corresponding spans based on the trace IDs. Then, you can aggregate the queried spans to obtain the results. The integrity of the aggregated traces is guaranteed in this process.
When you use the trace aggregation feature, note that aggregate queries are performed on the trace data based on the specified conditions. If you specify multiple query conditions, the calculation may not be completed in real time. We recommend that you wait patiently.
Parameter | Description |
spanName | The name of the span. |
serviceName | The name of the application that corresponds to the span. |
Number of requests/percentage of requests | The request ratio indicates the ratio of the requests that call the current span to the total number of requests. For example, 10% indicates that 10% of requests call the current span. Formula: Request ratio = Number of requests that call the current span/Total number of requests × 100% |
span/Request Multiple | The request multiple indicates the average number of times that the current span is called by each request. For example, 1.5 indicates that the current span is called 1.5 times by each request. Formula: Request multiple = Number of spans/Number of requests |
Average self-consumption/proportion | The self-time of a span excludes the time spent in its child spans. For example, if Span A takes 10 milliseconds and its child span (Span B) takes 8 milliseconds, the average self-time of Span A is 2 milliseconds. Formula: Average self-time of a span = Total time of the span - Time spent in all child spans Important For asynchronous calls, the self-time of a span is equal to the total time of the span. |
Average Duration | The average duration of the span. |
Number of exceptions/percentage of exceptions | The exception ratio indicates the ratio of requests with exceptions to the total number of requests. For example, 3% indicates that exceptions occur in 3% of requests. Formula: Number of requests with exceptions/Total number of requests Important The number of requests with exceptions is not equal to the number of exceptions. If the request multiple is greater than 1, a request may have multiple exceptions. |
Example: Span A calls Span B and Span C. The following table shows the parameters.
spanName | serviceName | Number of requests/percentage of requests | span/Request Multiple | Average self-consumption/proportion | Average Duration | Number of exceptions/percentage of exceptions | |
A | - | demo | 10/100.00% | 10/1.00 | 5.00ms/25.00% | 20ms | 2/20.00% |
- | B | demo | 4/40.00% | 8/2.00 | 16.00ms/100.00% | 16ms | 2/50.00% |
- | C | demo | 1/10.00% | 1/1.00 | 4.00ms/100.00% | 4ms | 1/100.00% |
The Number of requests/percentage of requests parameter of Span A indicates that the total number of requests is 10 and the request ratio is 100%. The Number of requests/percentage of requests parameter of Span B indicates that only 4 requests call Span B. Similarly, only one request calls Span C. The request ratio of Span B is 40% and request ratio of Span C is 10%. Other requests do not call Span B and Span C due to logical judgments or exceptions. This reflects the distribution of requests.
The span/Request Multiple parameter of Span A is 10/1.00, which indicates that Span A is called only once by each request. However, for Span B, eight spans are called by four requests. Therefore, Span B is called twice by each request. This reflects the distribution of spans in each request.
The Average self-consumption/proportion parameter of Span A is 5.00 ms/25.00%, which indicates that the average self-time of Span A (except Span B and Span C) is 5 milliseconds. The average self-time of Span A accounts for only 25% of the overall average time. However, the average self-time of Span B and Span C is equal to their overall average time because Span B and Span C do not have child spans. This reflects the distribution of average duration.
The Number of Exceptions / Exception Ratio parameter of Span A is 2/20.00%, which indicates that Span A has two exceptions, accounting for 20% of the total number of requests. The Number of exceptions/percentage of exceptions parameter of Span B is 2/50.00%. Given that each request calls Span B twice, the total number of requests is 4, and the exception ratio is 50%, two requests have exceptions. Therefore, the distribution of exceptions in Span B may be: Among the total four requests, two requests are successful. Among the remaining two requests, an exception occurs in the first call of each request whereas the second call is successful.
To view the details of a specific trace, move the pointer over the blue span name. You can click the recommended trace ID to view the details.
Trace topology
The Full Link Topology tab displays the inter-application topology of aggregated traces. The following figure shows that the two applications have call relationships. The following information is displayed for each application: the number of requests, the number of errors, and the response time.

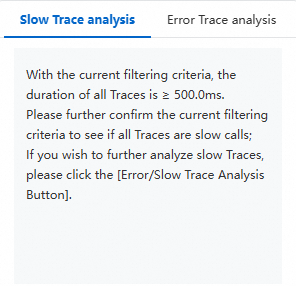
Failed/Slow trace analysis
For use cases of failed/slow trace analysis, see Troubleshoot application exceptions by using failed/slow trace analysis.
Failed/slow trace analysis is generally used for feature extraction of abnormal traces, and further root cause analysis and localization. It mainly provides two types of analysis: slow trace analysis and failed trace analysis.
By specifying a group of trace lists, the backend uses intelligent algorithms to compare the selected traces with baseline traces, extract and display dimensional analysis data with high feature values, which helps analyze and troubleshoot abnormal root causes.
Slow trace analysis
ARMS analyzes 1,000 traces with the longest duration and displays five dimensions that are most related to slow traces.
Failed trace analysis details
ARMS compares failed traces with normal traces and discovers three characteristics that are most related to failed calls.
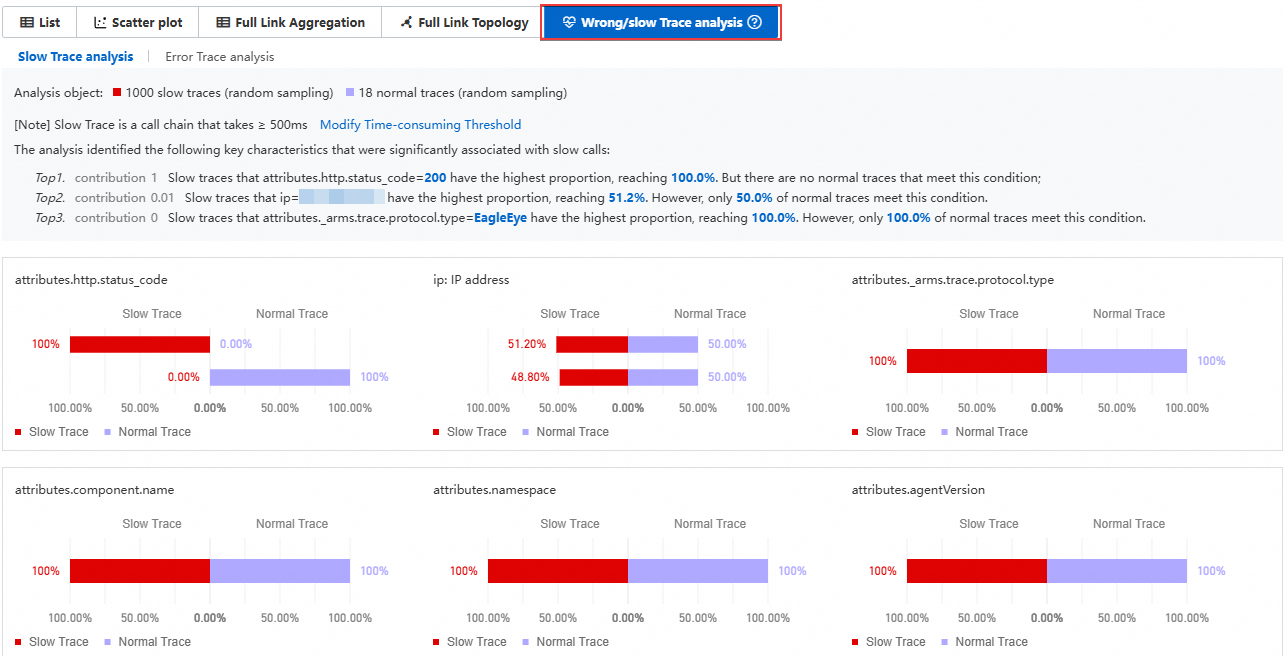
The default duration for slow traces is 500 milliseconds. Click Modify Duration Threshold to modify the duration.
The top three dimensions that are most related to slow traces are listed, and the differences in the proportions of these factors in slow traces and normal traces are displayed.
In the specific dimension area, you can view the top three dimensions that are most related to slow traces of the interface.
Click the column chart corresponding to the slow trace or normal trace of the target dimension, and then drill down to analyze the related traces.
Failed trace analysis
Failed trace analysis
ARMS randomly selects and analyzes 1,000 failed traces, and displays five dimensions that are most related to the traces.

Failed trace analysis details
ARMS compares failed traces with normal traces and discovers three characteristics that are most related to failed calls.
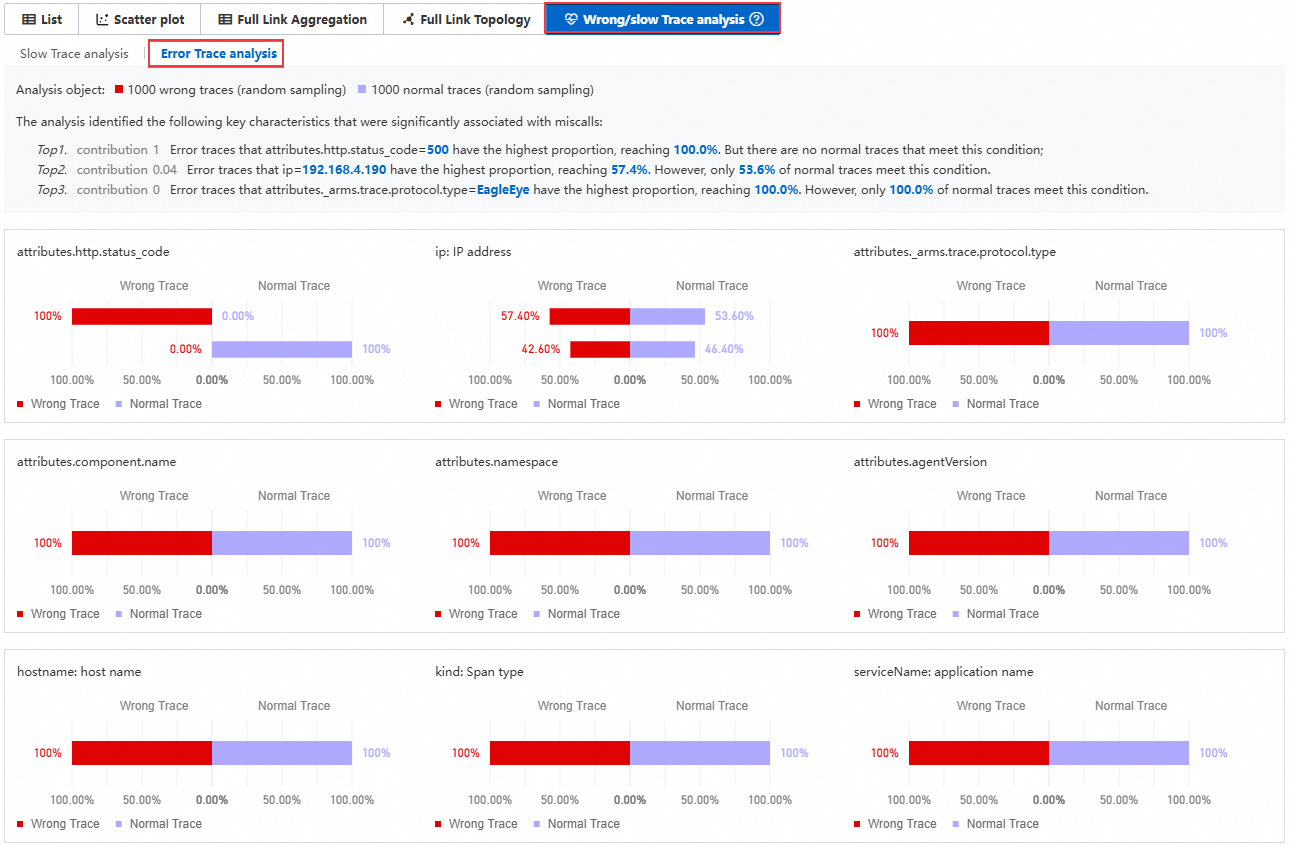
The top three dimensions that are most related to slow traces are listed, and the differences in the proportions of these factors in slow traces and normal traces are displayed.
In the specific dimension area, you can view the top three dimensions that are most related to slow traces of the interface.
Click the column chart corresponding to the slow trace or normal trace of the target dimension to drill down to analyze the related traces.
Custom development
Trace data is stored in SLS. The project name is proj-xtrace-<encode>-<region-id>. The Logstore name is logstore-tracing. The region-id parameter is the region where you use Trace Explorer, for example, cn-hangzhou. For information about data formats, see Trace Explorer parameters. You can perform custom development on the stored full trace data. You can analyze the stored full trace data based on filter conditions or aggregation dimensions. This way, the requirements of custom diagnostics in various scenarios can be met. For more information, see Analyze trace data in real time by using Trace Explorer.
FAQ
The SQL statement in the trace is incomplete
ARMS records a maximum of 1,024 characters for an SQL statement by default. You can adjust this default value as needed in the Database Call Configuration section on the Custom Configuration page.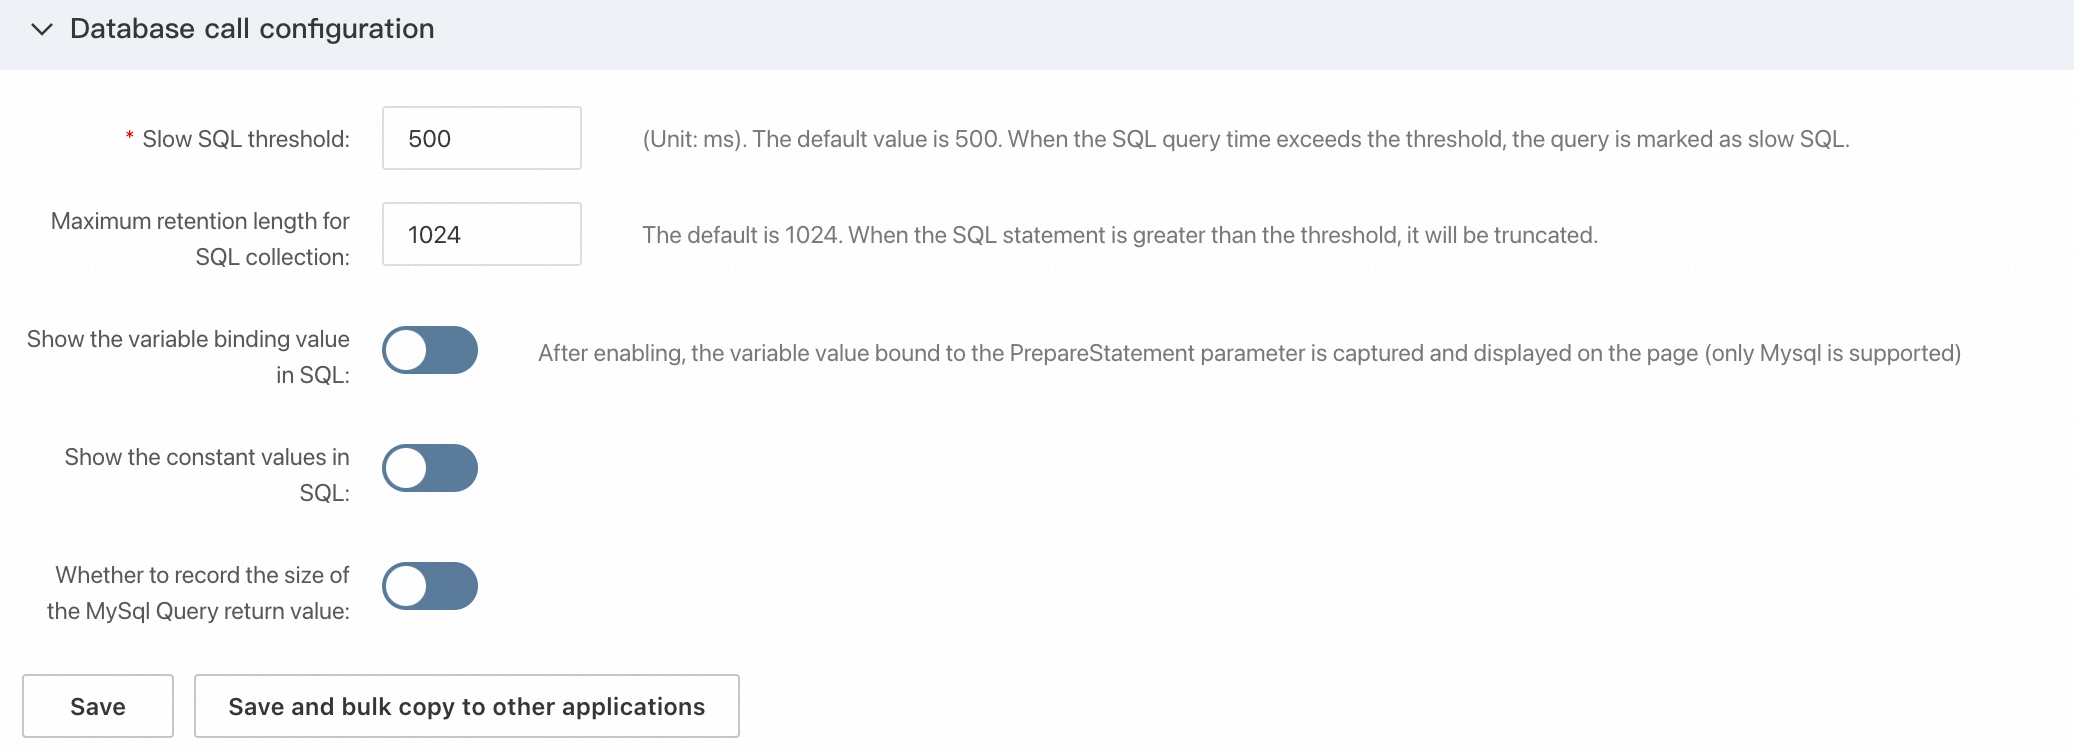
After upgrading to Agent 4.x, many spans that access Nacos with a duration of 30 seconds appear
This type of span generally occurs when an application depends on Nacos. The Nacos backend cyclically performs configuration updates or service discovery through HTTP long polling. Agent 3.x ignores internal HTTP calls without an entry point and does not generate spans. However, Agent 4.x supports generating spans for internal calls in scenarios without an entry point. For more information, see [Agent Upgrade] Announcement on the upgrade of ARMS Application Monitoring Agent 4.x.
If you do not want to record this type of span, you can filter it in Interface Call Settings on the Custom Configuration page.
This feature requires Agent 4.2.x or later.
