In a production environment, application exceptions, such as the sudden increase in the response time and error rates of applications, have various reasons, including uneven traffic, instance failures, program exceptions, and dependency failures. Comprehensive performance optimization is required before an application is released or a promotion is implemented. Performance bottlenecks need to be identified, and the interfaces or components that often fail or consume excessive time need to be optimized. This topic describes how to use slow and failed traces to troubleshoot failed and slow calls and locate performance bottlenecks.
Prerequisites
An Application Real-Time Monitoring Service (ARMS) agent is installed for the application. For more information, see Application Monitoring overview.
The new ARMS console is used.
Use the demo of the new ARMS console
Troubleshoot failed calls based on failed traces
Step 1: Identify the time period
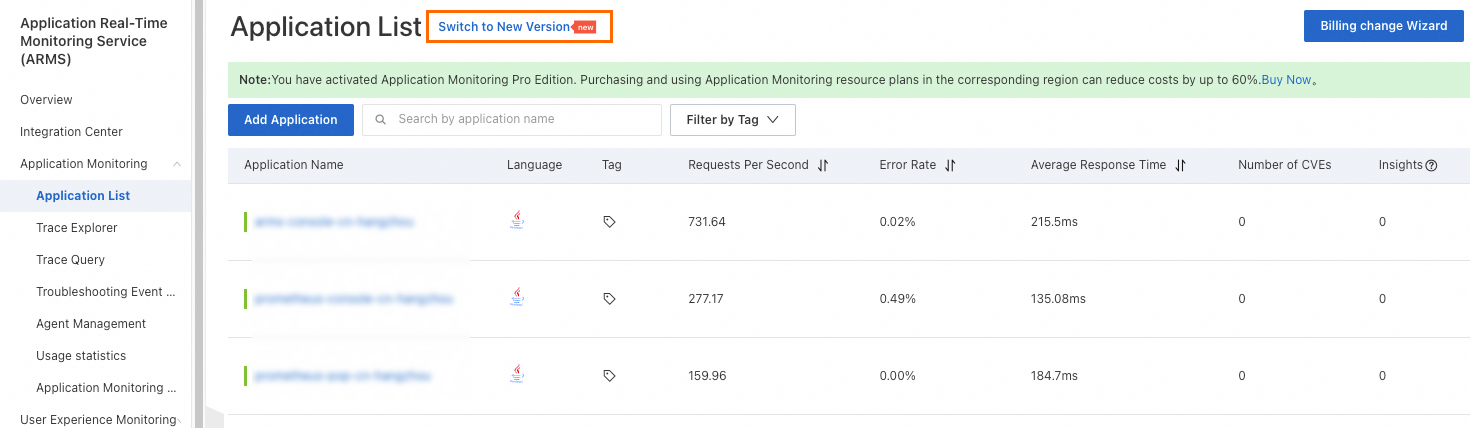
Log on to the ARMS console. In the left-side navigation pane, choose .
On the Application List page, select a region in the top navigation bar and click the name of the application that you want to manage.
NoteIf the
 icon is displayed in the Language column, the application is connected to Application Monitoring. If a hyphen (-) is displayed, the application is connected to Managed Service for OpenTelemetry.
 In the top navigation bar, click the Trace Explorer tab.
NoteThe Trace Explorer tab is available in the new ARMS console. For information about how to use the new console, see the Prerequisites section.
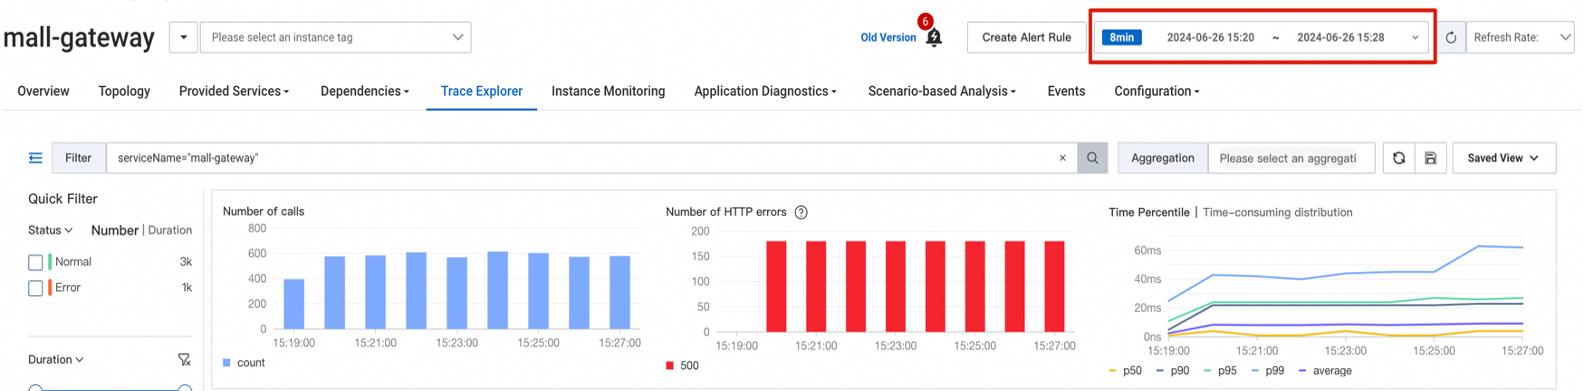
As shown in the following figure, some HTTP errors occurred in the sample application mall-gateway between 15:20 and 15:28.

Use the preceding time range for troubleshooting.
Step 2: Locate the interfaces or components
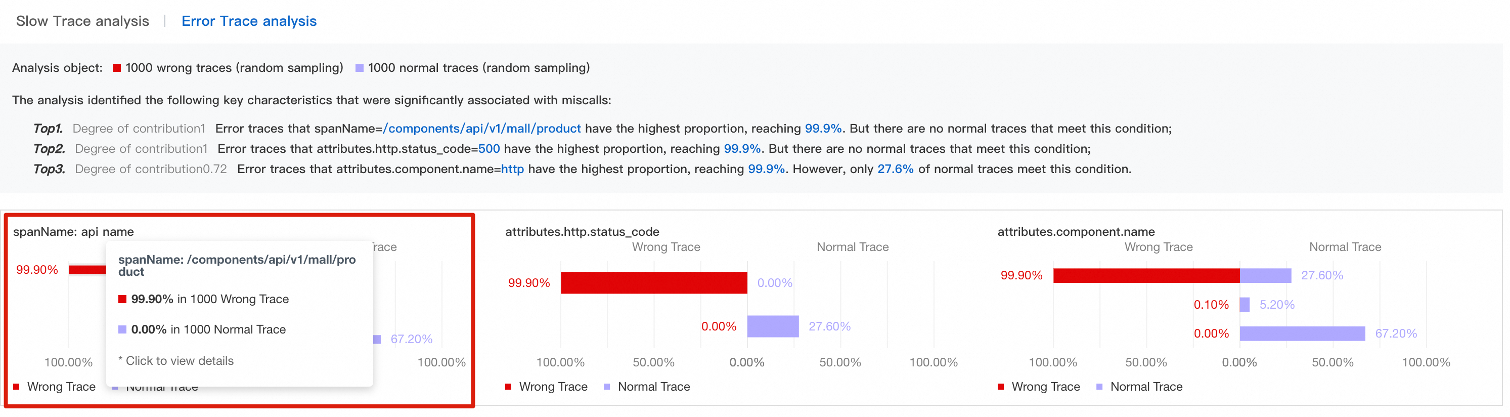
As shown on the Wrong/slow Trace analysis tab, the failed traces are mainly concentrated in the /components/api/v1/mall/product interface, and the error code 500 was returned for these traces.

Troubleshoot the/components/api/v1/mall/product interface
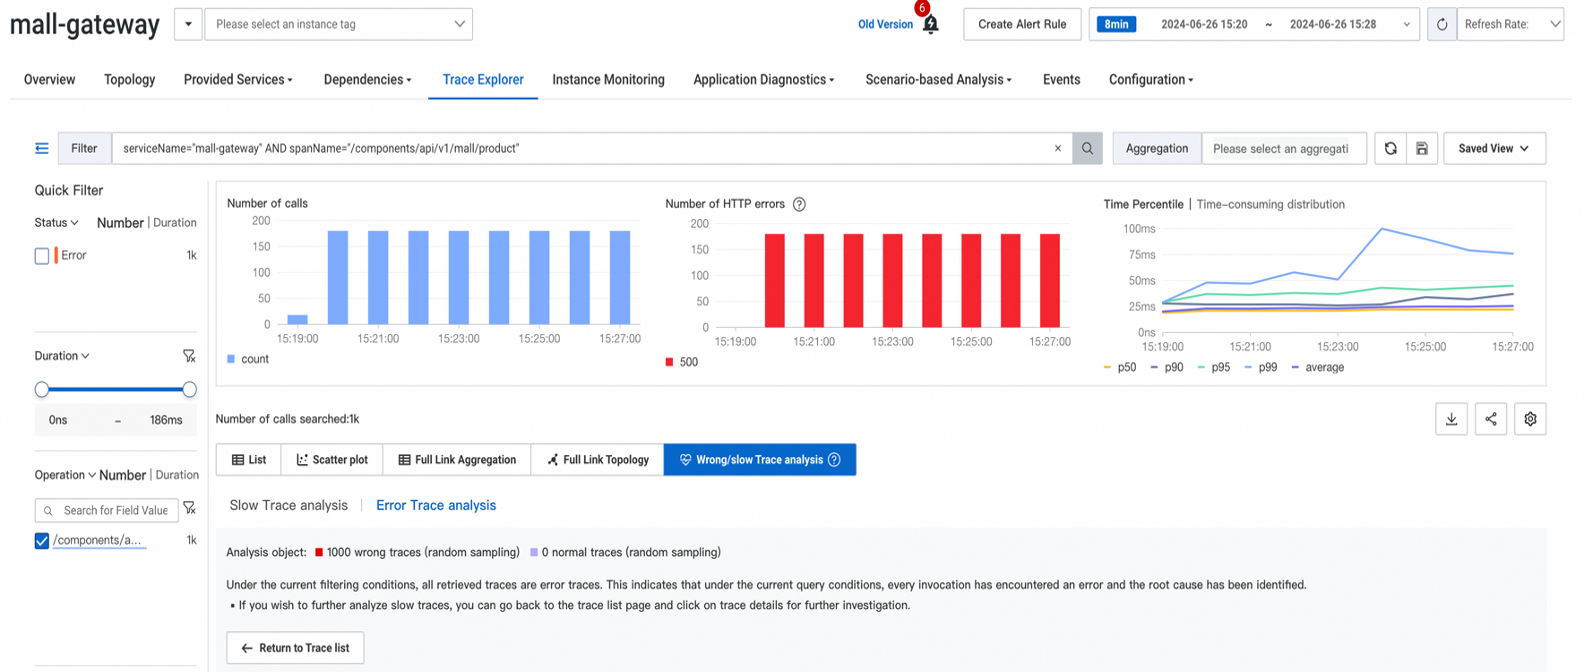
In the spanName chart, click spanName: /components/api/v1/mall/product.
The
serviceName="mall-gateway" AND spanName="/components/api/v1/mall/product"filter condition is automatically added.As shown in the query results, all the traces related to the /components/api/v1/mall/product interface failed.
On the List tab, find a trace and click Details in the Actions column to view the trace details.

Troubleshoot slow calls based on slow traces
Step 1: Identify the time period
Log on to the ARMS console. In the left-side navigation pane, choose .
On the Application List page, select a region in the top navigation bar and click the name of the application that you want to manage.
NoteIf the
icon is displayed in the Language column, the application is connected to Application Monitoring. If a hyphen (-) is displayed, the application is connected to Managed Service for OpenTelemetry. In the top navigation bar, click the Trace Explorer tab.
As shown in the following figure, the sample application mall-user-server has various slow calls that consume more than 5 seconds between 15:40 and 15:49.

Use the preceding time range for troubleshooting.

On the Wrong/slow Trace analysis tab, click Modify Time-consuming Threshold to change the threshold to 5000 ms.

Step 2: Locate the interfaces or components
As shown on the Wrong/slow Trace analysis tab, the slow traces are concentrated in the /components/api/v1/http/success interface and reported through EagleEye, and the interface is deployed in the arms-test namespace.

Troubleshoot the /components/api/v1/http/success interface
In the spanName chart, click spanName: /components/api/v1/http/success.

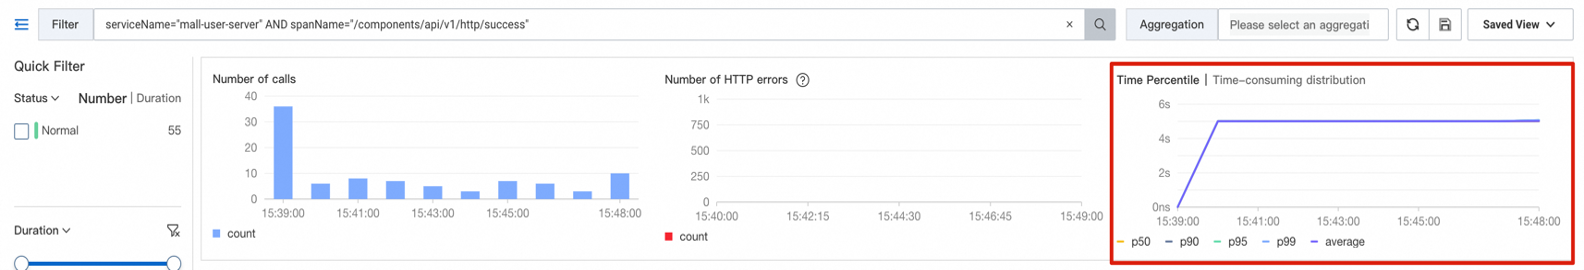
The serviceName="mall-user-server" AND spanName="/components/api/v1/http/success" filter condition is automatically added.
As shown in the query results, each call takes more than 5 seconds, and the /components/api/v1/http/success interface is the root cause of the slow calls.

As shown in the Time Percentile chart, the average call duration exceeds 5 seconds.
Troubleshoot spans reported through EagleEye
In the attributes._arms.trace.protocol.type chart, click attributes._arms.trace.protocol.type: EagleEye.

The serviceName="mall-user-server" AND attributes._arms.trace.protocol.type="EagleEye" filter condition is automatically added.
As shown in the query results, all the slow traces are concentrated in the /components/api/v1/http/success interface.

Configure the /components/api/v1/http/success interface as a filter condition. As shown in the query results, each call takes more than 5 seconds.
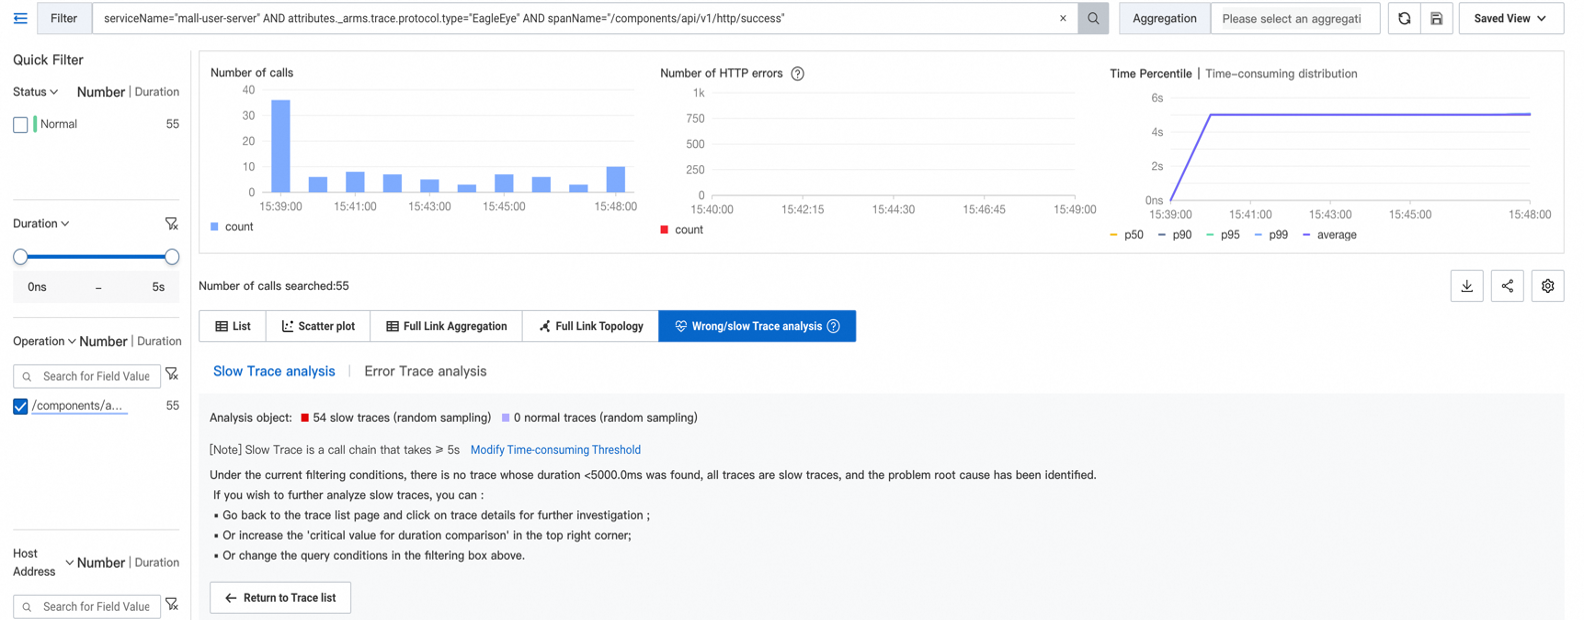
As shown in the Time Percentile chart, the average call duration exceeds 5 seconds.
Troubleshoot the spans related to the arms-test namespace
As shown in the query results of the serviceName="mall-user-server" AND attributes.namespace="arms-test" filter condition, all the slow traces are concentrated in the /components/api/v1/http/success interface.
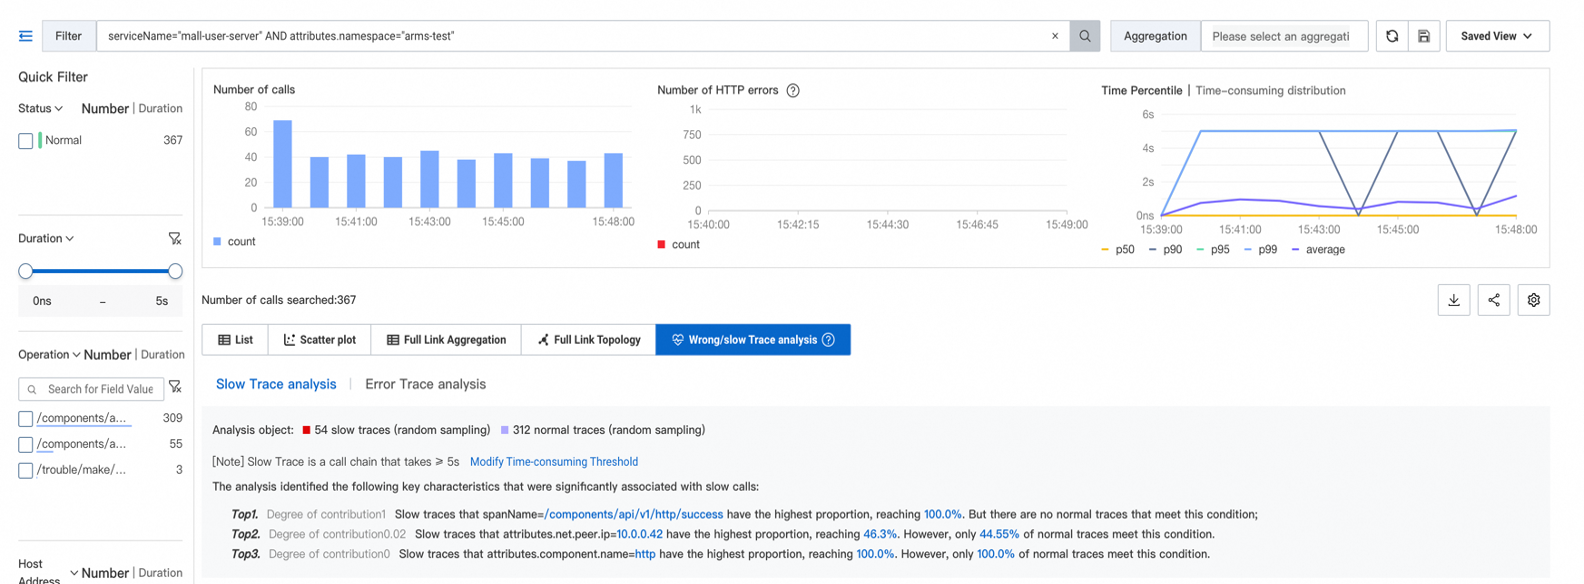
Configure the /components/api/v1/http/success interface as a filter condition. As shown in the query results, each call takes more than 5 seconds.

Based on the troubleshooting, a conclusion can be drawn that all the slow traces are concentrated in the /components/api/v1/http/success interface. The /components/api/v1/http/success interface is deployed in the arms-test namespace, and the traces are reported through EagleEye.