When your application encounters uneven traffic, instance failures, or slow endpoints, Trace Explorer helps you pinpoint the root cause. It also supports service traffic analysis and canary release monitoring. The following five scenarios show how to use Trace Explorer for common diagnostic tasks.
Trace Explorer in the ARMS tracing stack
Application Real-Time Monitoring Service (ARMS) provides three layers of trace analysis:
| Layer | What it does | Best for |
|---|---|---|
| Individual traces | Troubleshoot errors in a single request | Debugging a specific failed request |
| Pre-aggregated metrics | Monitor services and trigger alerts | Dashboards and alerting |
| Trace Explorer (post-aggregation) | Combine filters and grouping dimensions for real-time analysis on full trace data | Custom diagnostics across many requests |
Trace Explorer fills the gap between single-trace debugging and pre-aggregated dashboards. Trace Explorer combines filter conditions and aggregation dimensions to analyze stored full trace data in real time, so you can answer questions such as:
Which instances handle the most traffic?
Are failed requests concentrated on a single host?
What are the slowest endpoints, and how often are they called?
How does traffic differ between offline and online channels?
Diagnose uneven traffic distribution
Problem: Server Load Balancer (SLB) routes more traffic to some instances than others, which can cause service degradation or unavailability.
Common causes:
Misconfigured SLB settings
Node restart failures due to registry errors
Load factor errors in distributed hash tables (DHTs)
How to diagnose:
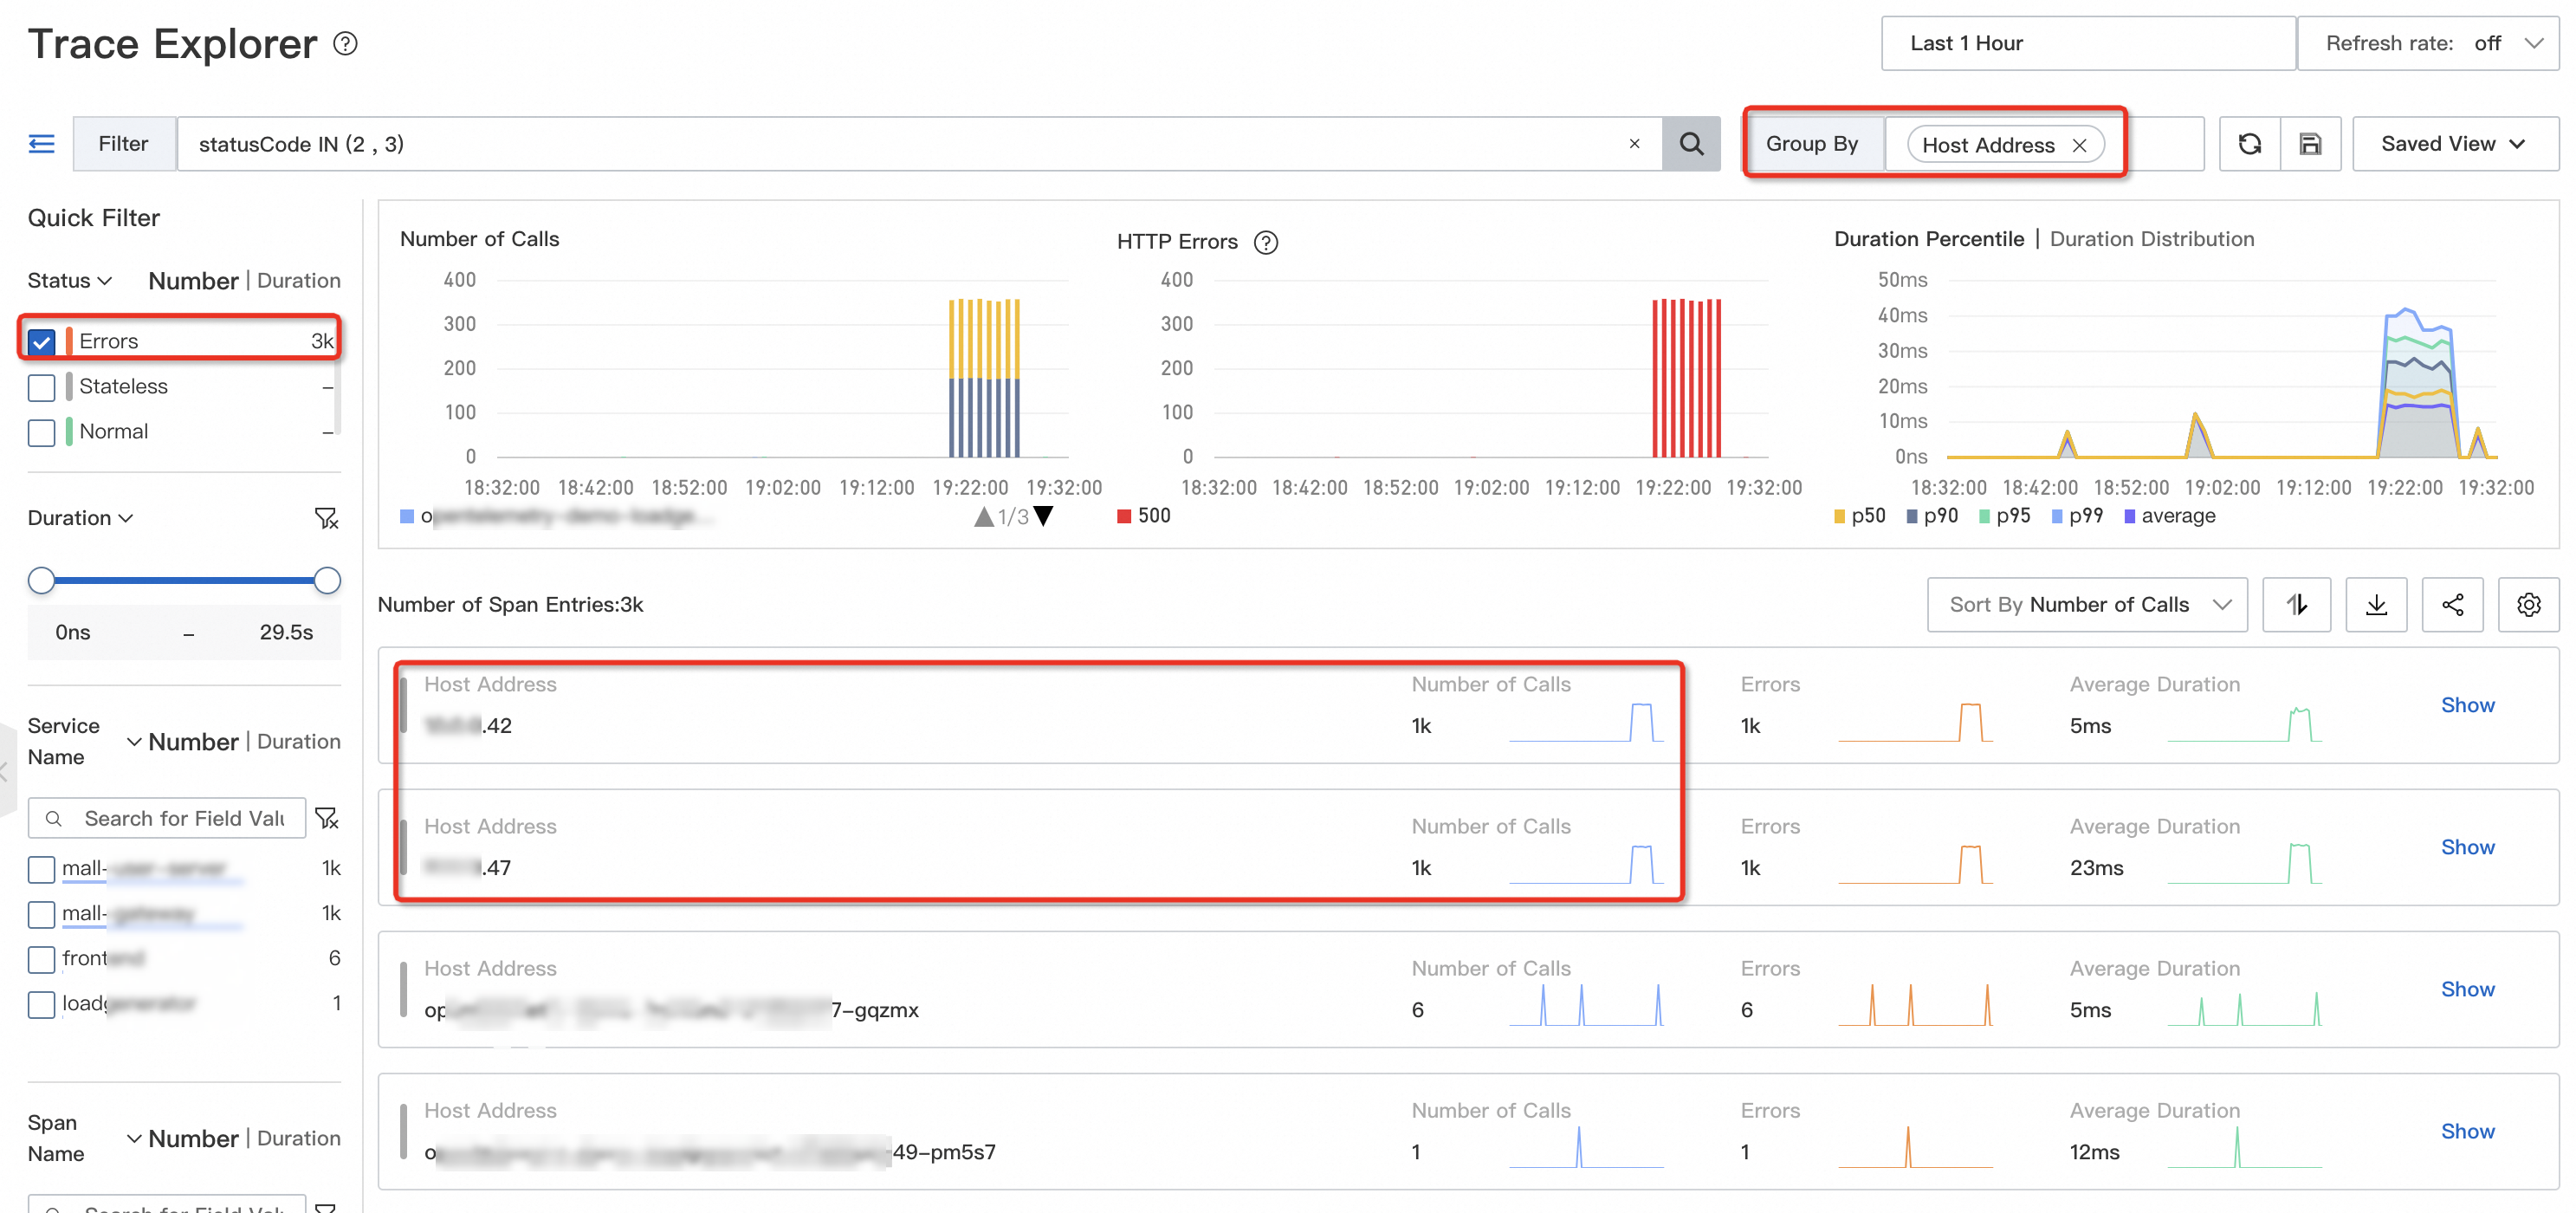
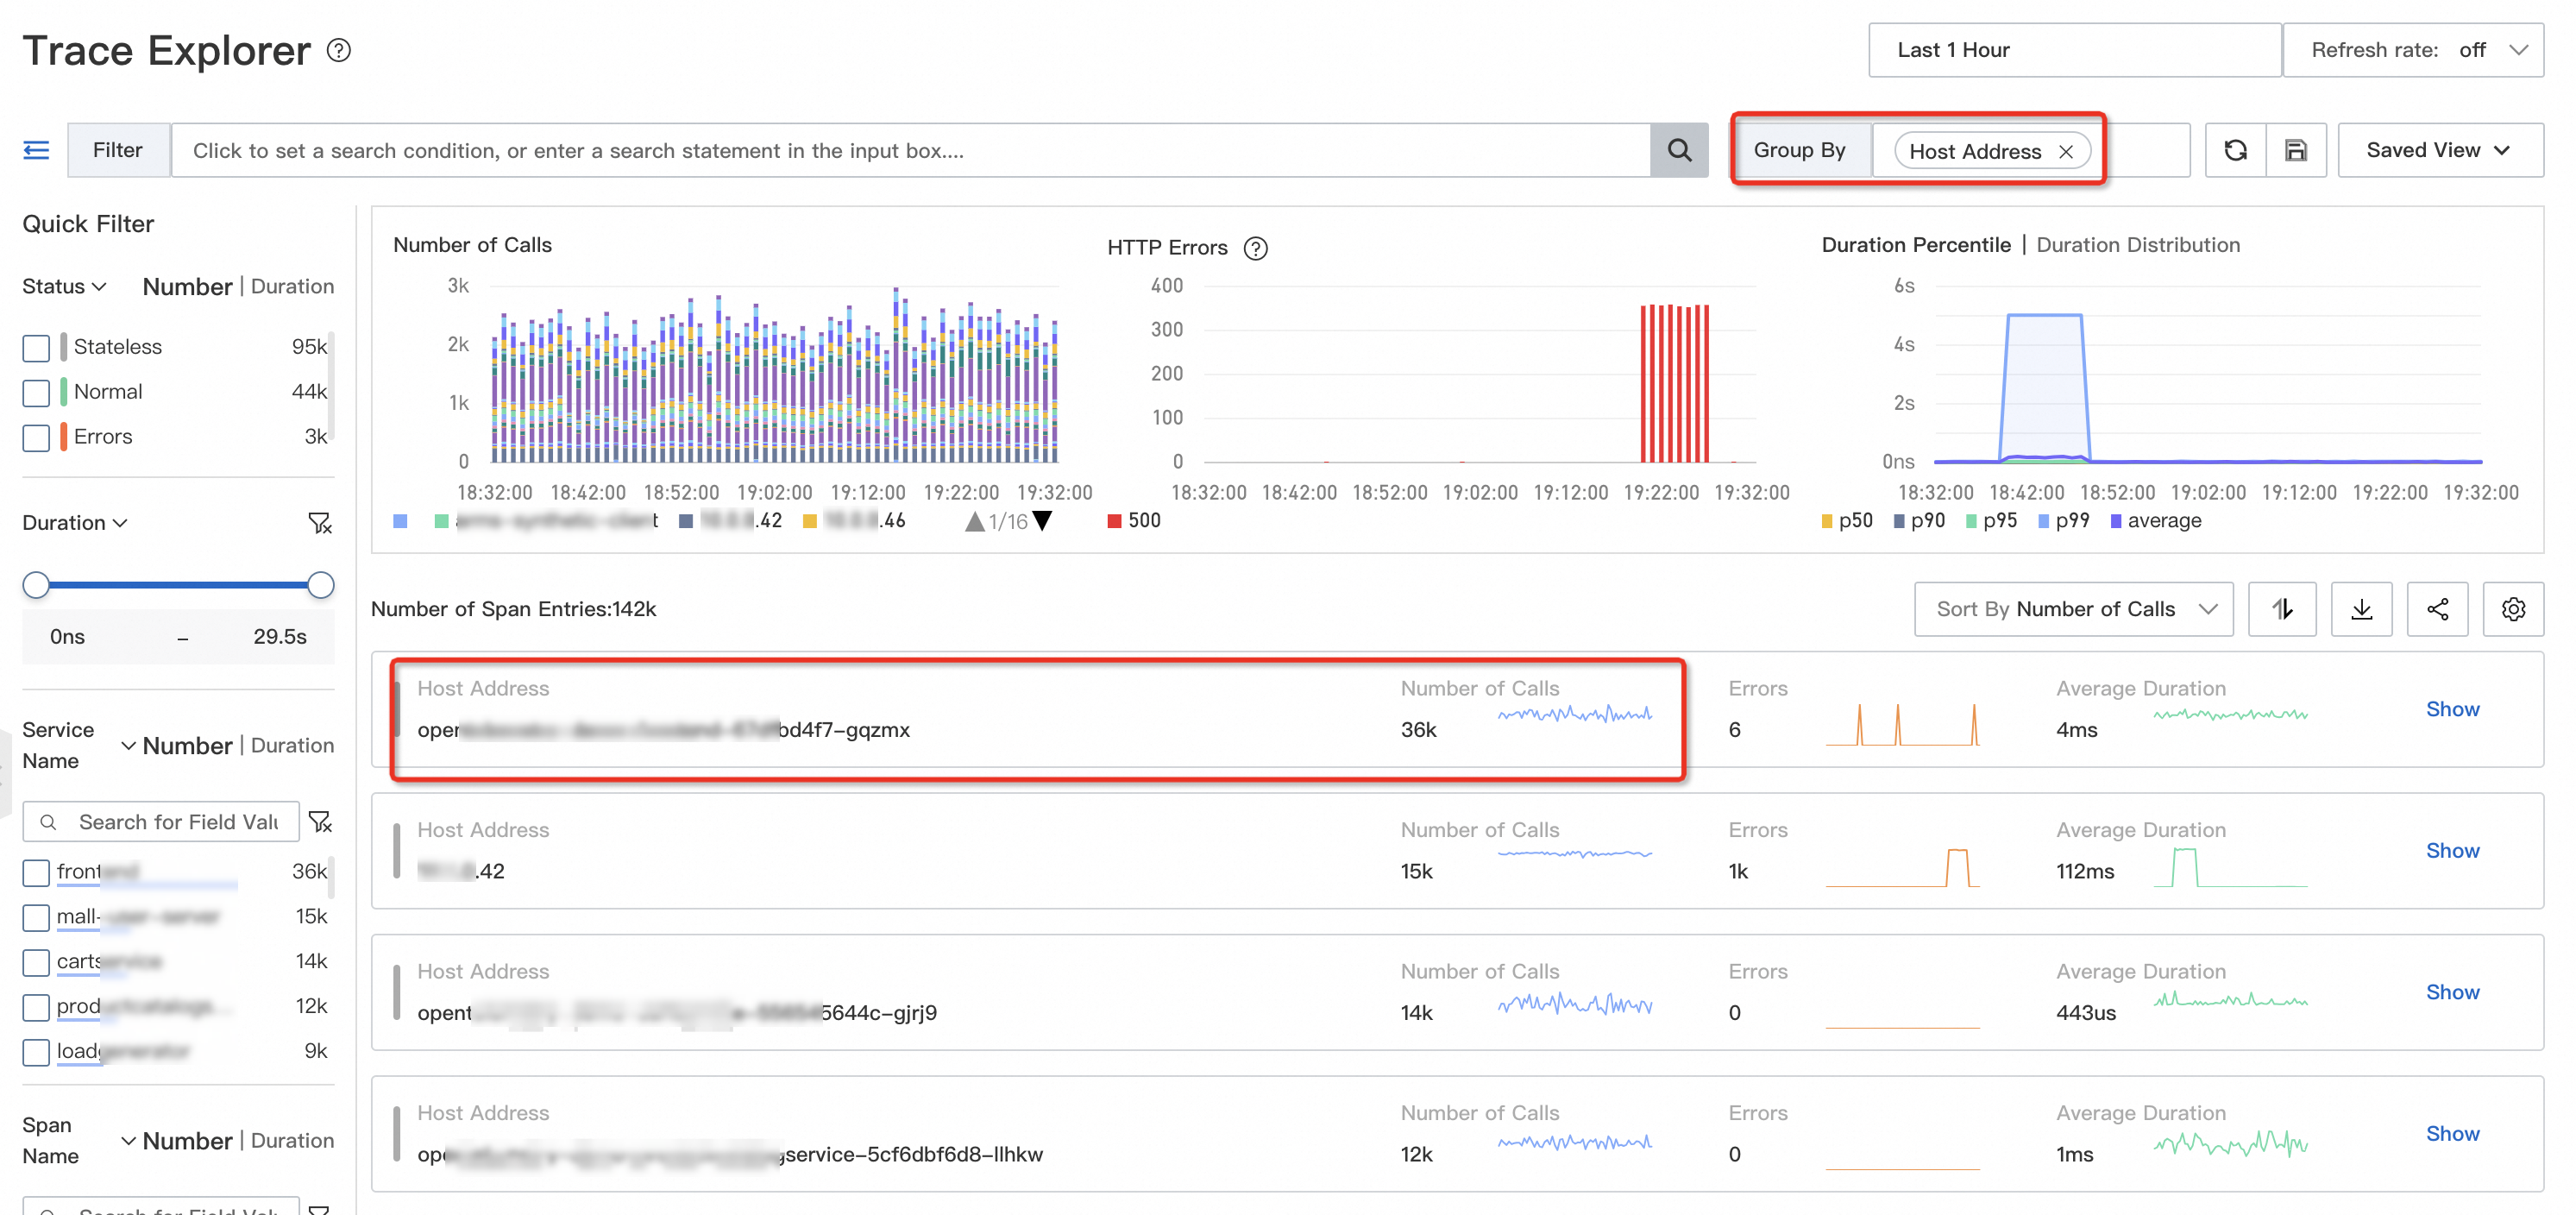
Group trace data by IP address to see how requests are distributed across instances. If a large share of traffic is concentrated on one or a few instances, uneven distribution is likely the cause.
| Filter | Group by | Look for |
|---|---|---|
| (none, or filter by time range) | IP address | Disproportionate request counts on specific instances |
On the Trace Explorer page, group the trace data by IP address. In the following example, most traffic is concentrated on the opentelemetry-demo-frontend-XX instance.

Next step: Review the traffic distribution timeline to identify when the imbalance started, then check SLB configuration or registry status for the affected instances. If needed, roll back the changes in time to restore normal traffic distribution.
Diagnose instance failures
Problem: Hardware or container-level failures cause intermittent request errors or timeouts without triggering a full outage.
Impact: Intermittent request failures and timeouts degrade user experience and increase support costs, but may not surface in aggregate metrics.
Failure types:
| Type | Examples | Scope |
|---|---|---|
| Host failures | CPU overcommitment, hardware damage (for example, network interface controller failure) | Affects all containers on the host |
| Container failures | Disk usage overload, memory leaks | Affects a single container |
| Kubernetes-specific | Node failures, pod failures | Maps to host or container failures |
How to diagnose:
Query failed or timed-out requests, then group by host IP address or container IP address.
| Filter | Group by | Look for |
|---|---|---|
| Status = Error, or Duration > threshold | Host IP address or Container IP address | Failed requests concentrated on a single instance |
On the Trace Explorer page, query failed or timed-out requests and group them by IP address. If errors cluster on a specific instance, that instance likely has a failure.
Interpret the results:
Errors concentrated on one instance: Replace the instance for quick recovery, or inspect its system metrics (disk usage, CPU steal time).
Errors scattered across multiple instances: The issue is probably not instance-specific. Check downstream services or application logic instead.
Diagnose slow endpoints
Problem: Before a release or a major promotion, you need to identify performance bottlenecks: which endpoints are slow and how often they are called.
How to diagnose:
Query endpoints where duration exceeds your threshold (for example, 5 seconds), then group by endpoint name to see which ones are slowest and most frequent.
| Filter | Group by | Look for |
|---|---|---|
| Duration > 5s (or your threshold) | Endpoint name | Endpoints with high latency and high call frequency |
On the Trace Explorer page, query endpoints that take more than 5 seconds and group them by endpoint name.
Common root causes and fixes:
After identifying slow endpoints, analyze their traces, method stacks, and thread pools. Common root causes include:
| Root cause | Symptom | Fix |
|---|---|---|
| Undersized connection pool | Many requests waiting for database or service connections | Increase the maximum thread count in the connection pool |
| Unbatched external calls | Multiple external and internal requests sent sequentially | Merge requests to reduce network round trips |
| Large response payloads | Slow network transfer and deserialization; full garbage collections (GCs) | Replace full queries with paginated queries |
| Synchronous logging | Logging blocks the main thread | Switch to asynchronous logging |
Analyze service traffic by business dimension
Problem: You need to monitor traffic and service quality for specific business segments, such as major customers, stores, or sales channels.
Example: For a retail business, a wrong order or a broken POS machine at a physical store can escalate into a serious incident. Physical stores often have stricter SLA requirements than online channels, so monitoring their traffic and error rates separately is critical.
How to analyze:
Tag your traces with custom attributes to differentiate business dimensions, then use these attributes as filters in Trace Explorer.
For example, tag offline orders with {"attributes.channel": "offline"}. You can define similar attributes for stores, customer tiers, or product categories.
| Filter | Group by | Metric |
|---|---|---|
attributes.channel = offline | Time | Request count, error rate |
This lets you track traffic trends and service quality for each business segment independently.
Monitor canary releases
Problem: You are releasing 500 instances in 10 batches. How do you detect issues after the first batch goes live?
Why it matters: Without canary monitoring, subtle failures can go unnoticed. For example, if a microservice registry fails, newly released instances cannot register. Because overall traffic and latency remain stable (existing instances still serve requests), the issue stays hidden until all batches are affected and the service becomes unavailable.
How to monitor:
Tag each instance version with a custom attribute, such as {"attributes.version": "v1.0.x"}. Then filter traces by attributes.version in Trace Explorer to compare traffic and error rates across versions.
| Filter | Group by | Compare |
|---|---|---|
attributes.version = v1.0.1 (new) | Time | Request count, error rate, latency against v1.0.0 (baseline) |
This gives you real-time visibility into how the new version performs relative to the previous one, so you can catch regressions early and roll back before they spread.
Limitations
Keep these three constraints in mind when using Trace Explorer:
| Limitation | Details | Workaround |
|---|---|---|
| High storage cost | Accurate analysis requires full (unsampled) trace data, which increases storage costs, especially across networks. | Deploy edge nodes in your clusters to cache and pre-process data locally. Separate hot and cold storage on the server side: use Trace Explorer for hot data, and analyze only slow or invalid traces for cold data. |
| Not suitable for alerting | Post-aggregation queries scan full data in real time, so they have high performance overhead and low concurrency. This makes Trace Explorer unsuitable for alert rules that require frequent evaluation. | Generate custom metrics by running post-aggregation statements on the client side, then build alerts and dashboards from those pre-computed metrics. |
| Manual attribute setup | Unlike pre-aggregated application monitoring metrics, Trace Explorer requires you to manually define and instrument custom attributes to differentiate business scenarios. | Plan your attribute schema before instrumentation. Define a consistent naming convention for attributes across services. |
References
Set up alerting for specific endpoints so that your operations team is notified when exceptions occur. For more information, see Application Monitoring alert rules.