A diagnostic report evaluates the health of an ApsaraDB for Redis instance by analyzing performance metrics, request distribution, and slow query data. Use it to identify anomalies and act on them before they affect your business.
Prerequisites
Before you begin, ensure that you have:
-
Run diagnostics on the instance. For instructions, see Perform diagnostics on an instance
Report sections
A diagnostic report has four sections:
-
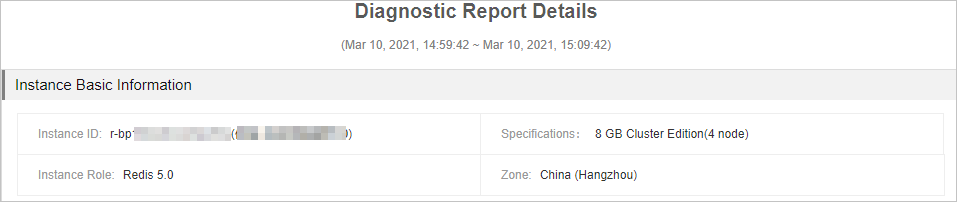
Basic instance information: the instance ID, instance type, engine version, and the zone where the instance is deployed
-
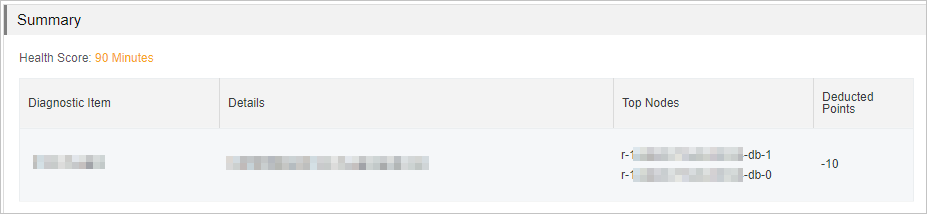
Summary: the instance health score and a breakdown of deductions
-
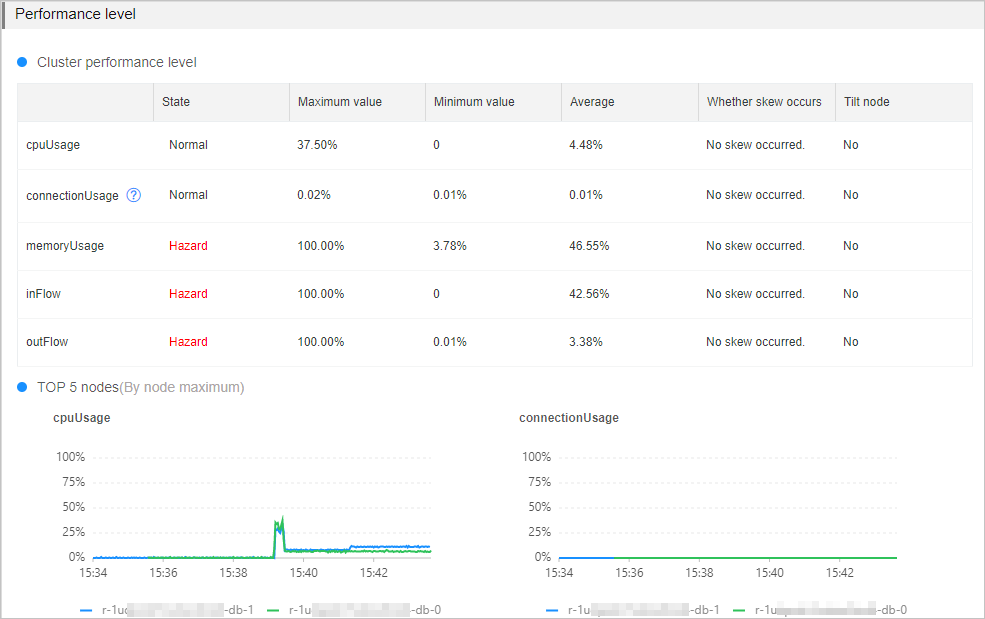
Performance level: the current state of key performance metrics
-
TOP 10 nodes that receive the greatest number of slow queries: the top 10 data nodes by slow query count, with details about those queries
Basic instance information
This section displays the instance ID, instance type, engine version, and the region where the instance is deployed.
Summary
This section shows the overall health score of the instance. The maximum score is 100. Scores below 100 list the diagnostic items that caused deductions and explain why.
Performance level
This section shows the current state of key performance metrics. Pay close attention to any metric in the Hazard state — sustained readings above the threshold can degrade throughput and increase latency.
For instances running in a cluster architecture or read/write splitting architecture, check whether metrics are unevenly distributed across data nodes. Review the Top 5 Nodes curve charts for each metric to identify which nodes are under the highest load. For architecture details, see Cluster master-replica instances and Read/write splitting instances.
The following table describes each performance metric, its threshold, the business impact of exceeding that threshold, and how to troubleshoot.
| Metric | Threshold | Applies to | Impact | Possible causes and next steps |
|---|---|---|---|---|
| CPU utilization | 60% | All architectures | High CPU utilization reduces throughput and increases response time. Clients may become unresponsive. | Causes: high-complexity commands, hotkeys, or frequent connection creation. See Troubleshoot high CPU utilization on an instance. |
| Memory usage | 80% | All architectures | Sustained high memory usage increases response time, destabilizes queries per second (QPS), and triggers frequent key eviction. | Causes: memory exhaustion or a large number of large keys. See Troubleshoot high memory usage on an instance. |
| Connections usage of data nodes | 80% | Cluster instances in direct connection mode only. When clients connect through proxy nodes, monitor connections at the proxy node level instead. See Enable the direct connection mode and View performance monitoring data. | When connections reach the limit, new connection requests time out or fail. | Causes: traffic spikes or idle connections not released. See Instance sessions. |
| Inbound traffic | 80% | All architectures | When traffic exceeds the bandwidth provided by the instance type, client performance degrades. | Causes: workload spikes or large keys being read or written frequently. See Troubleshoot high traffic usage on an instance. |
| Outbound traffic | 80% | All architectures |
Skewed request distribution
For instances running in the cluster architecture or read/write splitting architecture, the report also checks whether requests are evenly distributed across data nodes. If skewed requests are detected for a metric, identify which nodes are receiving the uneven load.
The report flags skewed requests when both of the following conditions are met:
-
Peak values across all data nodes exceed the minimum thresholds below:
-
CPU utilization: 10%
-
Memory usage: 20%
-
Inbound and outbound traffic: 5 Mbit/s
-
Connection usage: 5%
-
-
The balance score exceeds 1.3. The balance score is calculated as:
max{average performance value of all data nodes} / median performance value of all data nodes. For example, an instance has four data nodes with average CPU utilization of 10%, 30%, 50%, and 60%. The median is 40%, and the balance score is 60% / 40% = 1.5. Because 1.5 > 1.3, the report considers CPU utilization skewed.
| Possible cause | Troubleshooting method |
|---|---|
| A data node has excessive large keys. | Use the offline key analysis feature or the top key statistics feature to identify and redistribute them. |
| A data node has hotkeys. | Use the top key statistics feature to identify hotkeys. |
| Hash tags are improperly configured. Keys with the same hash tag are always placed on the same data node. If many keys share a hash tag, that node becomes overloaded. | Review and adjust your hash tag configuration to spread keys across nodes. |
TOP 10 nodes that receive the greatest number of slow queries
This section lists the top 10 data nodes by slow query count and provides details about those queries. The report draws from two sources of slow log data:
-
System audit logs: slow logs retained for 4 days
-
Data node logs: the most recent 1,024 log entries, stored directly on each data node. Connect to the instance using redis-cli and run the
SLOWLOG GETcommand to retrieve them.
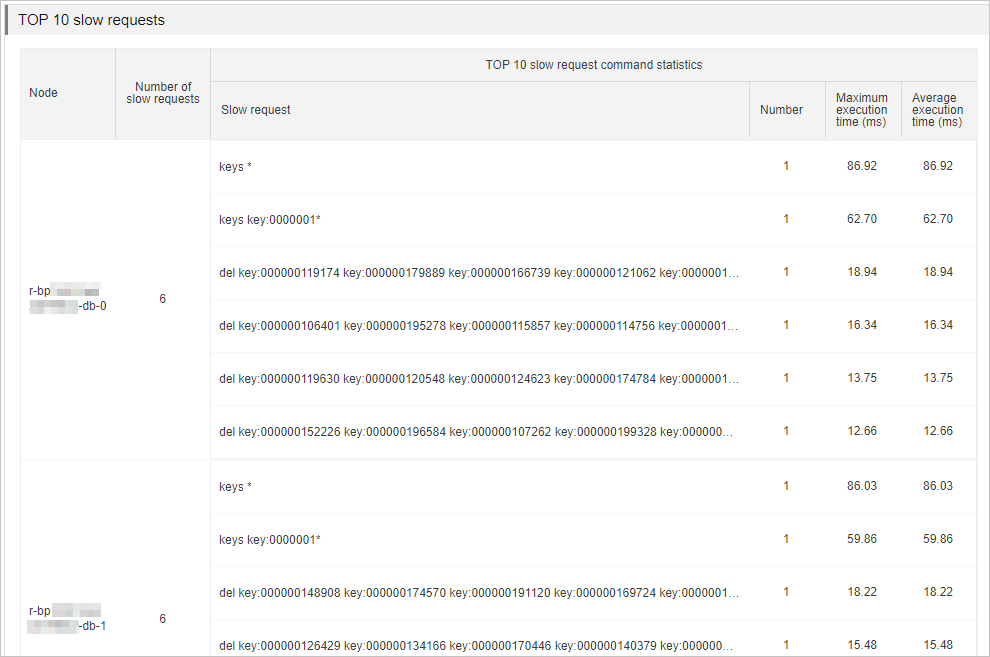
Use the slow query data to identify commands that are causing performance problems.
| Cause | Solution |
|---|---|
Commands with O(N) time complexity or high CPU cost, such as KEYS * |
Evaluate and disable high-risk commands such as FLUSHALL, KEYS, and HGETALL. See Disable high-risk commands. |
| Large keys being read from or written to data nodes frequently | Analyze the large keys using the offline key analysis feature, then split them based on your business requirements. |