When a Tair (Redis OSS-compatible) cluster instance sends a memory alert but the console monitoring page shows low memory usage, the most likely cause is a monitoring level mismatch: the alert reflects a single data node's usage, while the monitoring page displays instance-level data.
Symptoms
Symptom 1: Alert fires, but the monitoring page shows low memory usage
A memory alert indicates that memory usage exceeds the threshold (for example, the average value is greater than or equal to 90% for three consecutive measurements). The Performance Monitoring page in the console, however, shows memory usage well below the threshold.
Symptom 2: OOM error, but the monitoring page shows available memory
Your application throws a command not allowed when used memory > 'maxmemory' out-of-memory (OOM) exception, but the Performance Monitoring page shows that memory is not fully occupied—or that only one data node has high memory usage.
Root cause: monitoring level mismatch
Both symptoms may occur on cluster instances when you check monitoring data at the instance level instead of the data node level.
Check the alert details. If the alert contains nodeId = <Instance ID>-db-<Number>, only the data node identified by that ID has exceeded the memory threshold—not the entire instance.
To verify this:
Log on to the console and go to the Instances page. Select the region where the instance resides, find the instance, and click its ID.
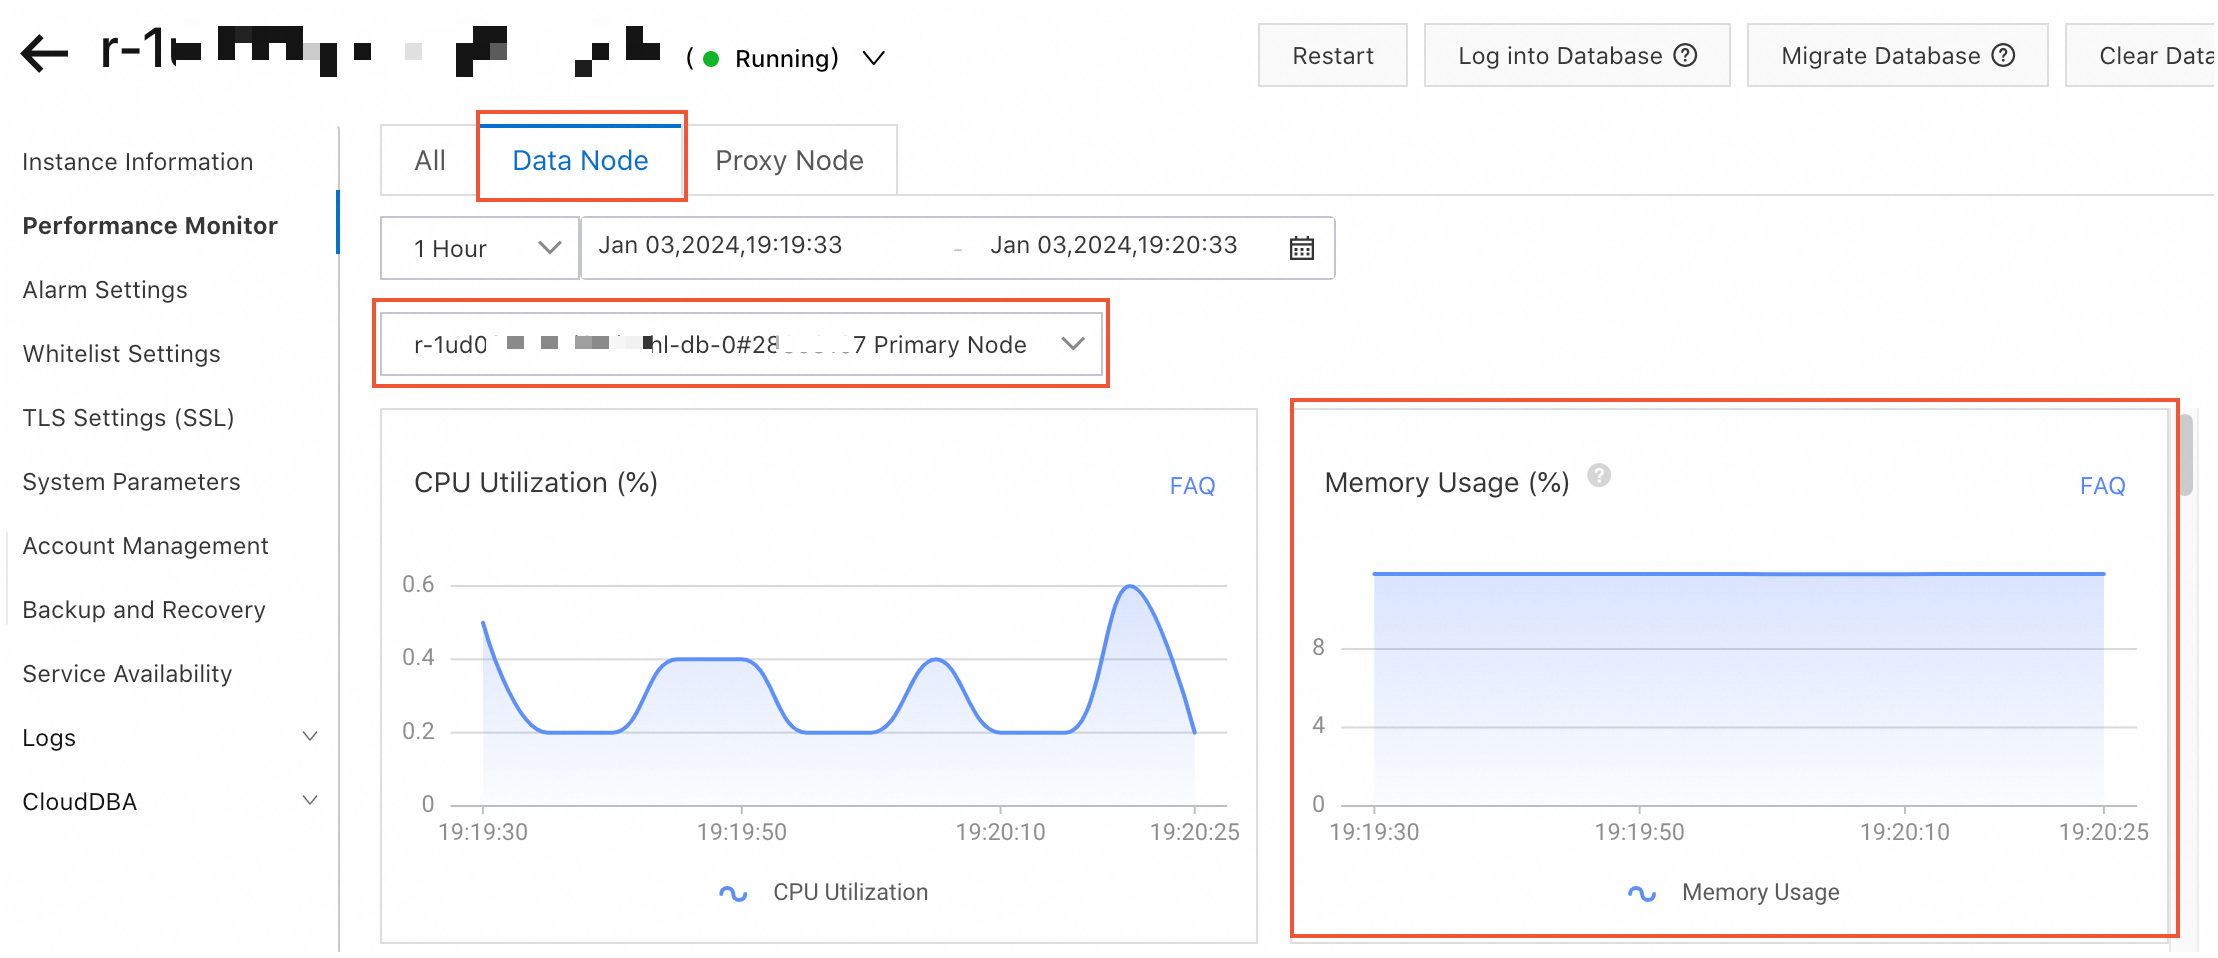
In the left-side navigation pane, click Performance Monitoring.
Click the Data Node tab and select the data node that matches
<Instance ID>-db-<Number>. Check whether the memory usage shown matches the value in the alert.

Why one data node uses more memory than others
If a single data node consistently uses more memory than other data nodes in the cluster, the instance has memory skew. Use the instance diagnostics feature to check for data skew.
Memory skew in cluster instances is typically caused by one of two issues:
Large keys
The cluster uses the cyclic redundancy check (CRC) algorithm to assign each key to a slot, then writes data to the data node that owns that slot. If a key stores a very large number of fields, or fields that are large in size, that key alone can cause significant memory imbalance across data nodes—even when keys are otherwise evenly distributed.
Hash tags
When keys use hash tags (for example, user:{1000}:name), CRC calculation runs on the string inside the curly braces. All keys sharing the same hash tag map to the same slot and land on the same data node.
If many keys share identical hash tags, data concentrates on a single data node and causes memory skew.
Solutions
Identify and split large keys
Use the offline key analysis feature to identify large keys. For guidance on handling them, see Identify and handle large keys and hotkeys.
To reduce memory skew, split large keys into smaller ones. For example, split a HASH key that contains tens of thousands of members into multiple HASH keys with a manageable number of members each. This distributes the data across multiple shards.
Adjust hash tag usage
If hash tags are causing data to concentrate on a single data node, consider splitting a hash tag into multiple hash tags based on your business requirements. This way, data is evenly distributed across different data nodes.
Upgrade instance specifications
Increasing the memory allocated to each shard can relieve memory pressure as a temporary measure. For details, see Change the configurations of an instance.
Before upgrading, be aware of the following:
The system runs a data skew precheck during the specification change. If the selected instance type cannot accommodate the current skew, the system reports an error. Select a higher-specification instance type and try again.
After the upgrade, memory skew may be reduced. However, skew may shift to bandwidth or CPU resources instead.