The database health score feature runs automated checks against your ApsaraDB RDS for MySQL instances and produces a scored diagnostic report. Use the report to identify risks and act before they affect production.
Two inspection modes are available:
-
Automatic inspection: scores all connected instances once per day without manual intervention
-
Manual inspection: triggers an on-demand check for a specific time window — useful after a configuration change or during an incident investigation
Supported instance types
This feature is supported on the following instance types:
-
MySQL 8.0 on RDS High-availability Edition, RDS Enterprise Edition, or RDS Cluster Edition, RDS Enterprise Edition,
-
MySQL 5.7 on RDS High-availability Edition, RDS Enterprise Edition, or RDS Cluster Edition, RDS Enterprise Edition,
-
MySQL 5.6 on RDS High-availability Edition
-
MySQL 5.5 on RDS High-availability Edition
Enable automatic inspection
Automatic inspection scores each connected RDS instance once per day without manual intervention.
-
Log on to the ApsaraDB RDS console.
-
In the left-side navigation pane, choose Maintenance & Monitoring > Performance Monitoring.
-
On the Performance Monitoring page, click the Inspection and Scoring tab.
-
Click Enable.
-
In the Configure Inspection and Scoring dialog box, set the Select Engine parameter and click OK.
After you enable automatic inspection, the system scores each connected RDS instance once per day.
Run a manual inspection
-
Log on to the ApsaraDB RDS console.
-
In the left-side navigation pane, choose Maintenance & Monitoring > Performance Monitoring.
-
Click the Inspection and Scoring tab, then click Start Inspection.
-
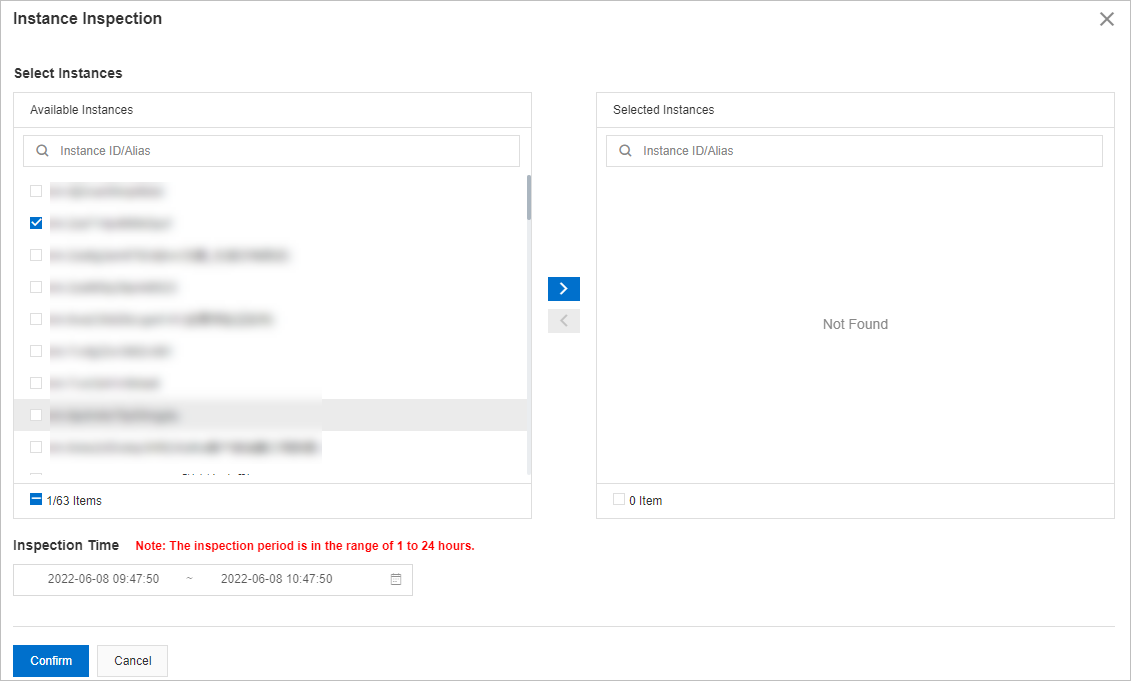
In the Instance Inspection dialog box, go to the Select Instances section. Select one or more instances from Available Instances and click the
 icon to move them to Selected Instances.
 -
In the Inspection Time section, set a time range.
The start time cannot be later than the current time. The minimum interval between start and end time is 1 hour; the maximum is 24 hours.
-
Click Confirm.
View and manage results
After an inspection runs, search by instance name or alias to view results for a specific time period.
Actions available per result
The following actions are available in the Actions column:
| Action | Description |
|---|---|
| Deduction details | Opens the Deduction Details panel showing which metrics triggered point deductions and by how much. |
| Report | Opens the Scoring Report Details panel with the full diagnostic report, including optimization suggestions for each flagged issue. |
| Delete | Removes the inspection results for that instance. |
Additional options
-
Click an instance ID to view its performance trend on the Performance Trends tab. For more information, see Performance trends.
-
Click the
 icon to download the results to your computer.
Scoring rules
The inspection evaluates nine metric categories. For each metric, the system compares the average daily value against predefined thresholds. Resource metrics such as CPU and memory use scaling formulas: the closer the metric is to its critical threshold, the more points are deducted, up to the stated maximum. Binary metrics such as deadlock use fixed deductions.
| Deduction item | Sub-item | Condition | Deducted points |
|---|---|---|---|
CPU utilization (cpuUsage) — average daily CPU utilization across all cores |
Warning | 70% ≤ cpuUsage ≤ 80% | 1+(cpuUsage−0.7)×20 |
| Critical | cpuUsage ≥ 80% | min[3+(cpuUsage−0.8)×30, 10] | |
Memory usage (memUsage) — average daily memory usage |
Warning | 80% ≤ memUsage ≤ 90% | 1+(memUsage−0.8)×20 |
| Critical | memUsage > 0.9 | min[(memUsage−0.9)×50, 10] | |
| Space usage — storage usage = average used storage ÷ total storage × 100% | Available days | availableDays ≤ 30 | 15−availableDays/3 |
| Number of large tables | bigTableCount > 0 | min(bigTableCount, 15) | |
Connection usage (connectionRate) — average connections ÷ max allowed connections × 100% |
Warning | 70% ≤ connectionRate ≤ 80% | 1 |
| Critical | connectionRate > 80% | 3 | |
IOPS usage (iopsUsage) — average IOPS ÷ max allowed IOPS × 100% |
Warning | 70% < iopsUsage < 90% | 3 |
| Critical | iopsUsage > 90% | 5 | |
Active sessions (threadRunning) — number of active sessions in a day |
Warning | threadRunning > min(2×cpuCores+8, 64) | 3 |
| Critical | threadRunning > min(4×cpuCores+8, 96) | 9 | |
Slow SQL statements (slowSqlCount) — SQL statements that caused slow queries in a day. Click the count to view the five most frequently executed slow SQL statements. |
Detected | 0 < slowSqlCount < 100 | 1+(slowSqlCount−10)/30 |
| Warning | 100 ≤ slowSqlCount < 500 | 4+(slowSqlCount−100)/30 | |
| Critical | slowSqlCount ≥ 500 | min[18+(slowSqlCount−50)/30, 30] | |
| SQL security audit | High-risk SQL statements | riskSqlCount > 0 | min(riskSqlCount, 5) |
| SQL injection attacks | sqlInjectionCount > 0 | min(sqlInjectionCount, 5) | |
| Deadlock | Detected | Detected | 3 |
What's next
If your inspection results reveal specific issues, use the following features to address them:
Slow SQL queries:
Storage capacity issues:
Performance issues: