When a MySQL instance shows signs of degraded performance, the Performance Trend page gives you a real-time and historical view of key metrics — so you can spot anomalies, zoom into problem windows, and trigger diagnostics without leaving the console.
Available metrics
The following table lists the metrics available on the Performance Trend page, organized by category.
| Category | Metrics |
|---|---|
| Basic metrics | CPU/Memory utilization, Physical memory, Disk utilization, Storage usage, Physical storage usage, Temporary tables, Network traffic, IOPS utilization, IOPS |
| Database metrics | Sessions, Connection usage, transactions per second (TPS)/queries per second (QPS), Executions, SelectScan, Threads, Slow queries, Prepared statements |
| InnoDB storage engine | InnoDB Buffer Pool hit rate, InnoDB Buffer Pool dirty blocks, InnoDB Buffer Pool request rate, InnoDB Data read/write throughput, InnoDB row locks, InnoDB memory pages, Disk flushes, Rows sorted per second, InnoDB Row Operations, InnoDB Redo log writes, InnoDB Redo log write requests |
| MyISAM storage engine | MyISAM Key Buffer read/write/utilization rate, MyISAM read/write requests |
| Replication | Node replication thread status, Node replication delay |
Replication metrics are available only for High-availability Edition and Cluster Edition instances.
View performance trends
Go to the Instances page. In the top navigation bar, select the region where your RDS instance resides, then click the instance ID.
In the left navigation pane, choose Autonomy Services > Dashboard.
On the Dashboard page, use any of the following operations:
Query a specific time range
Select a time range to load the corresponding monitoring metrics. Historical data is available for the last 30 days only.

Enable real-time mode
Click the
 icon before the time range selector. The page refreshes every 5 seconds so you can watch performance changes as they happen.
Adjust monitoring granularity
Set Data Granularity to control the sampling interval. Options include 5 seconds, 30 seconds, and 1 minute.
View metric descriptions
In any metric trend chart, click the
 icon next to a metric name to see its sub-metrics and descriptions.
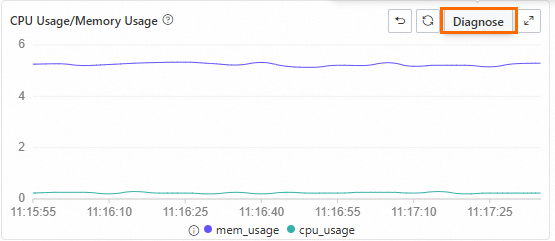
Diagnose a time range
Drag across any metric trend chart to select a time window, then click Diagnose to run analysis for that period.
Switch nodes (Cluster Edition only)
For instances using Cluster Edition, select one or more nodes to view and compare their metrics side by side.
NoteTo return to the previous version of Performance Trends, click Old Version in the upper-right corner of the Standard Monitoring page.
Appendix: Old version of the Performance Trend page
Go to the Instances page. In the top navigation bar, select the region where your RDS instance resides, then click the instance ID.
In the left navigation pane, choose Autonomy Services > Dashboard.
The old version organizes features across the following tabs:
Performance Trends tab
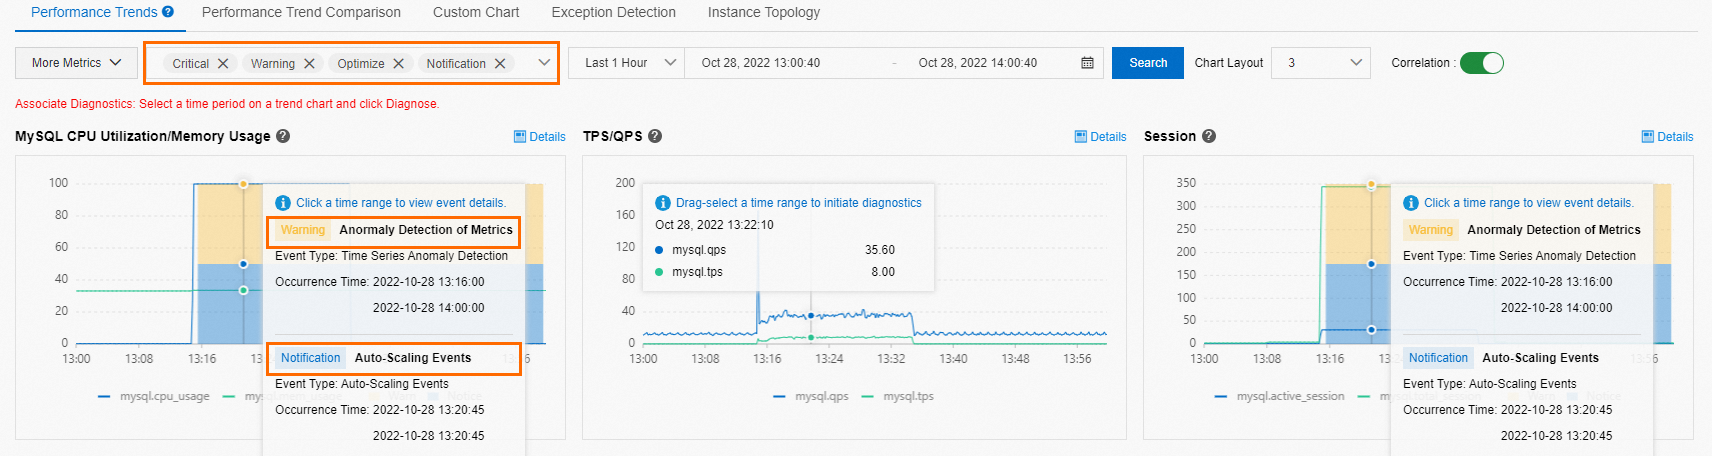
View metric trend charts for a selected time range. From this tab, you can:
Click More Metrics to choose which metrics to display.
Drag to select a time range in a chart, then click Diagnose to analyze performance for that window.
Click Details in a chart to expand it and adjust the time range.
Select an event level to filter events. When the system detects events at the specified level, they appear in the MySQL CPU Utilization/Memory Usage and Session charts. Click an event in the chart to view its diagnosis result.
Performance Trend Comparison tab
Compare a metric's trend across different time ranges. Click More Metrics to choose the metric to compare.
Custom Charts tab
Build custom dashboards that combine multiple metrics into a single view.
Click Add Monitoring Dashboard. In the Create Monitoring Dashboard dialog, enter a Dashboard Name and click OK.
Click Add Node and Metrics, select the nodes and metrics to display, and click the
 icon.
icon.Click Confirm.
Exception Detection tab
View exception detection results and predictions for core metrics. Click More Metrics to select the metrics for exception detection. For details, see Performance anomaly detection.
Instance Topology tab
View the topology of your RDS instance.
What's next
Investigate common performance issues with these troubleshooting guides:
Troubleshoot slow SQL statements on an ApsaraDB RDS for MySQL instance
Troubleshoot memory consumption issues on an ApsaraDB RDS for MySQL instance
Troubleshoot insufficient storage issues on an ApsaraDB RDS for MySQL instance
Troubleshoot excessive active threads on an ApsaraDB RDS for MySQL instance
You can also use autonomy service features to perform performance diagnosis and optimization. For more information, see Overview of DAS.