Smart Q is a value-added module in Quick BI that integrates multiple large language models (LLMs) and agent capabilities. It revolutionizes data analysis with a suite of AI features, including the Q Chat Agent, Q Insight Agent, and Q Dashboard Agent. You can ask data analysis questions in natural language, generate reports quickly, and apply intelligent, personalized configurations to your data visualizations. The service also supports multi-turn dialogue for in-depth analysis, data interpretation, and custom AI service management, creating a new way to consume data.
The five agents in Quick BI Smart Q are part of a value-added module and require an additional purchase.
Purchasing the Q Chat Agent also gives you access to the Q Insight Agent. This module is currently available only in the China (Hong Kong) , Malaysia (Kuala Lumpur) and Singapore regions.
Purchasing the Q Report Agent gives you access to Q Report features. This module is currently available only in the China (Hong Kong) and Singapore regions.
Purchasing the Q Dashboard Agent gives you access to Q Dashboard features. This module is currently available only in the China (Hong Kong) and Malaysia (Kuala Lumpur) regions.
After purchase, an organization administrator can assign seats to organization members on the member management page. Members without an assigned seat cannot use agent features. For detailed instructions, see Manage organization users.
This module is currently available only in the China (Hong Kong) and Malaysia (Kuala Lumpur) regions. Support for other regions is coming soon.
Only the advanced edition and professional edition of Quick BI support purchasing Smart Q as an add-on. The personal edition does not support this feature.
Features
Q Chat
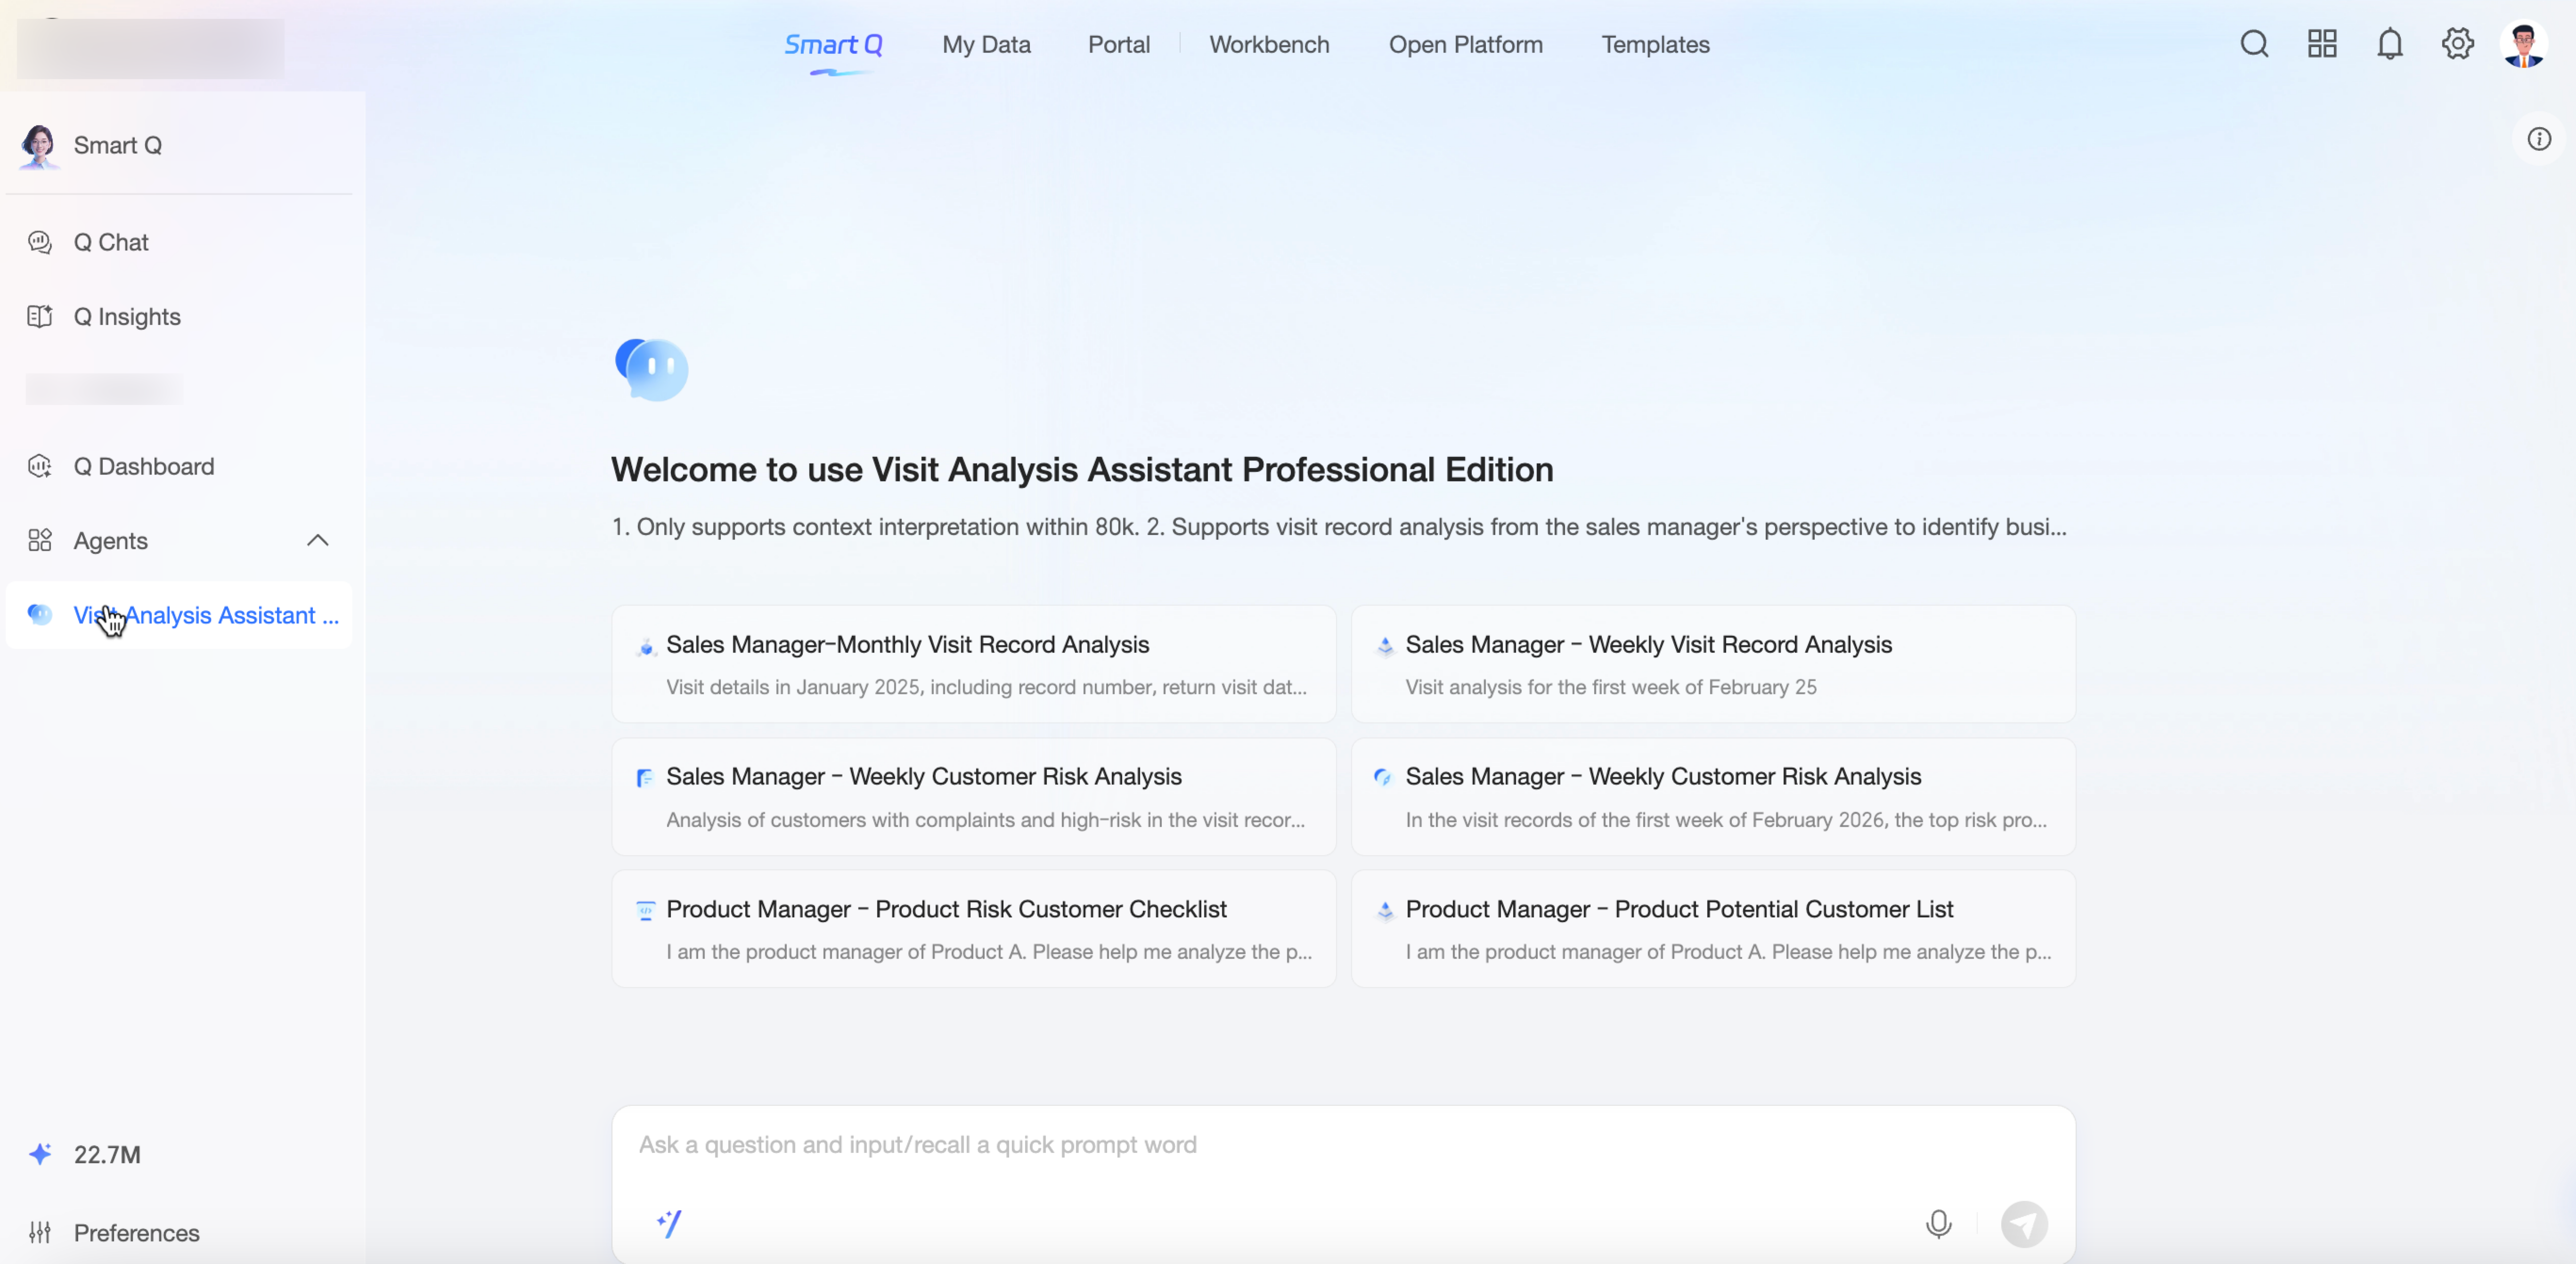
The Q Chat Agent lets you use natural language to get instant data results. This question-and-answer approach makes data analysis accessible to everyone, creating a new way to work with data. From the Smart Q&A interface on your PC or mobile client, you can preview and select datasets, ask questions directly or use suggested prompts, engage in multi-turn dialogue, and view your conversation history in the Conversation List.
Use cases:
Quick data retrieval: Use Q&A to retrieve data efficiently, reduce ad-hoc data pull requests, and respond quickly to leadership requests.
Anomaly detection: Identify abnormal data in reports or data files, then automatically drill down to find the root cause. For example, if monthly profit is abnormal, the agent can trace the cause to specific customers.
Fluctuation cause analysis: Compare metric changes across different time periods, analyze causes from multiple perspectives, and quantify each factor's contribution so you can pinpoint and act on the right drivers.
Other ways to use: my agents
When you need to connect to multiple agents, you can chat with them to build a custom AI analytics assistant.
Q Insights
The Q Insight Agent uses LLM capabilities to help you interpret dashboards and gain deeper insights. For example, if you are a sales data analyst and need an overall analysis of this year’s sales performance, you can use the one-click intelligent interpretation feature. If you also need a deeper exploration of specific metrics, you can generate more detailed interpretations for multiple charts.
Use cases:
Report analysis: Generate interpretations for dashboard data using a large language model. You can also create insight analyses in a specified format for weekly or monthly reports to help you complete your analysis documents.
Q Dashboard
The Q Dashboard Agent focuses on one-click report generation, conversational chart creation and configuration, one-click intelligent styling, and intelligent insight attribution. It helps you build reports and analyze data faster.
Use cases:
Report building: Select a dataset and generate a report with one click to build reports more efficiently.
Assisted analysis: Enable year-over-year and month-over-month comparisons with a single sentence, perform complex operations with ease, and quickly add conditional formatting, reference lines, or max/min values to better understand your data.
Report styling: Apply one-click styling to instantly enhance the visual appearance of your reports, automating thousands of configurations in seconds. You can also use your corporate brand logo to create reports that match your brand identity.
Key Benefits
Benefit 1: High accuracy
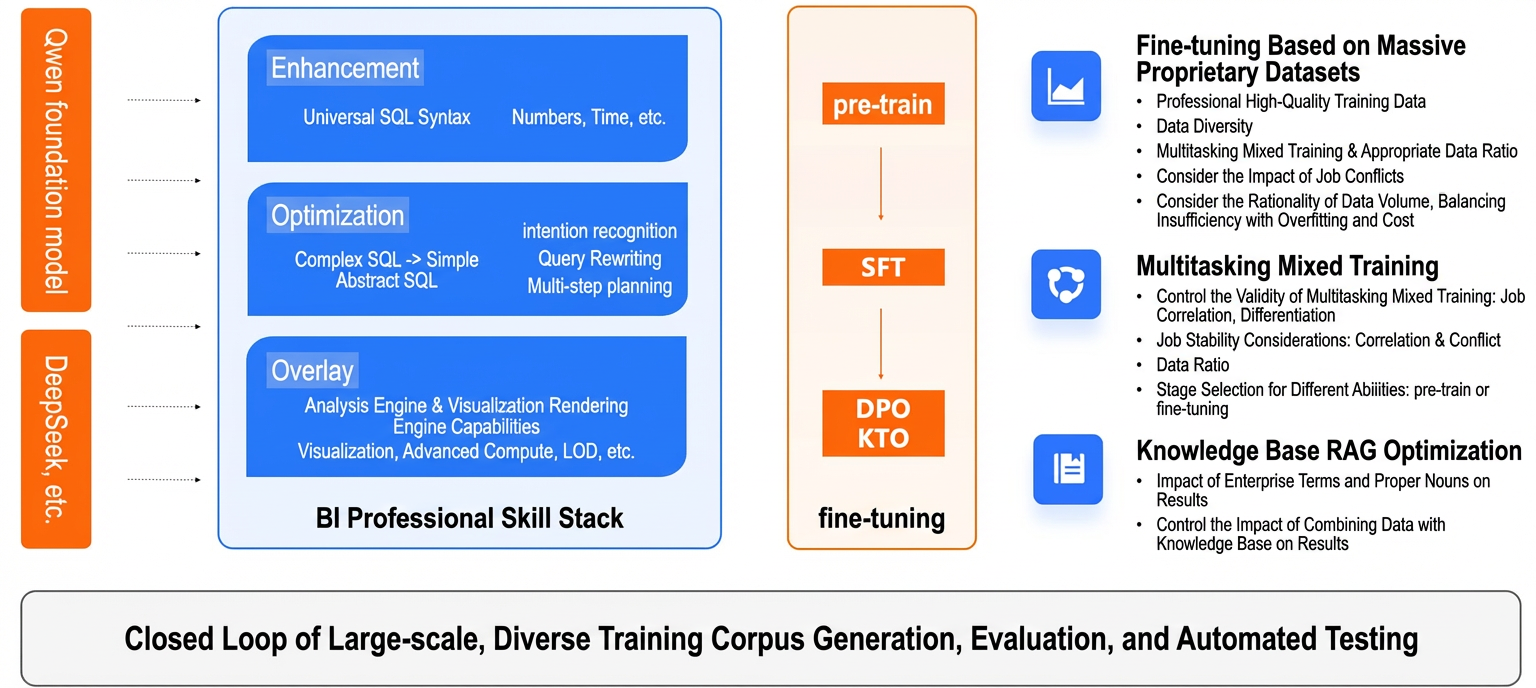
Powered by the Qwen large language model and three core technologies, Smart Q accurately and quickly queries heterogeneous data from multiple sources. The system is compatible with dozens of database dialects and complex BI analytics. A built-in quality assessment ensures that the model accurately interprets the data, providing stable and reliable analysis results in any deployment environment.
Benefit 2: Proven maturity
Smart Q provides an enterprise-grade intelligent analytics solution. Backed by 15 years of experience serving tens of thousands of customers, it offers an intuitive visual experience and a comprehensive data security and governance system, ensuring efficient and reliable services for customers at all stages of development.
The product is highly open and extensible, supporting system embedding and open APIs. It also supports custom agents, allowing you to connect external models from platforms like Dify and Model Studio and reuse platform capabilities to build specialized intelligent agents that are deeply integrated with your business scenarios.
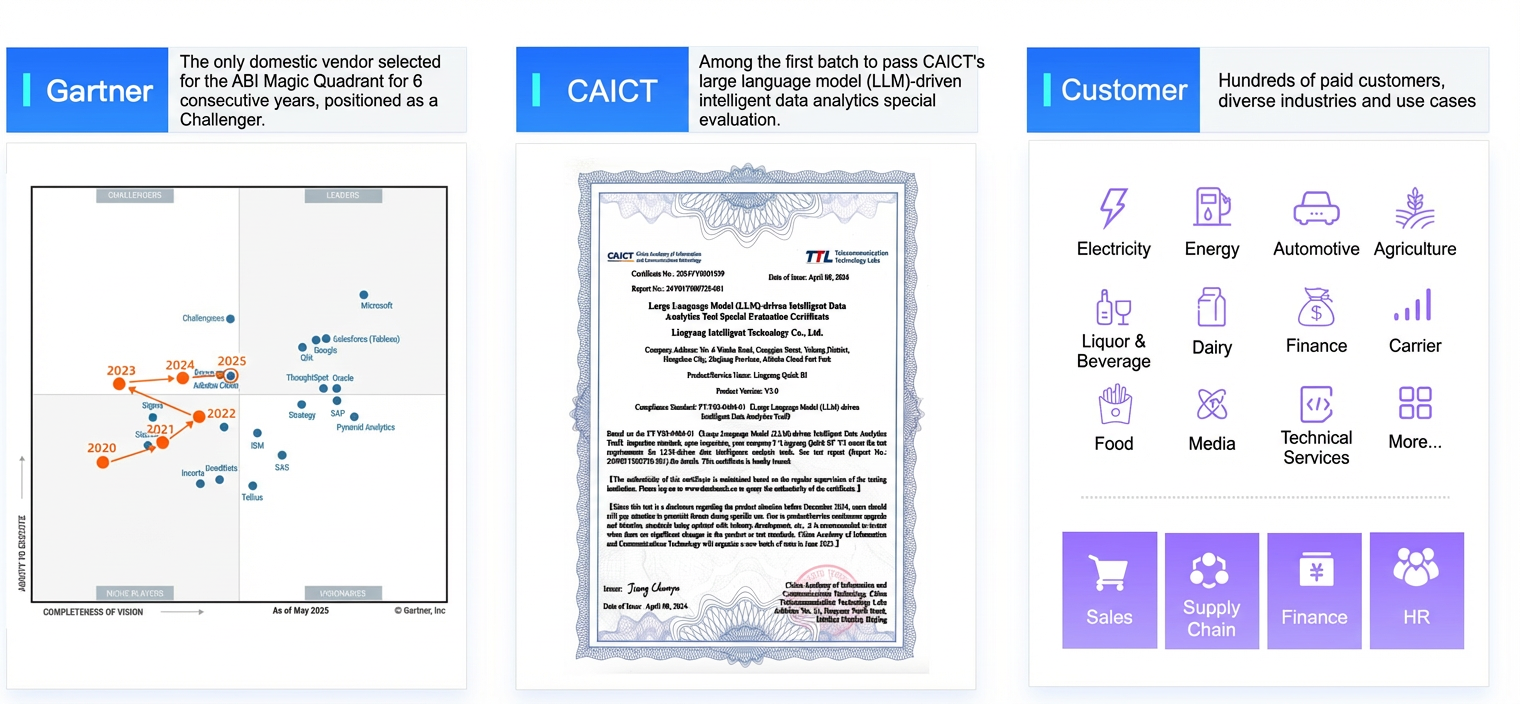
The product's maturity and market leadership are widely recognized. It is the only product in China to be named a Challenger in the ABI Magic Quadrant for six consecutive years and was one of the first to pass authoritative evaluation by the China Academy of Information and Communications Technology (CAICT).
Benefit 3: Flexibility
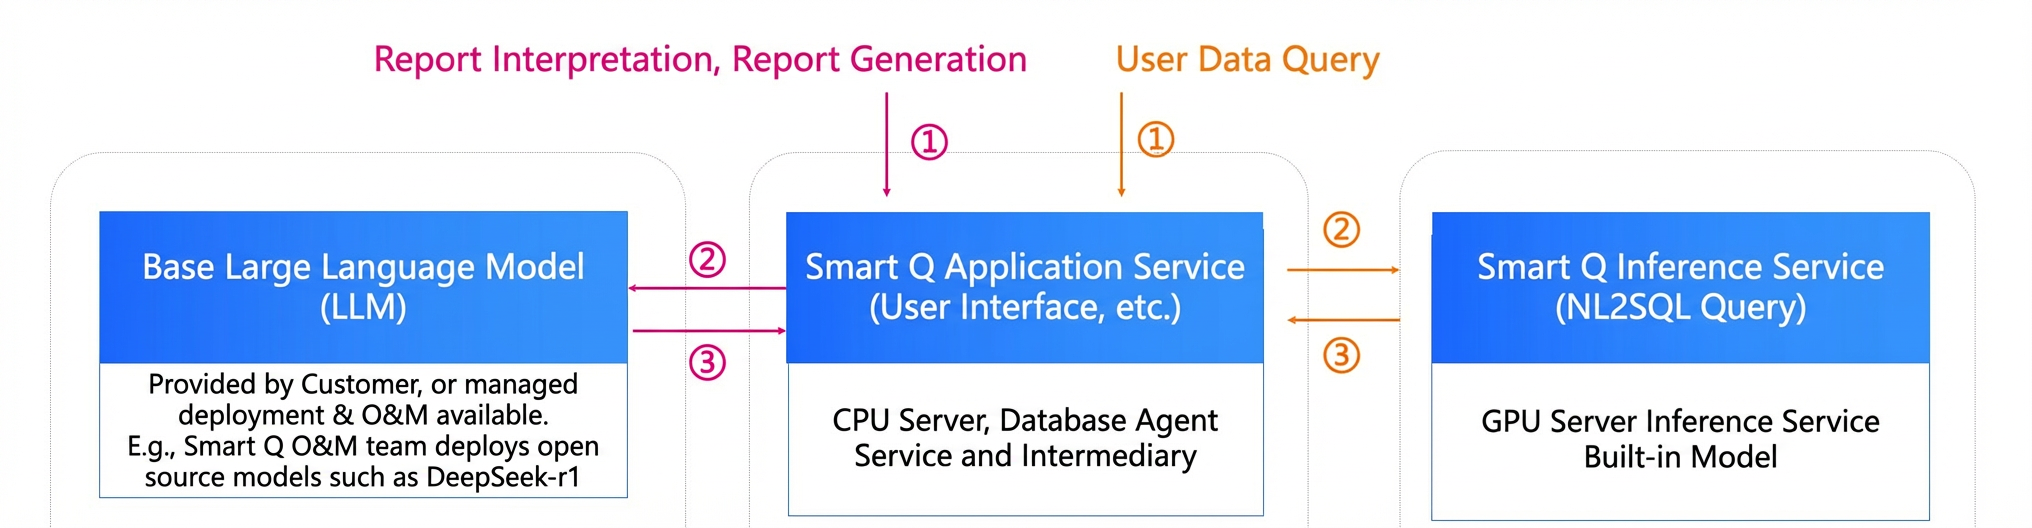
Smart Q is highly flexible, allowing you to choose the deployment environment, large language models, and feature modules that best fit your needs.