Q Insights intelligently parses dashboard report data, analyzes business trends, and generates key insight reports in a single click to accelerate decision-making.
-
Q Insights is an add-on module that you can use after purchasing Smart Q · Q Insights. A limited-time free trial is currently available.
-
This feature is currently available only in the China (Hong Kong) , Malaysia (Kuala Lumpur) and Singapore regions. It is being progressively rolled out to other regions.
Use cases
Q Insights leverages large language models to analyze your dashboard data and uncover deeper insights.
For example, as a sales department data analyst, you can use one-click interpretation to get a comprehensive overview of this year's sales data. For deeper insights into specific metrics, you can run a more detailed Q Insights on multiple charts. For more information, see Usage examples.
Limitations
-
The data in a dashboard must fit within the context length of the selected model. Keep the report data size within 80% of the model's context length. For example, the Qwen-max model has a 32K context length, so your report data should not exceed 25,000 characters.
-
Q Insights for dashboards is available in the Advanced and Professional Editions but not in the Personal Edition. It is not supported for embedded dashboards or dashboards shared via a public link.
Prerequisites
-
You have enabled Q Insights.
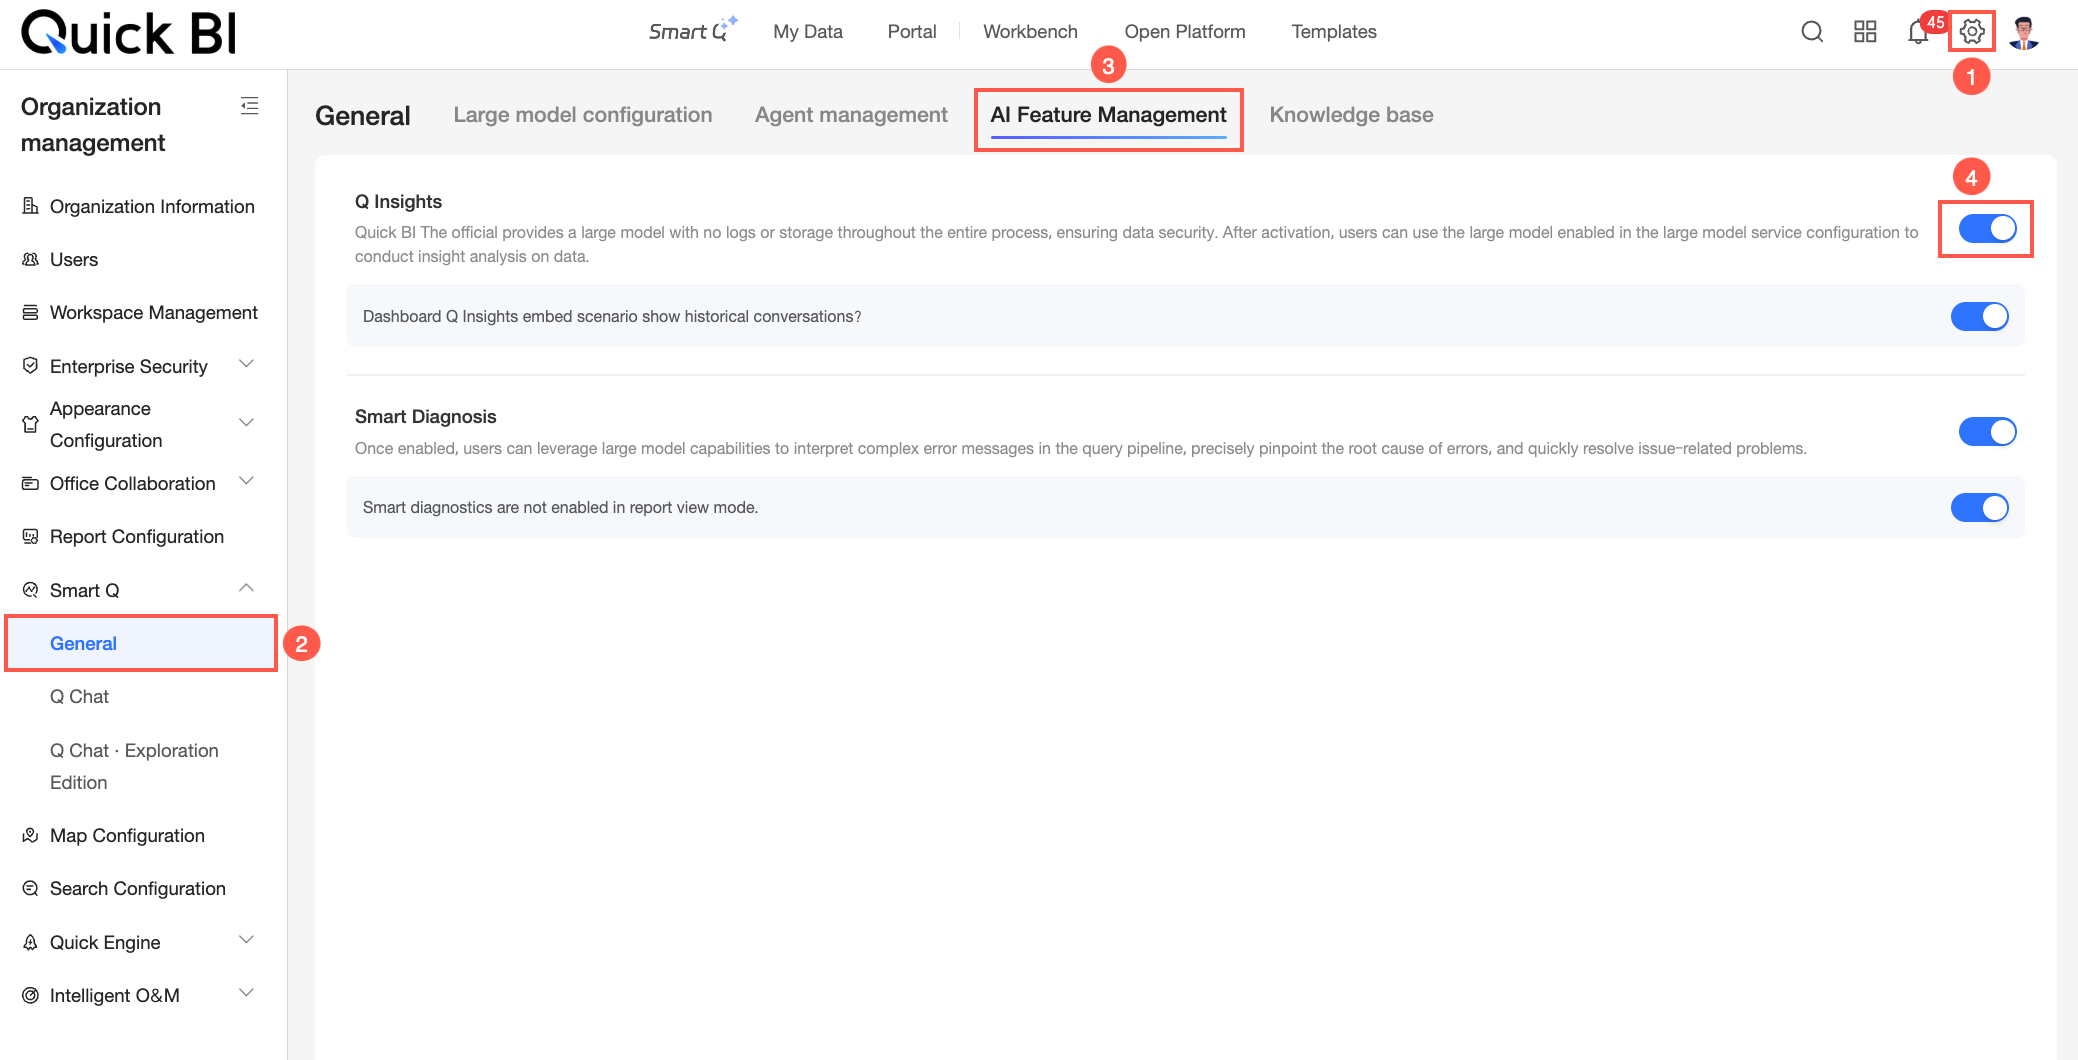
-
You have configured Q Insights.
Access the feature
On the dashboard preview page, click the ![]() icon to open the Q Insights panel. You can access the feature in the following ways:
icon to open the Q Insights panel. You can access the feature in the following ways:
Q Insights is not available for dashboards viewed through a publicly shared link.
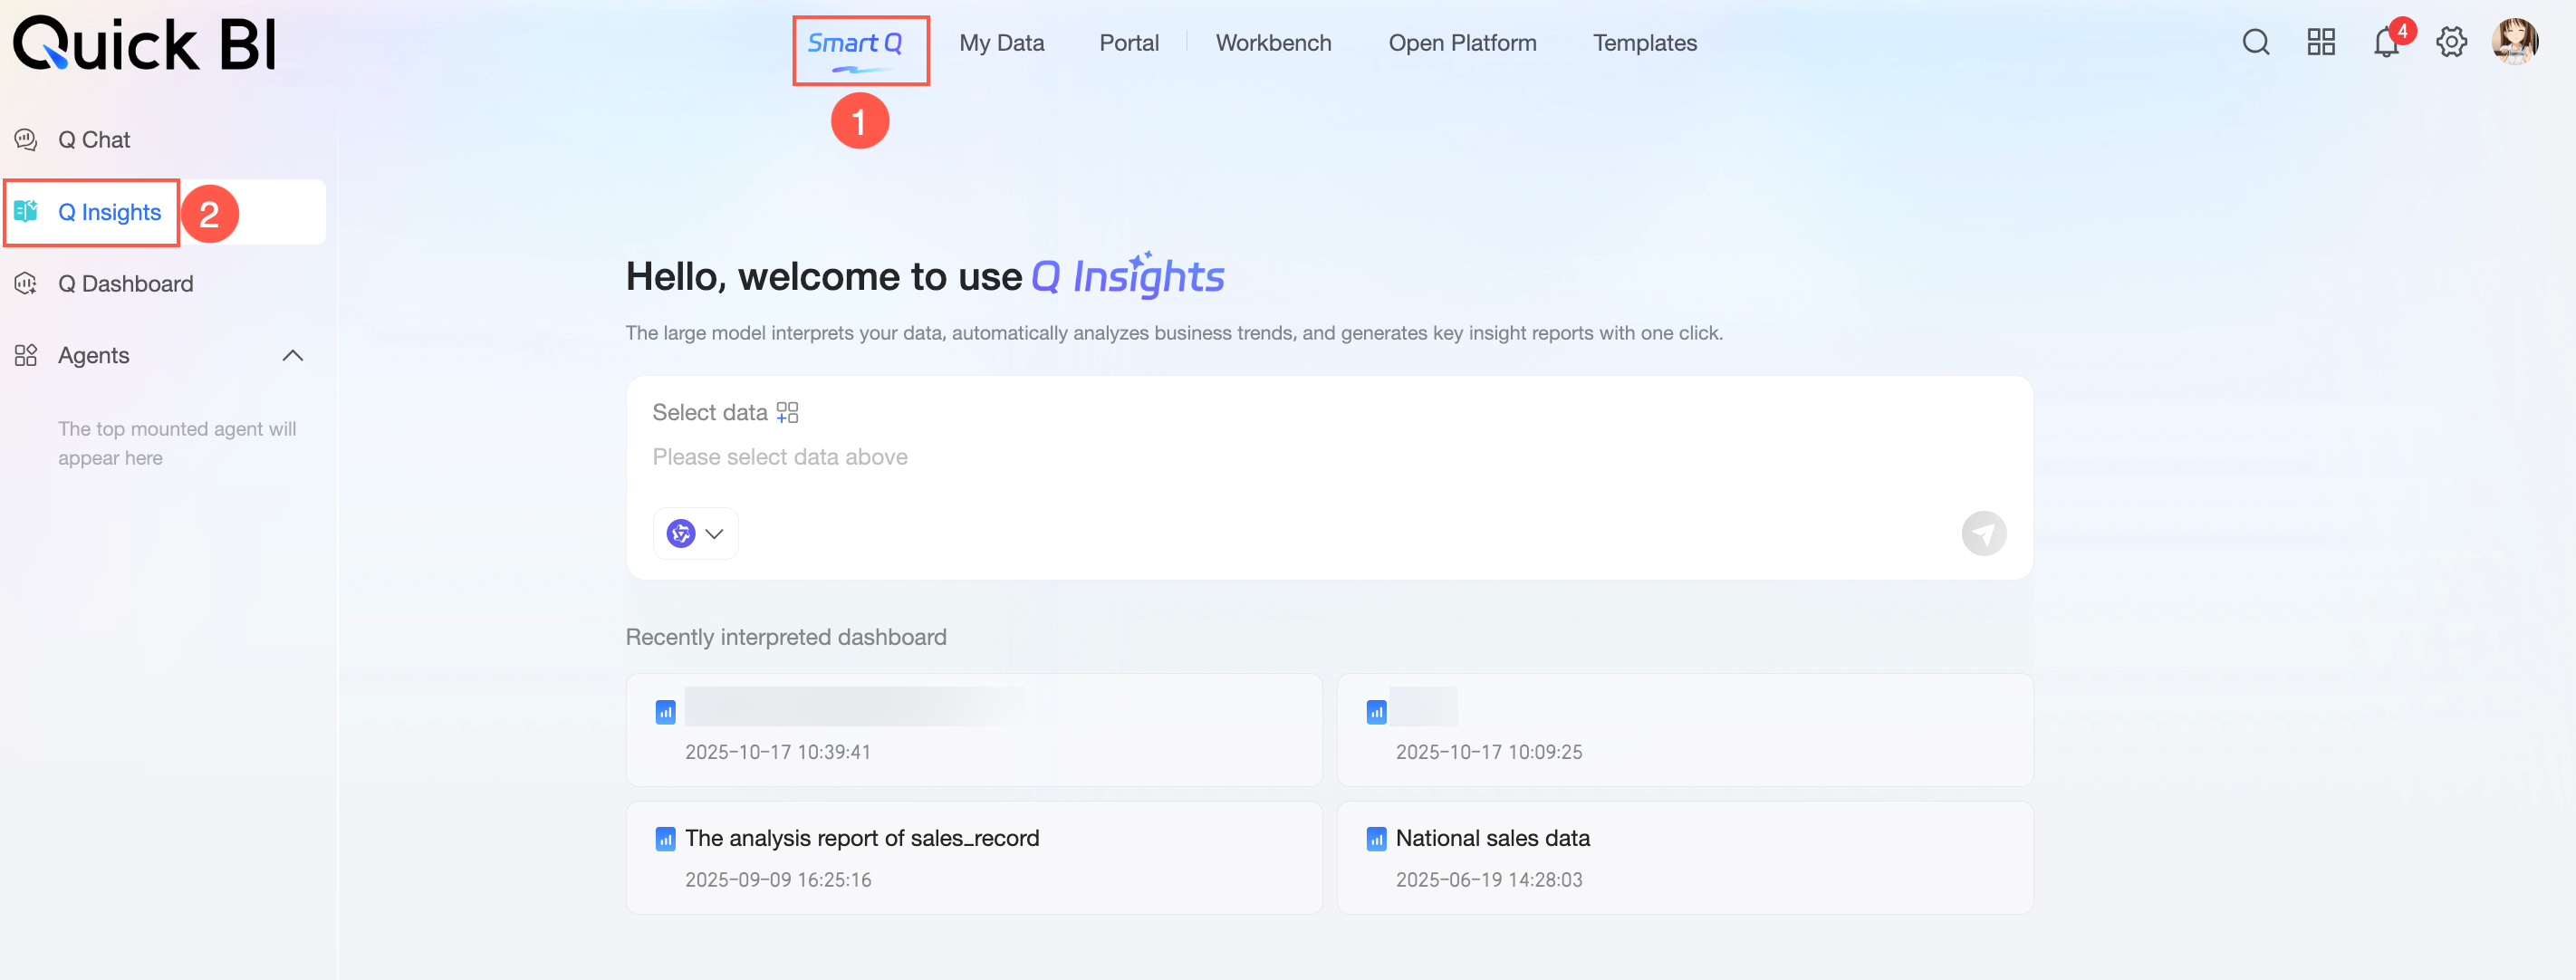
Method 1: From the Smart Q homepage
-
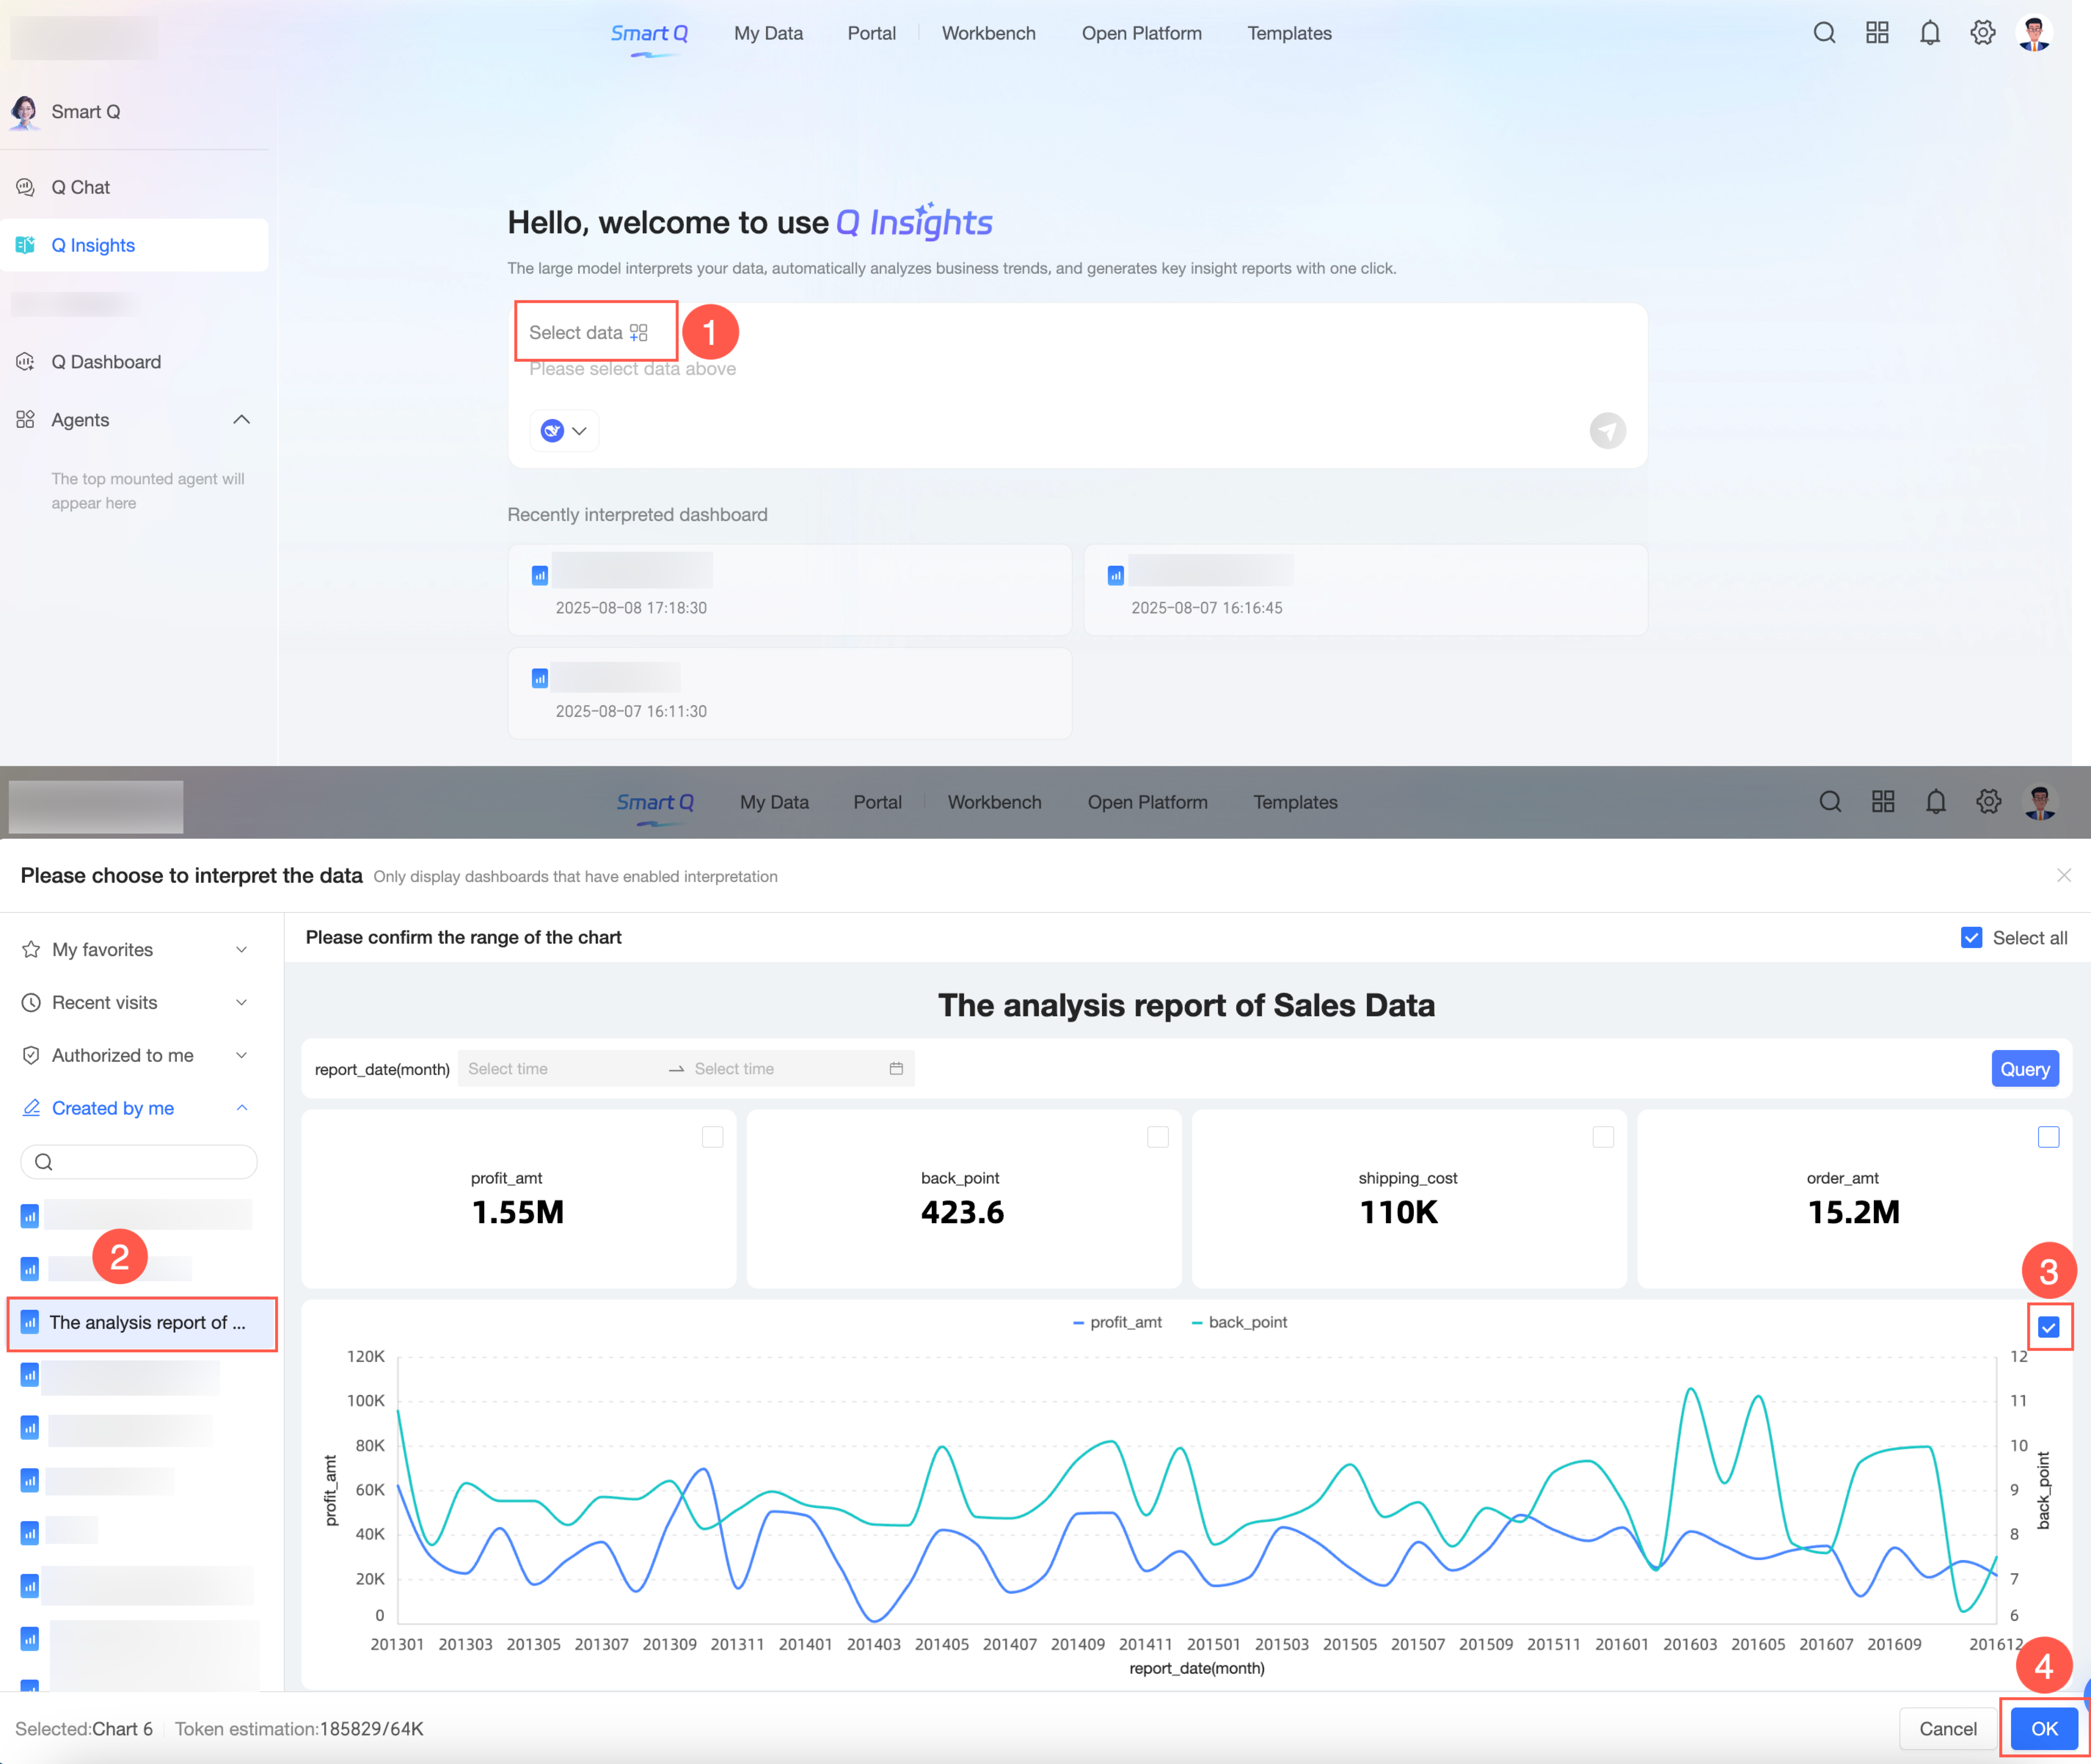
On the Smart Q homepage, select Q Insights from the left-side navigation pane.
-
Select the dashboard component that you want to interpret and click OK.
-
Enter an analysis approach or click one-click interpretation.
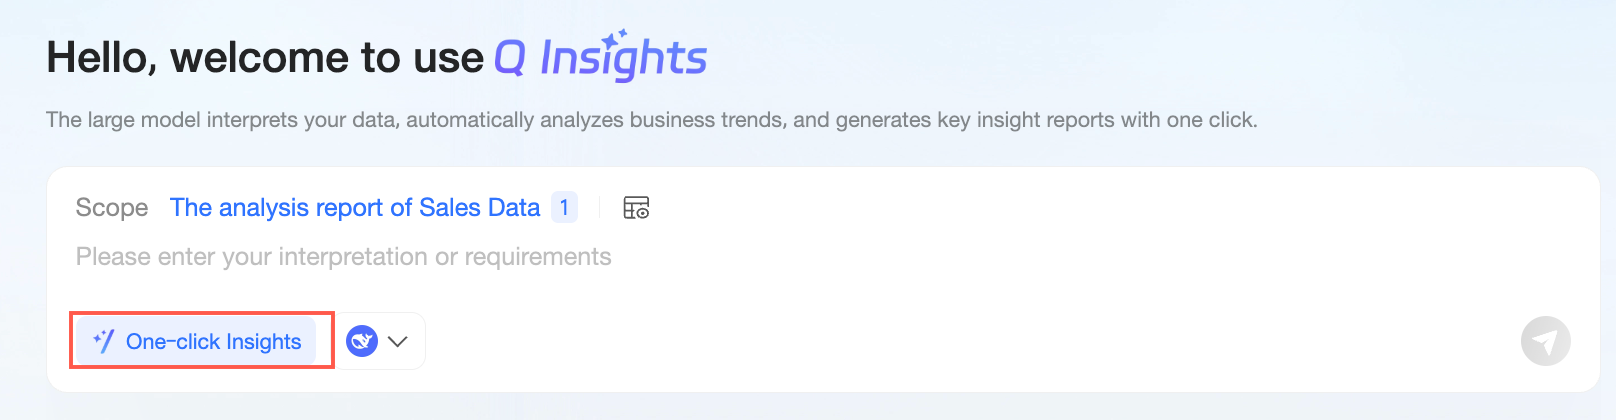
-
The system automatically returns the interpretation result.
 Note
Note-
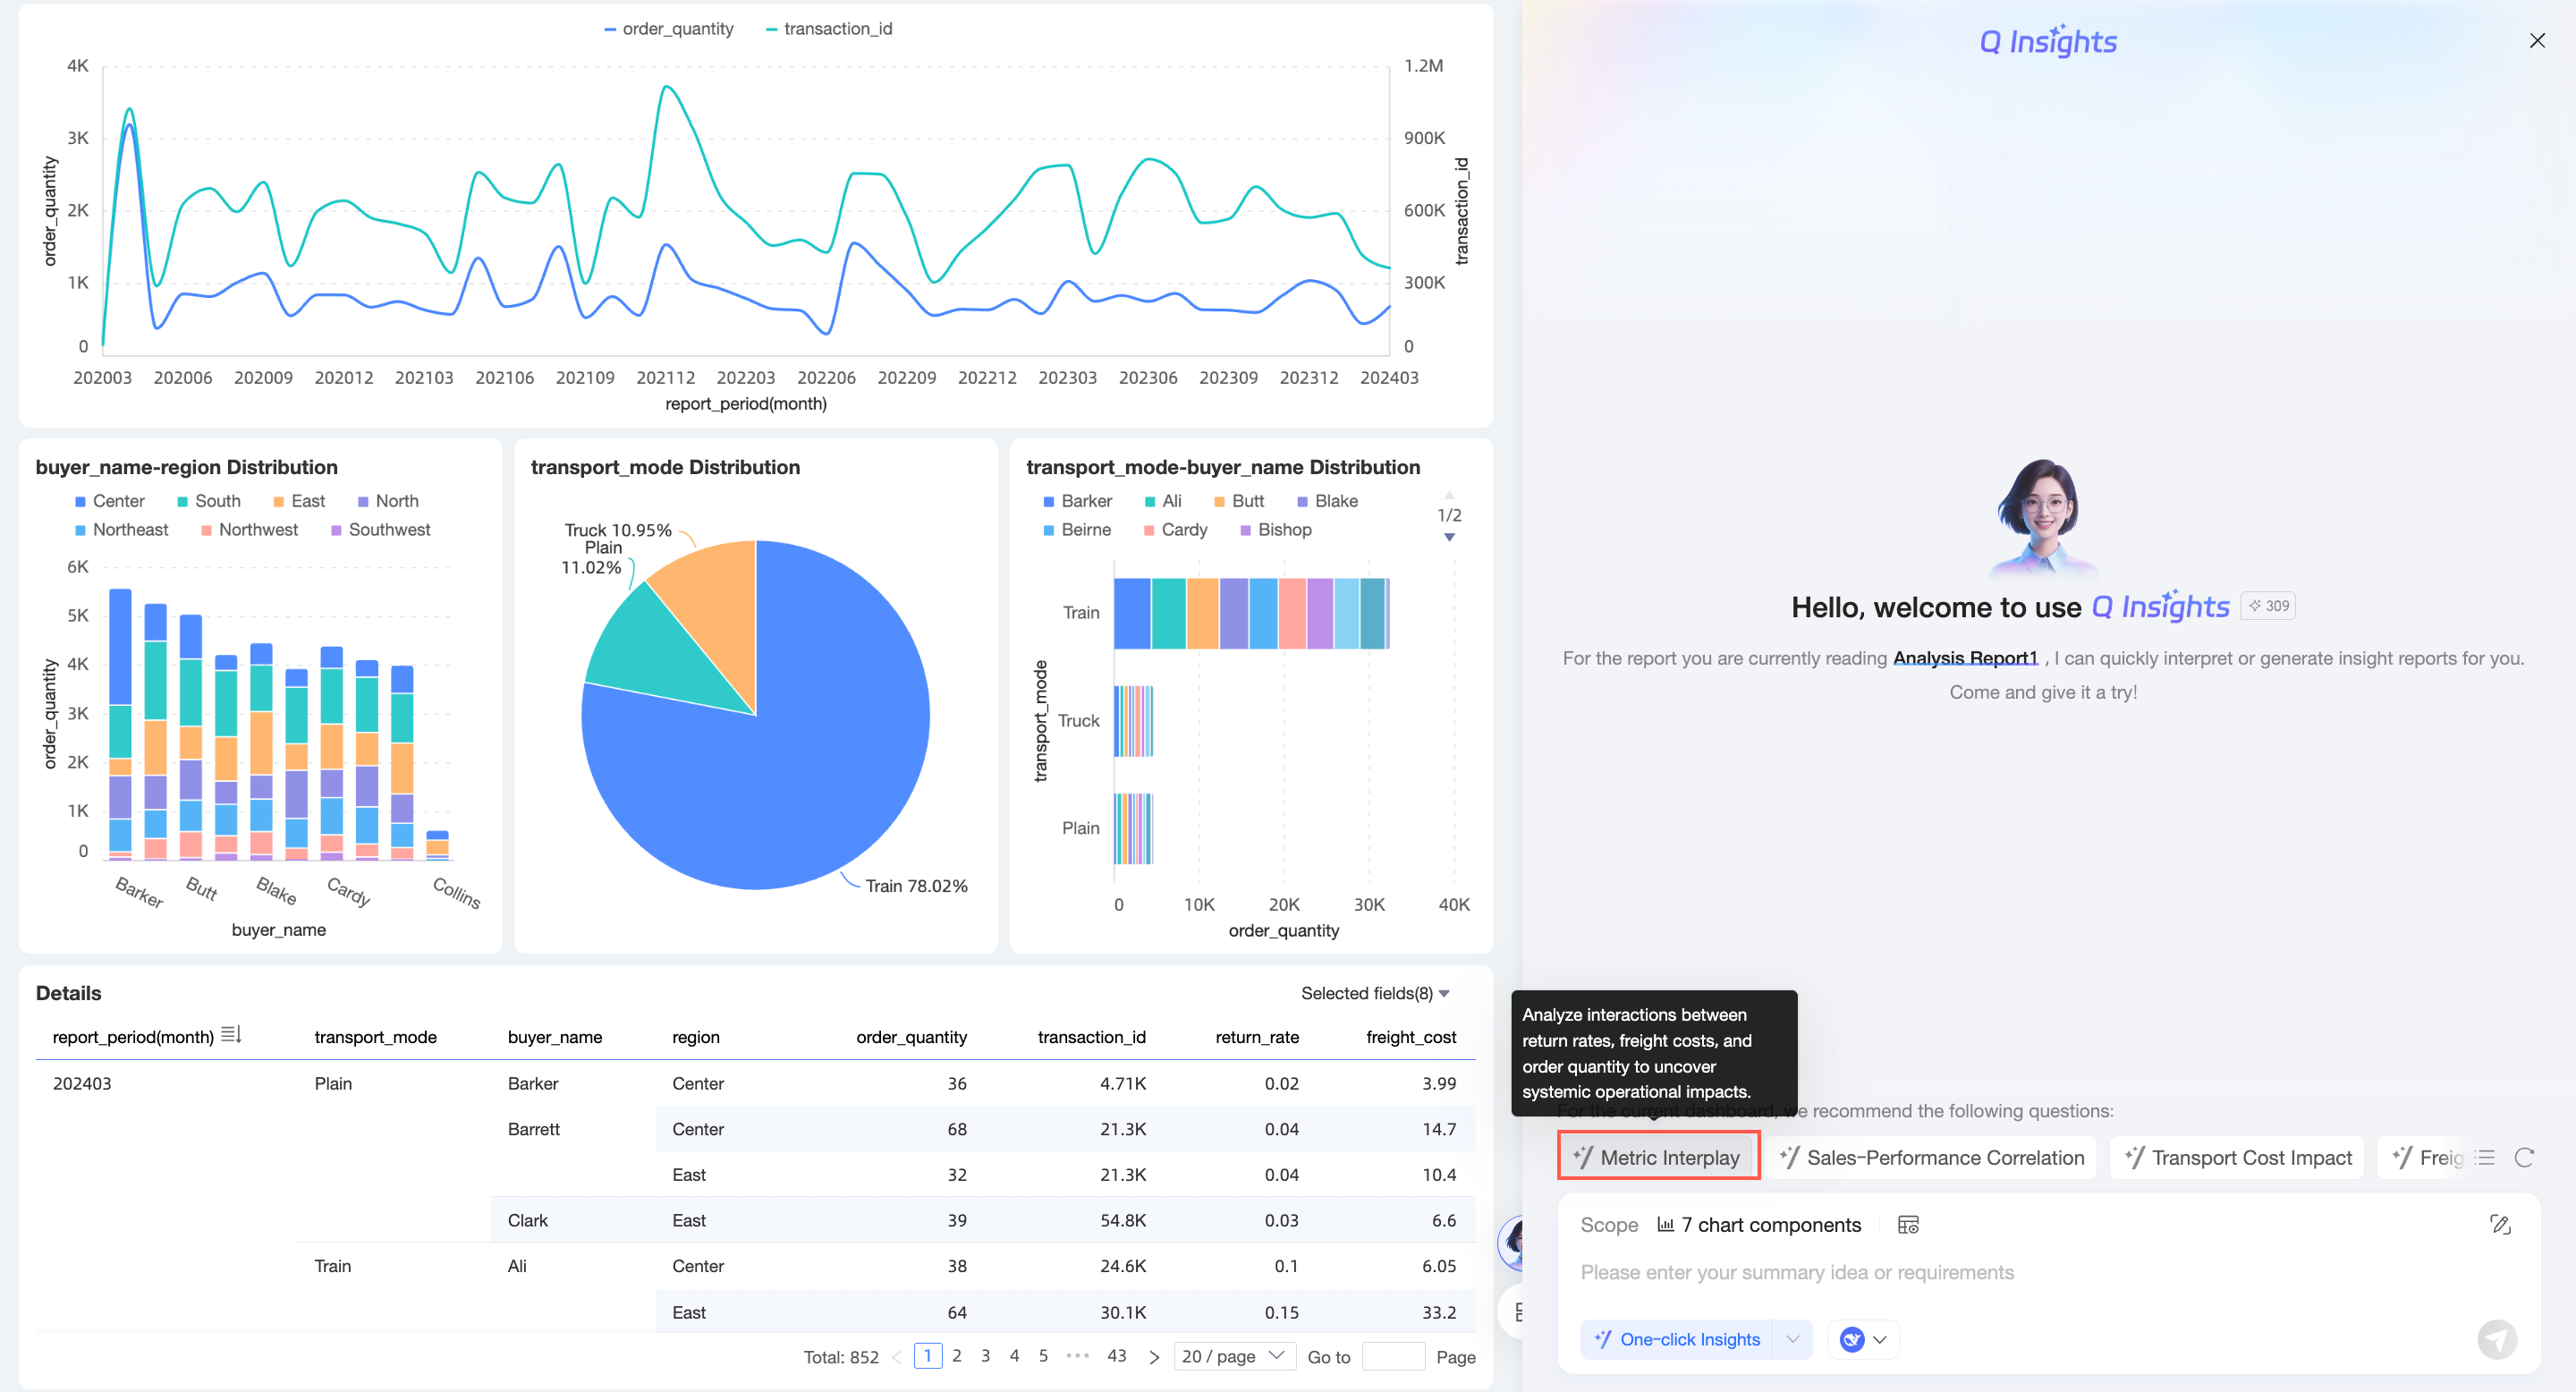
The system automatically generates Recommended Questions for the current dashboard. You can click a recommended question to ask it directly. For more information, see Recommended questions.

-
You can favorite and copy questions to reuse them. For more information, see Favorite and copy questions.
-
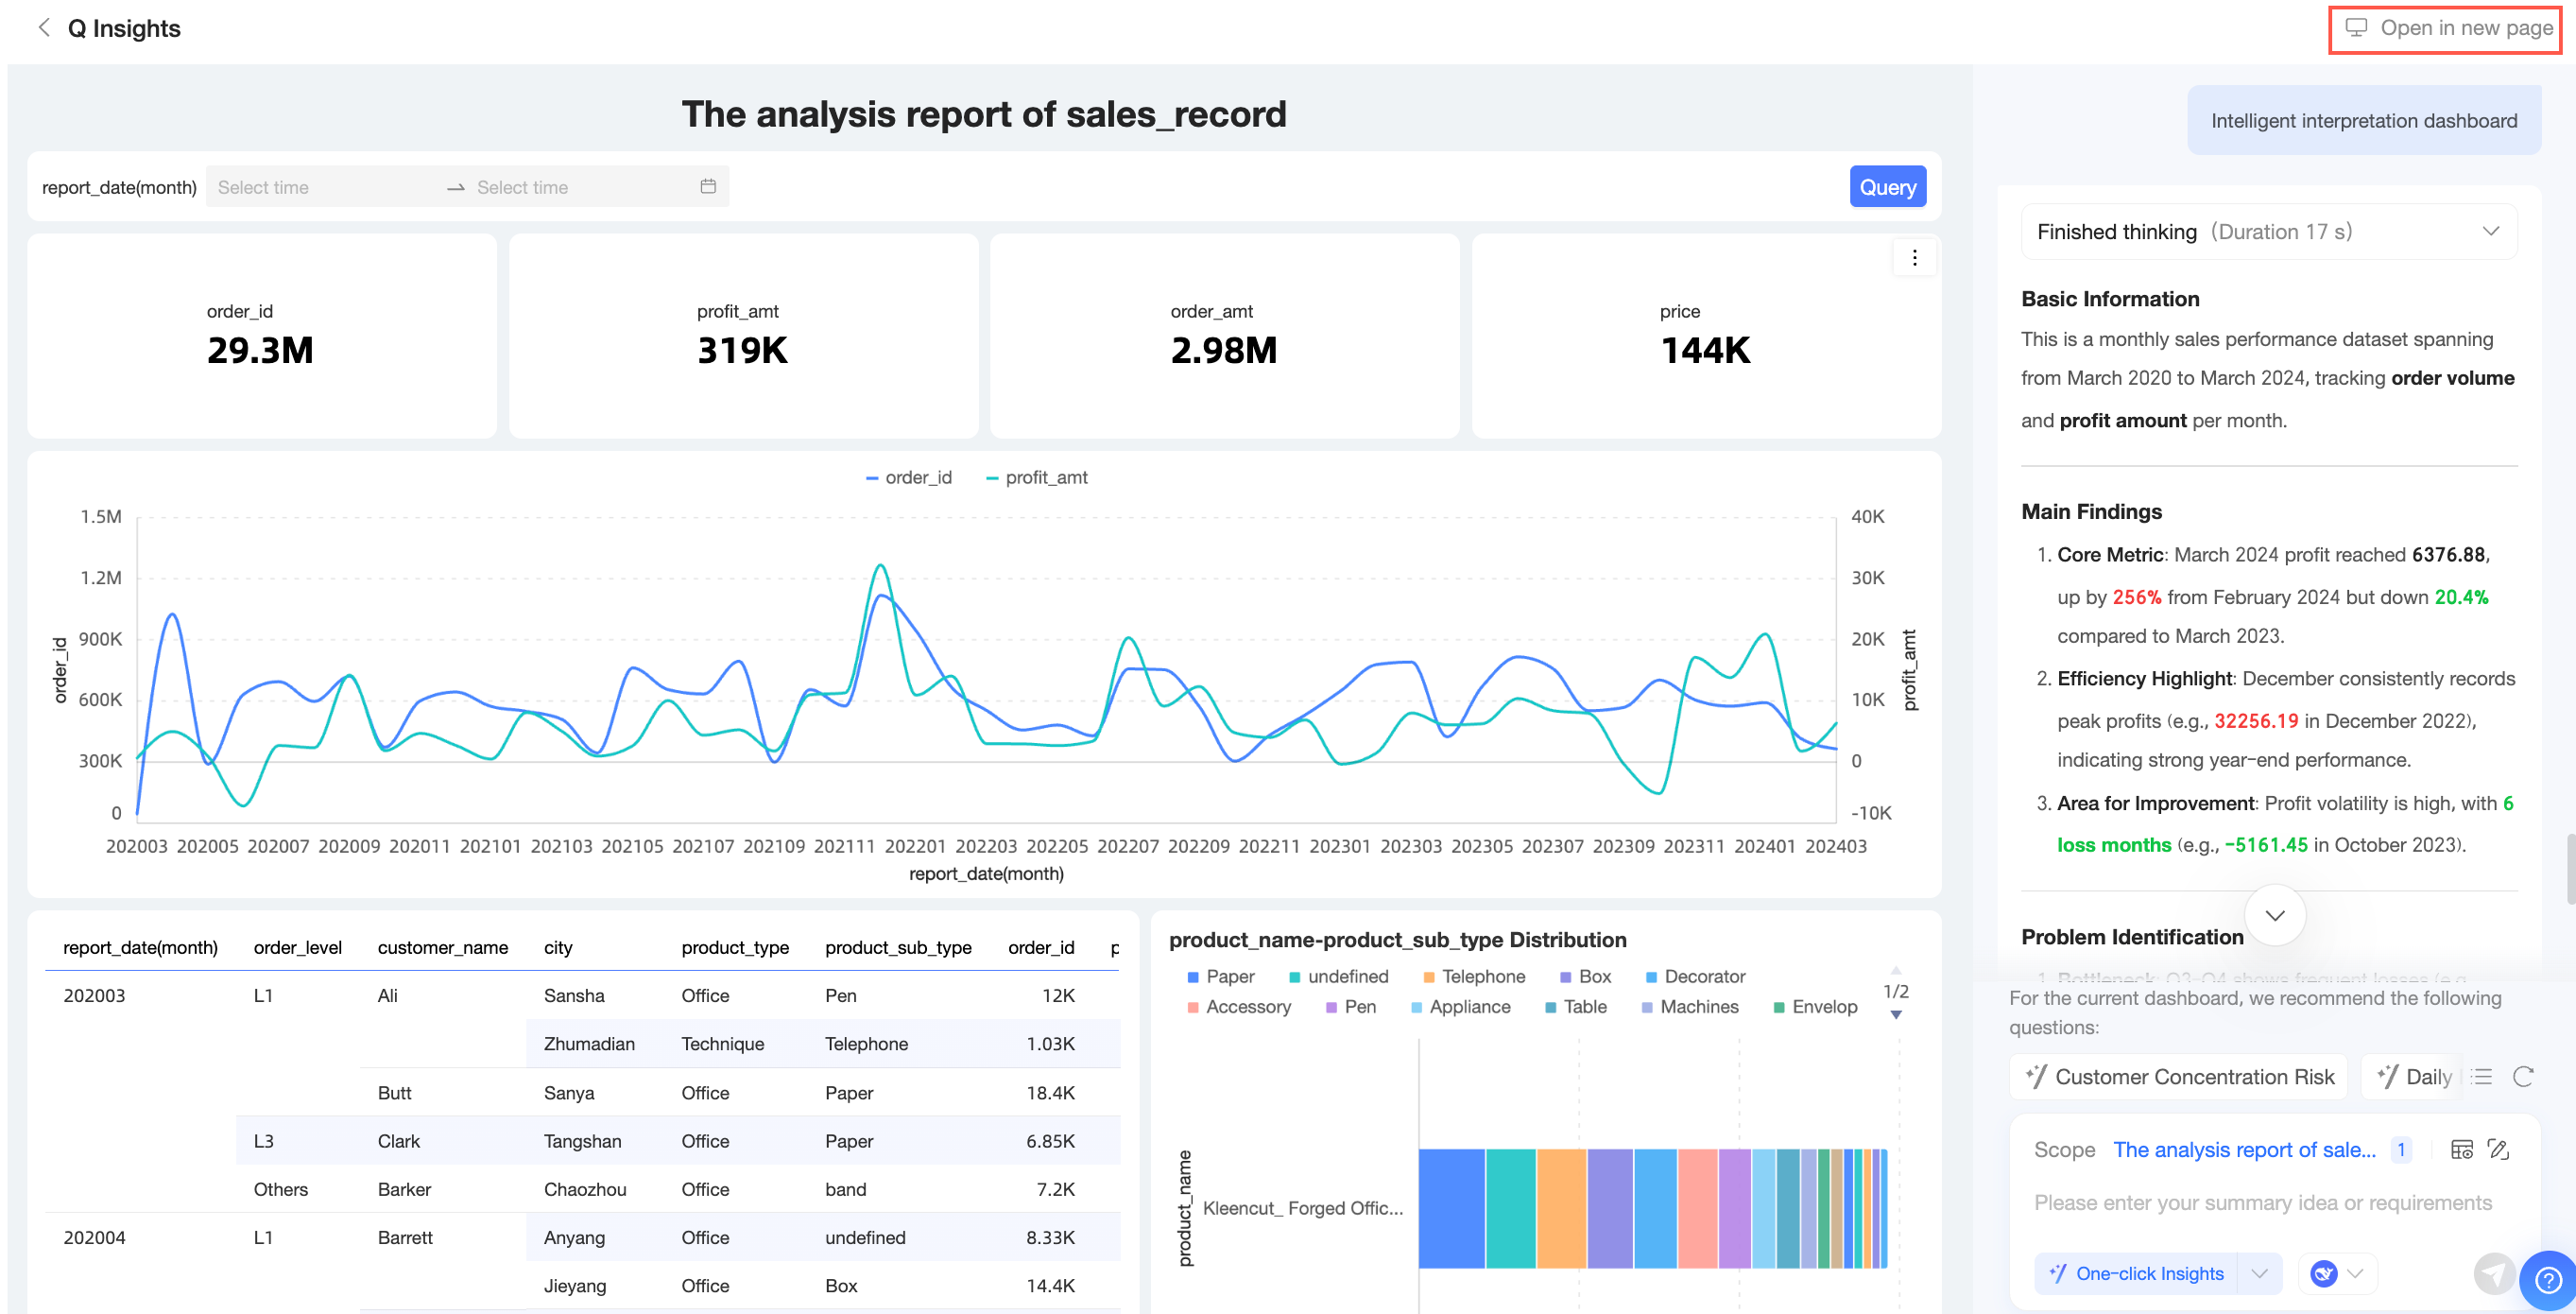
To open the Q Insights panel on the dashboard preview page, click Open in new window in the upper-right corner.
-
Method 2: From the dashboard preview page
-
After you go to the dashboard management page, click the
 icon next to the target dashboard name or the
  icon in the Actions column to open the dashboard preview page.
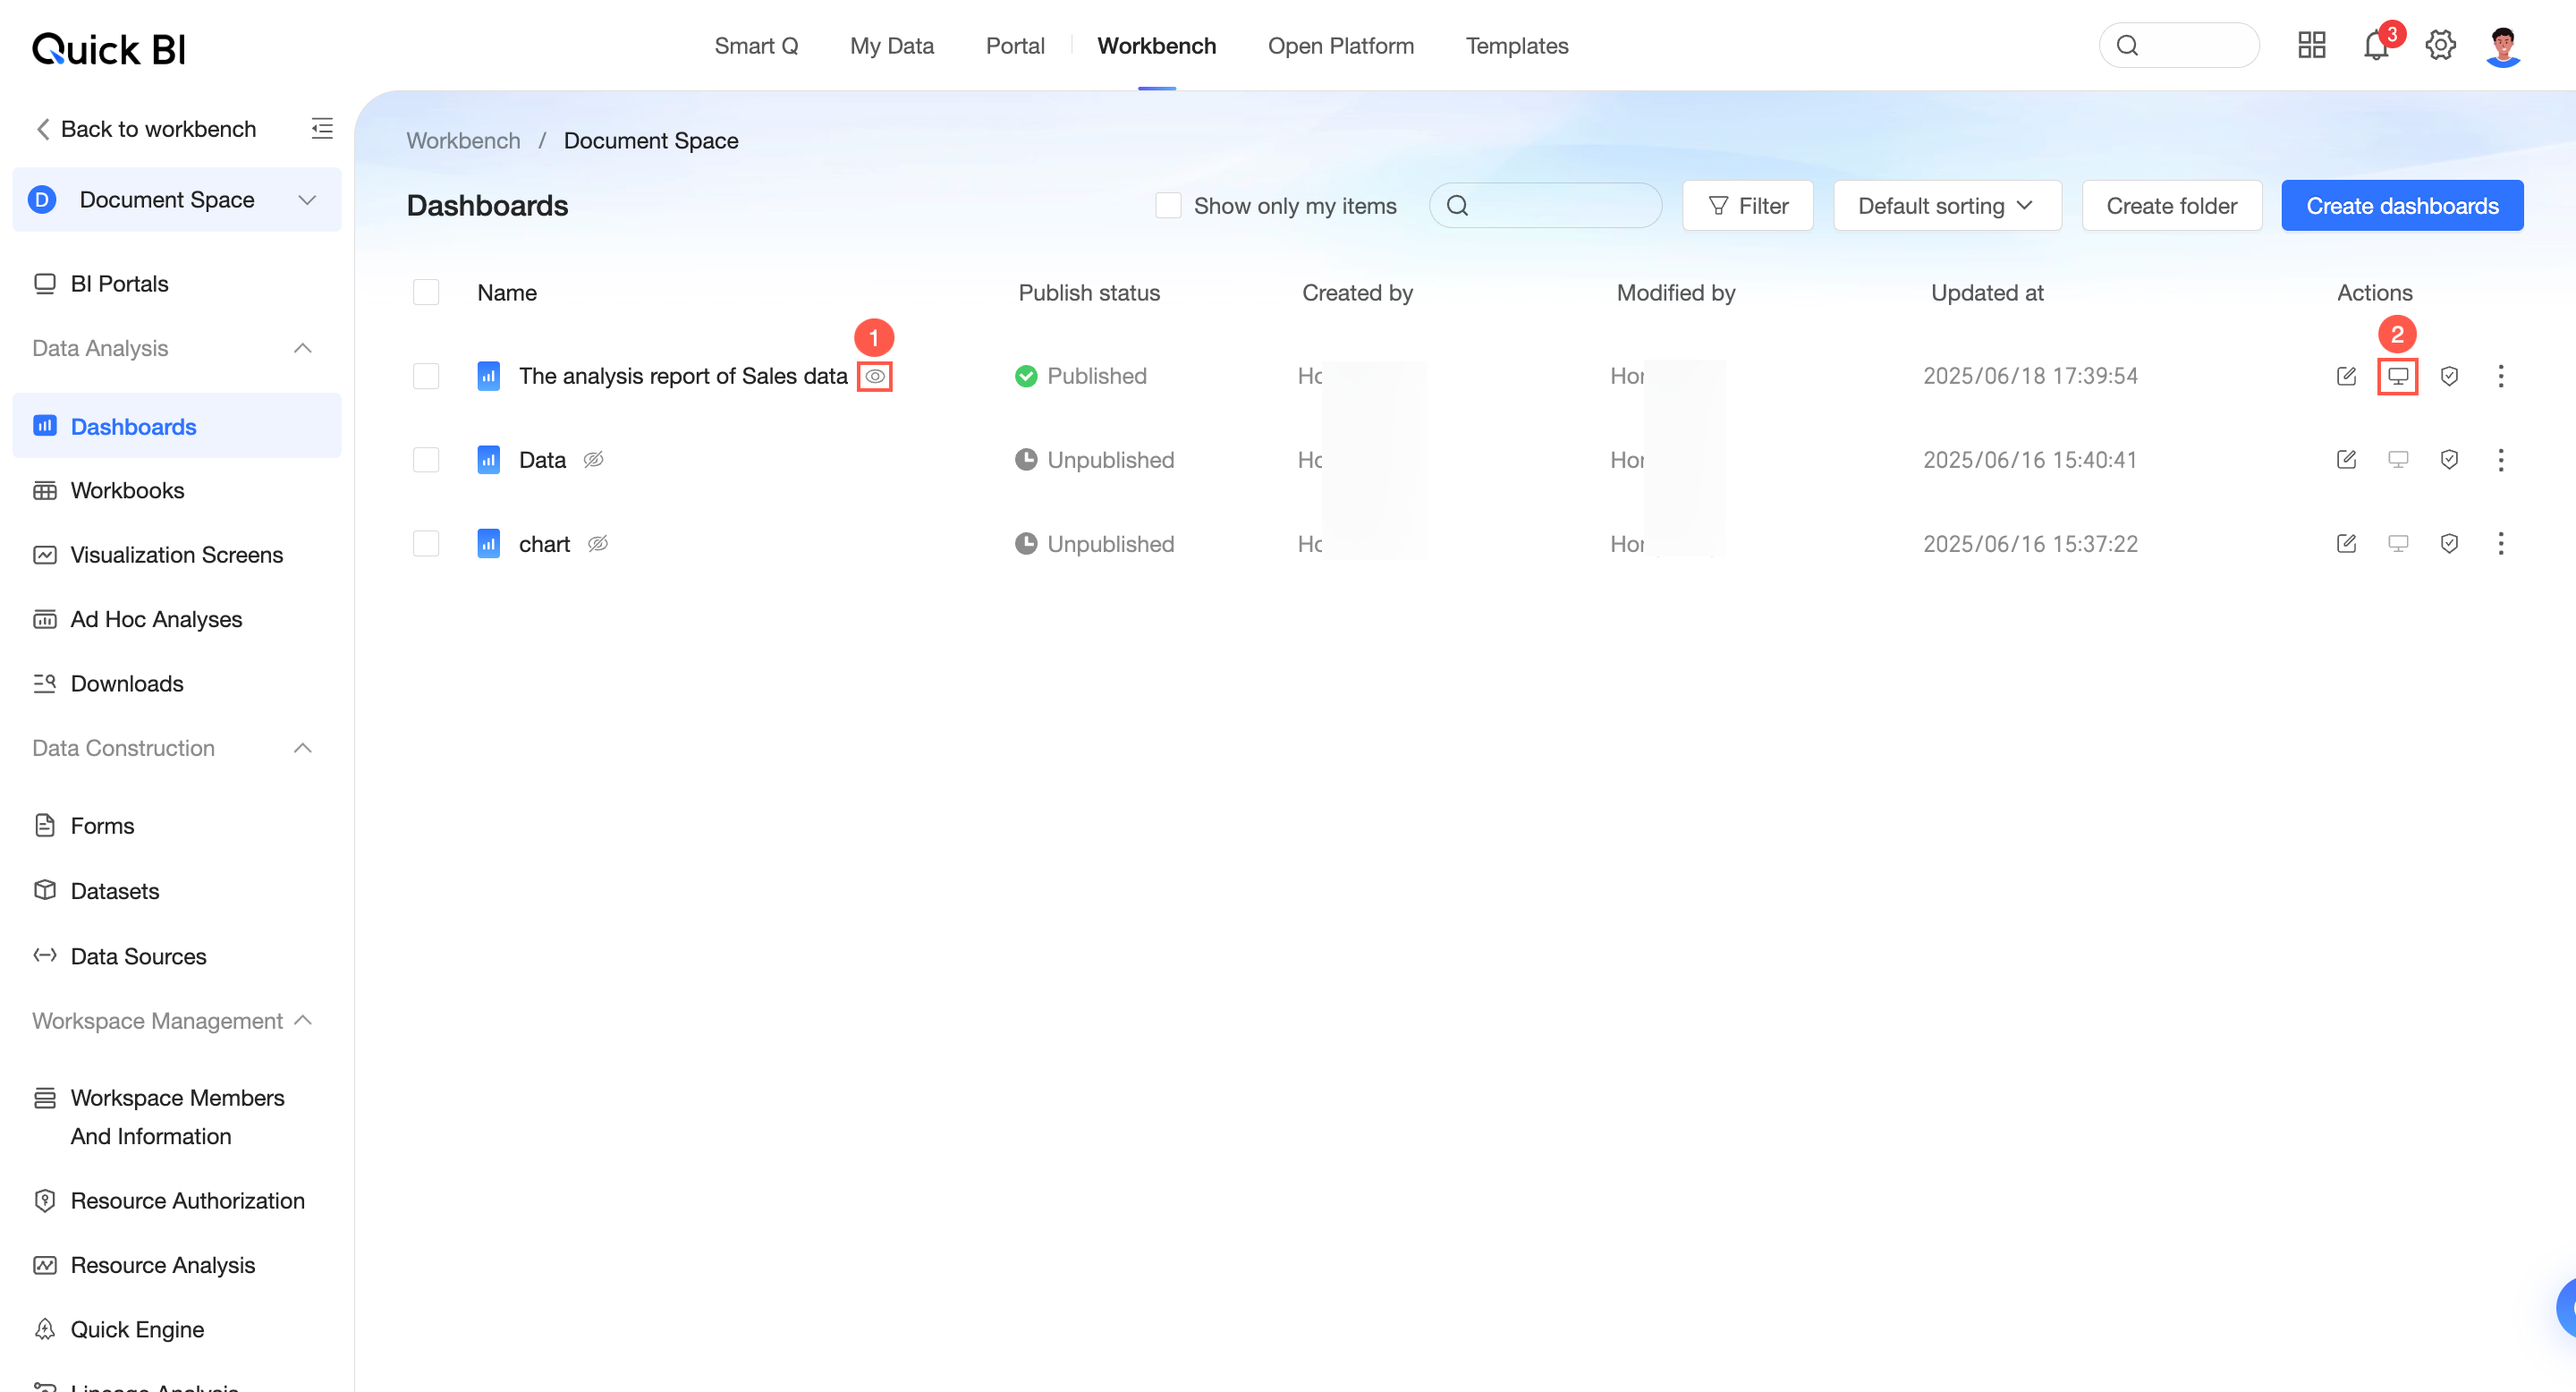
-
On the dashboard preview page, click the
 icon to open the Q Insights panel.
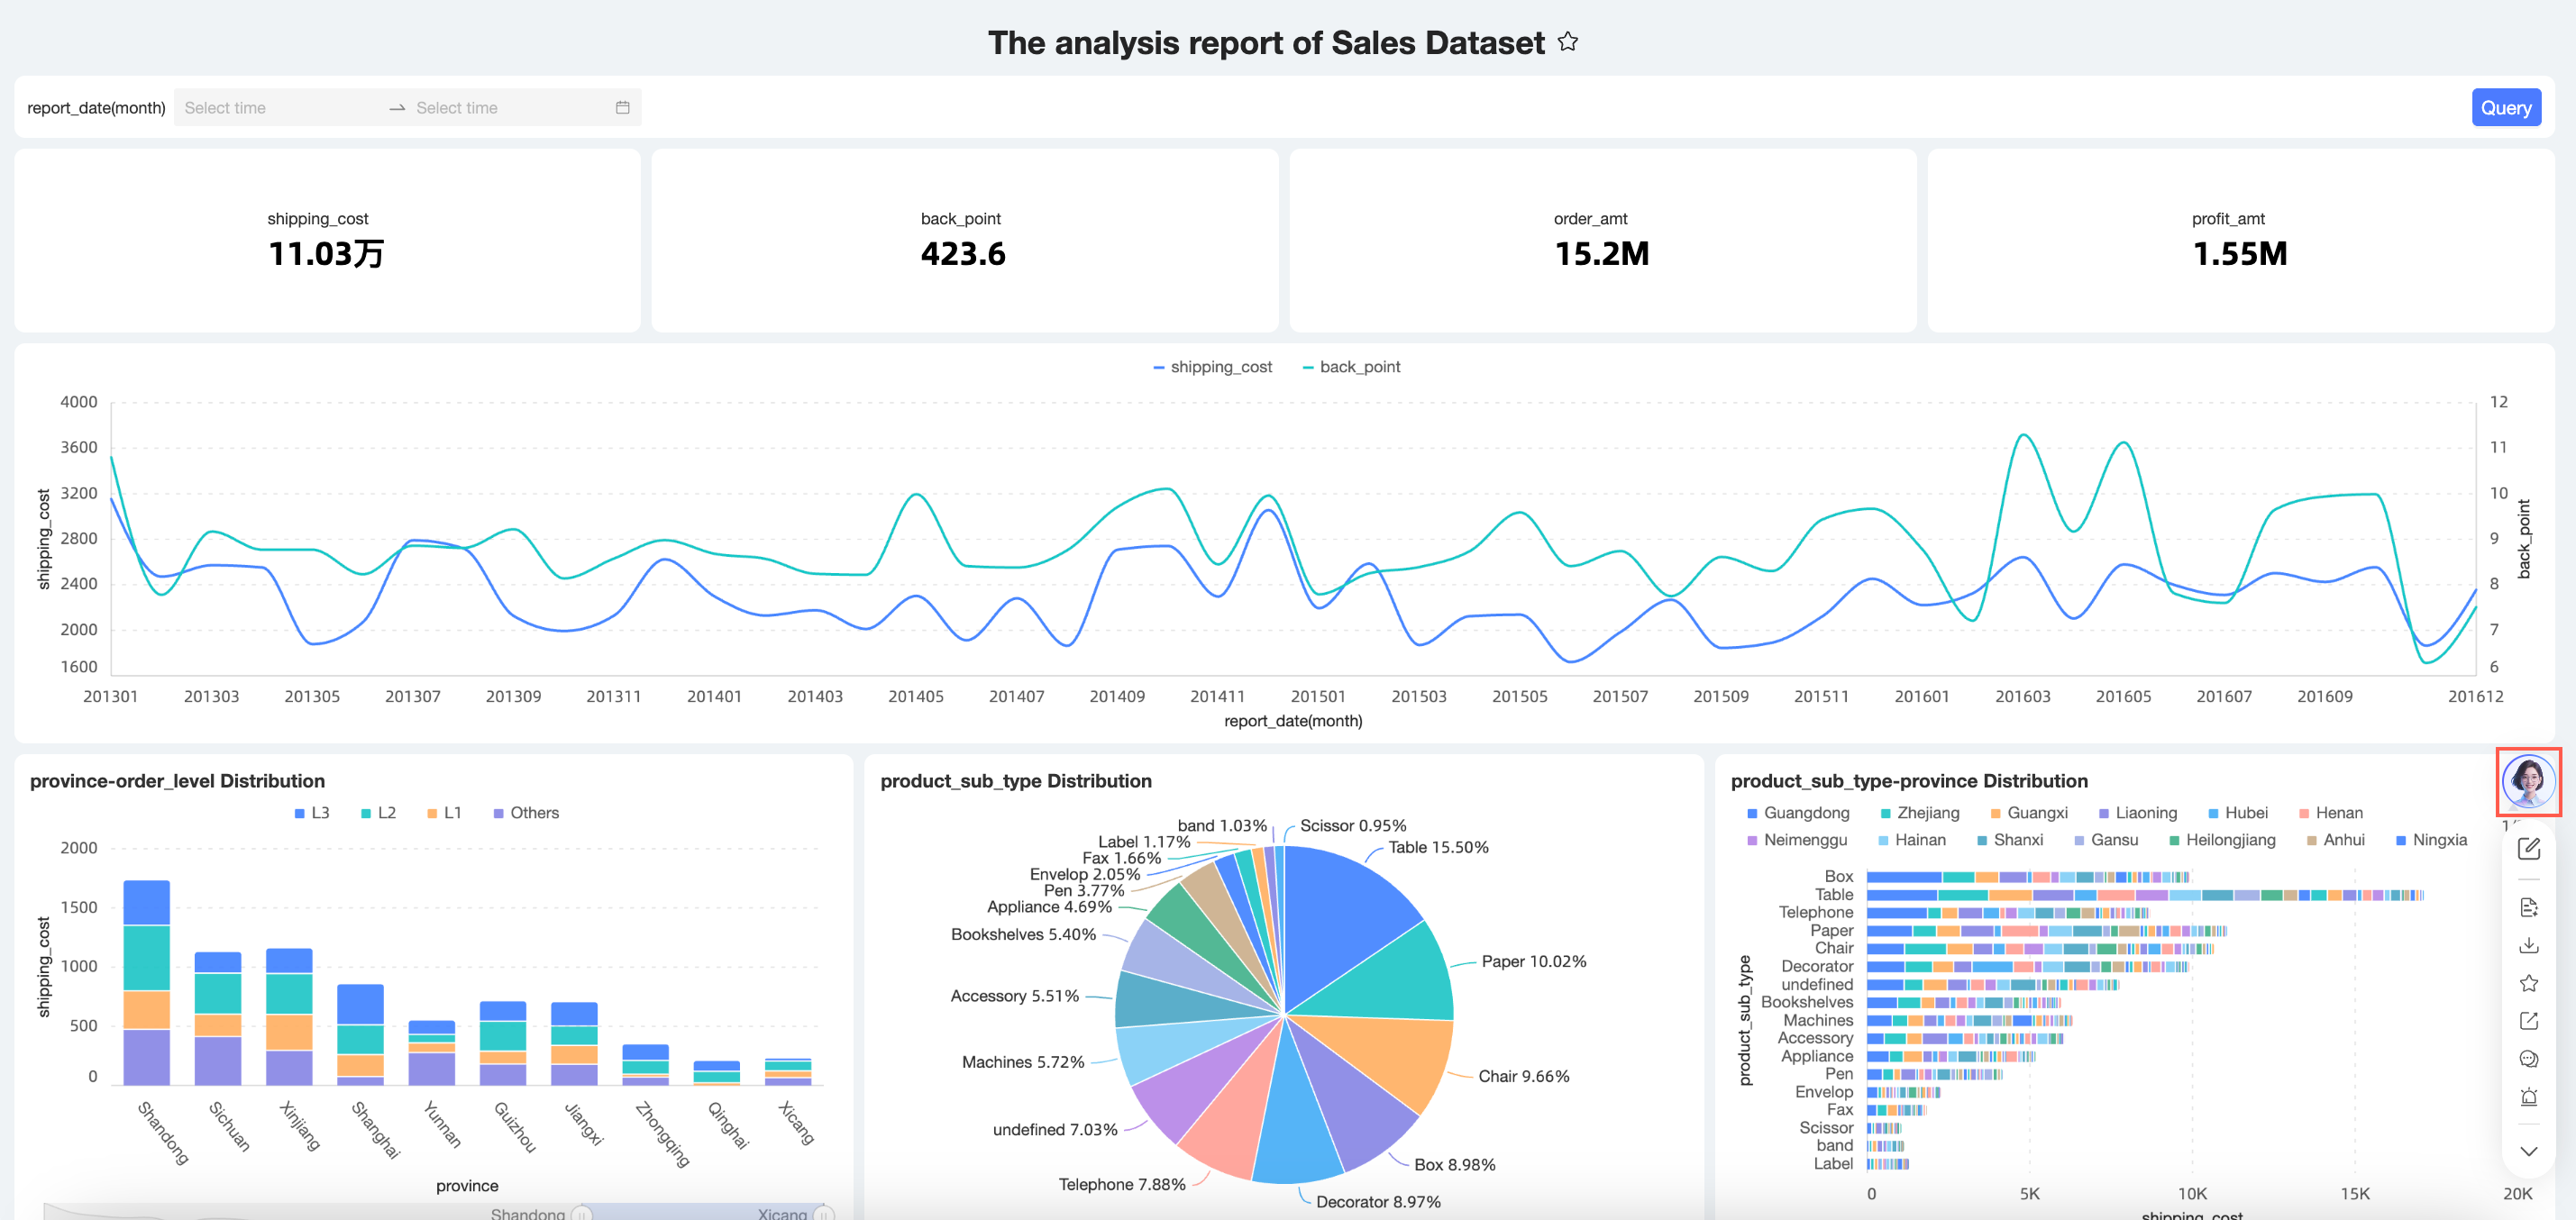
-
To interpret a single chart, hover over the chart, click the
 icon in the upper-right corner, and select Q Insights.
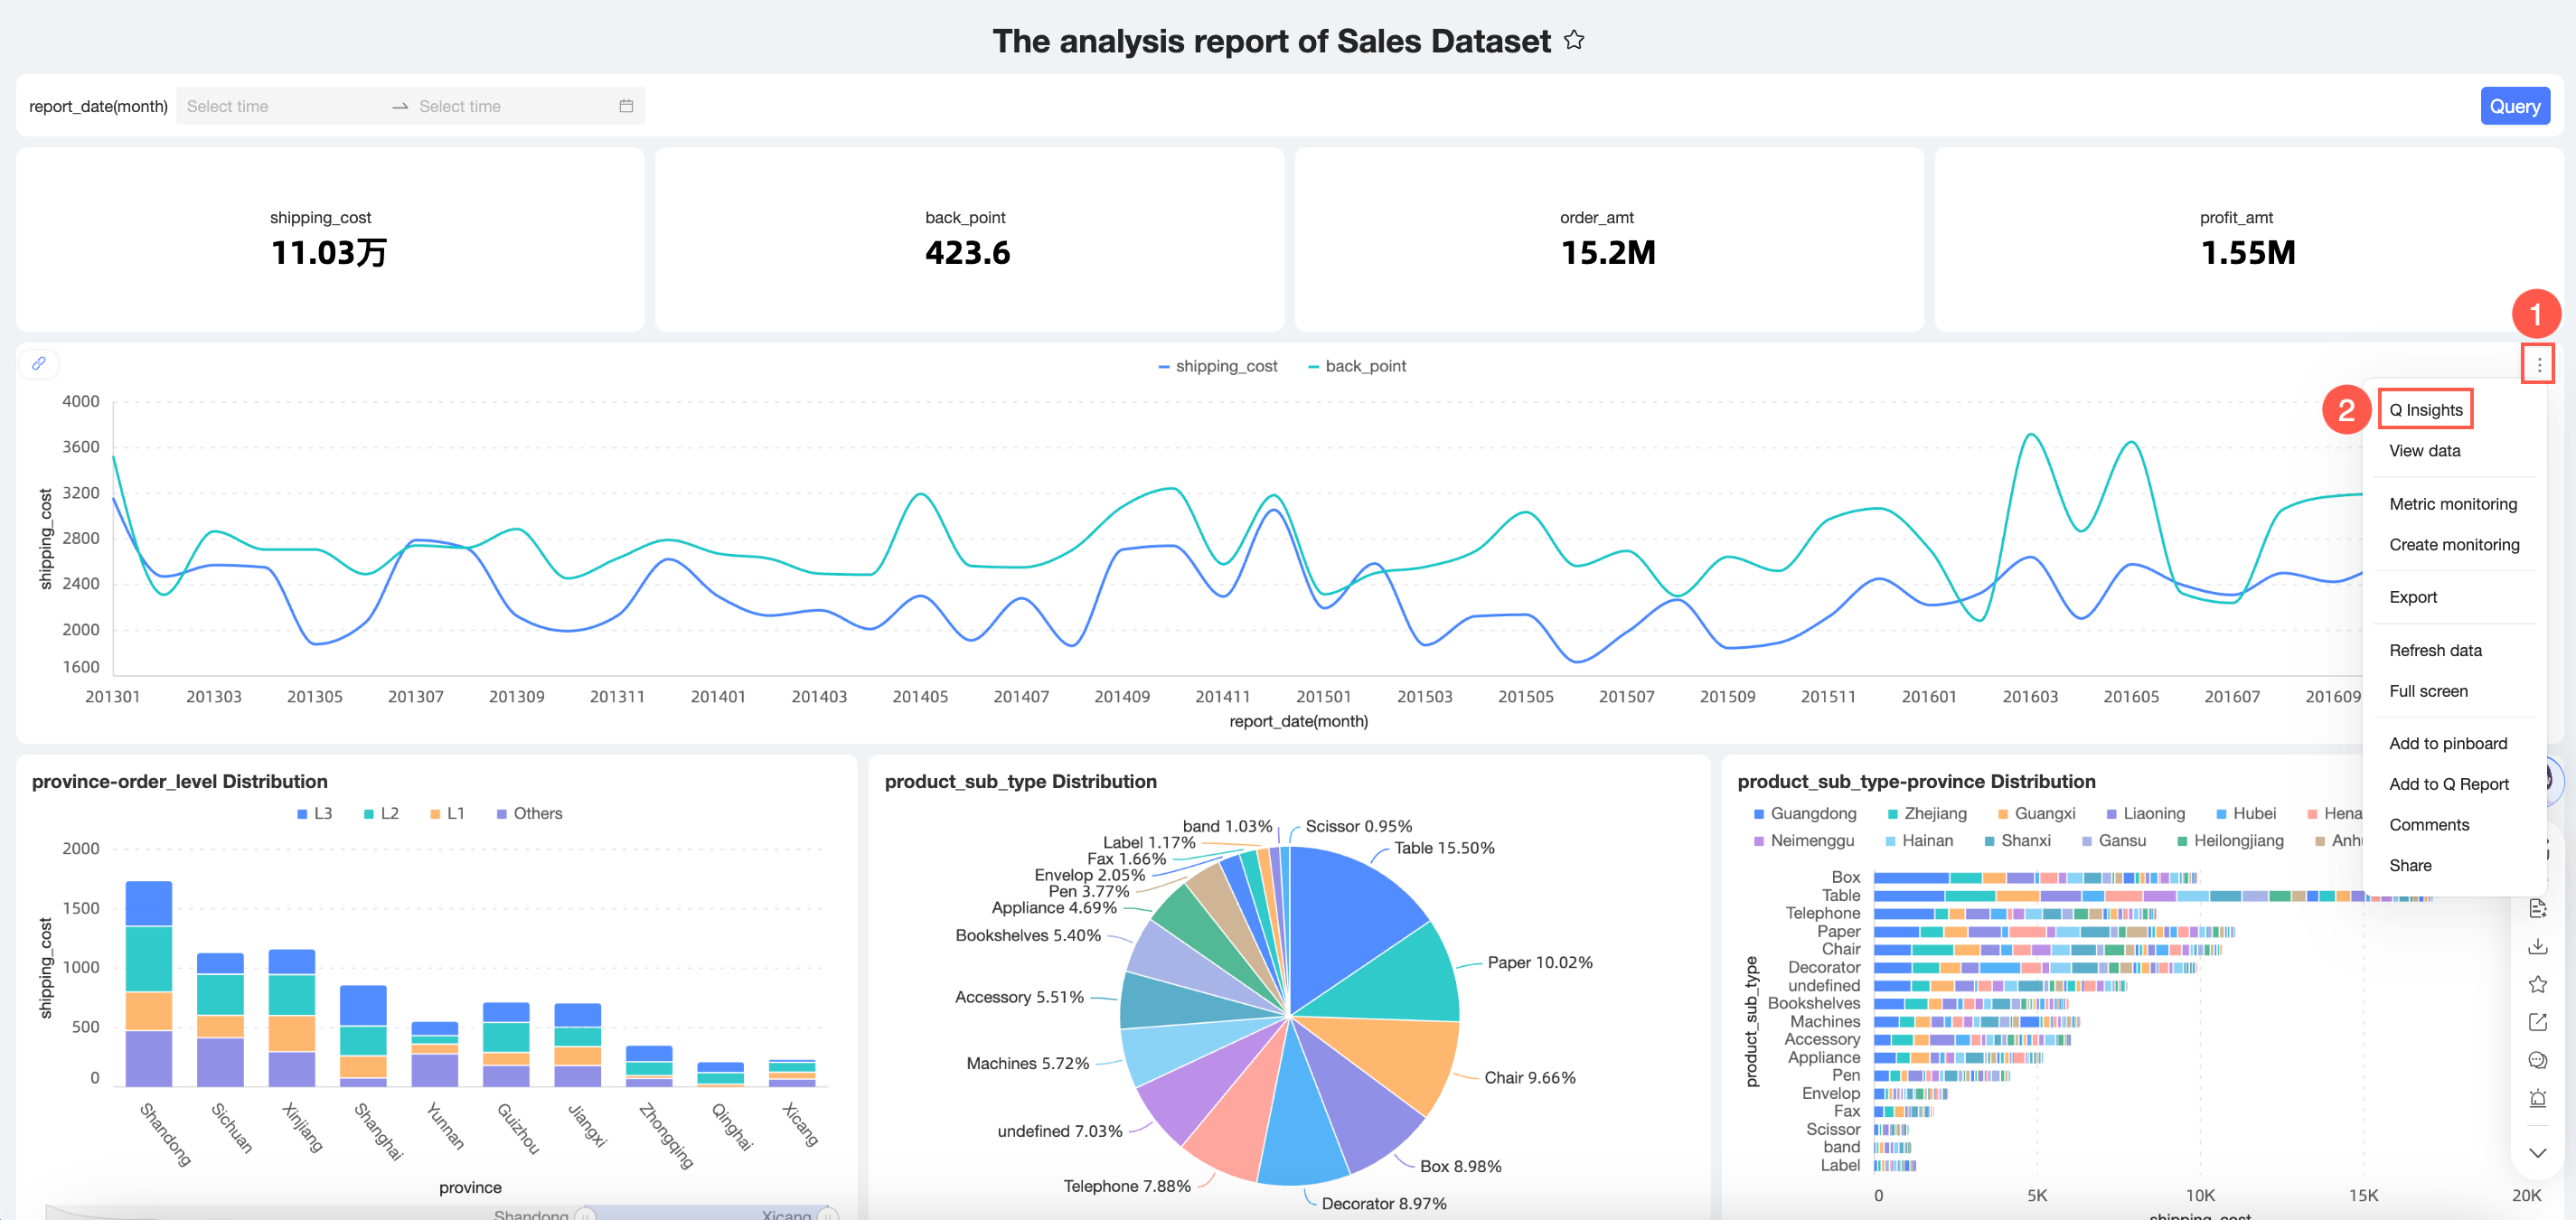
The following sections use Method 2 as an example.
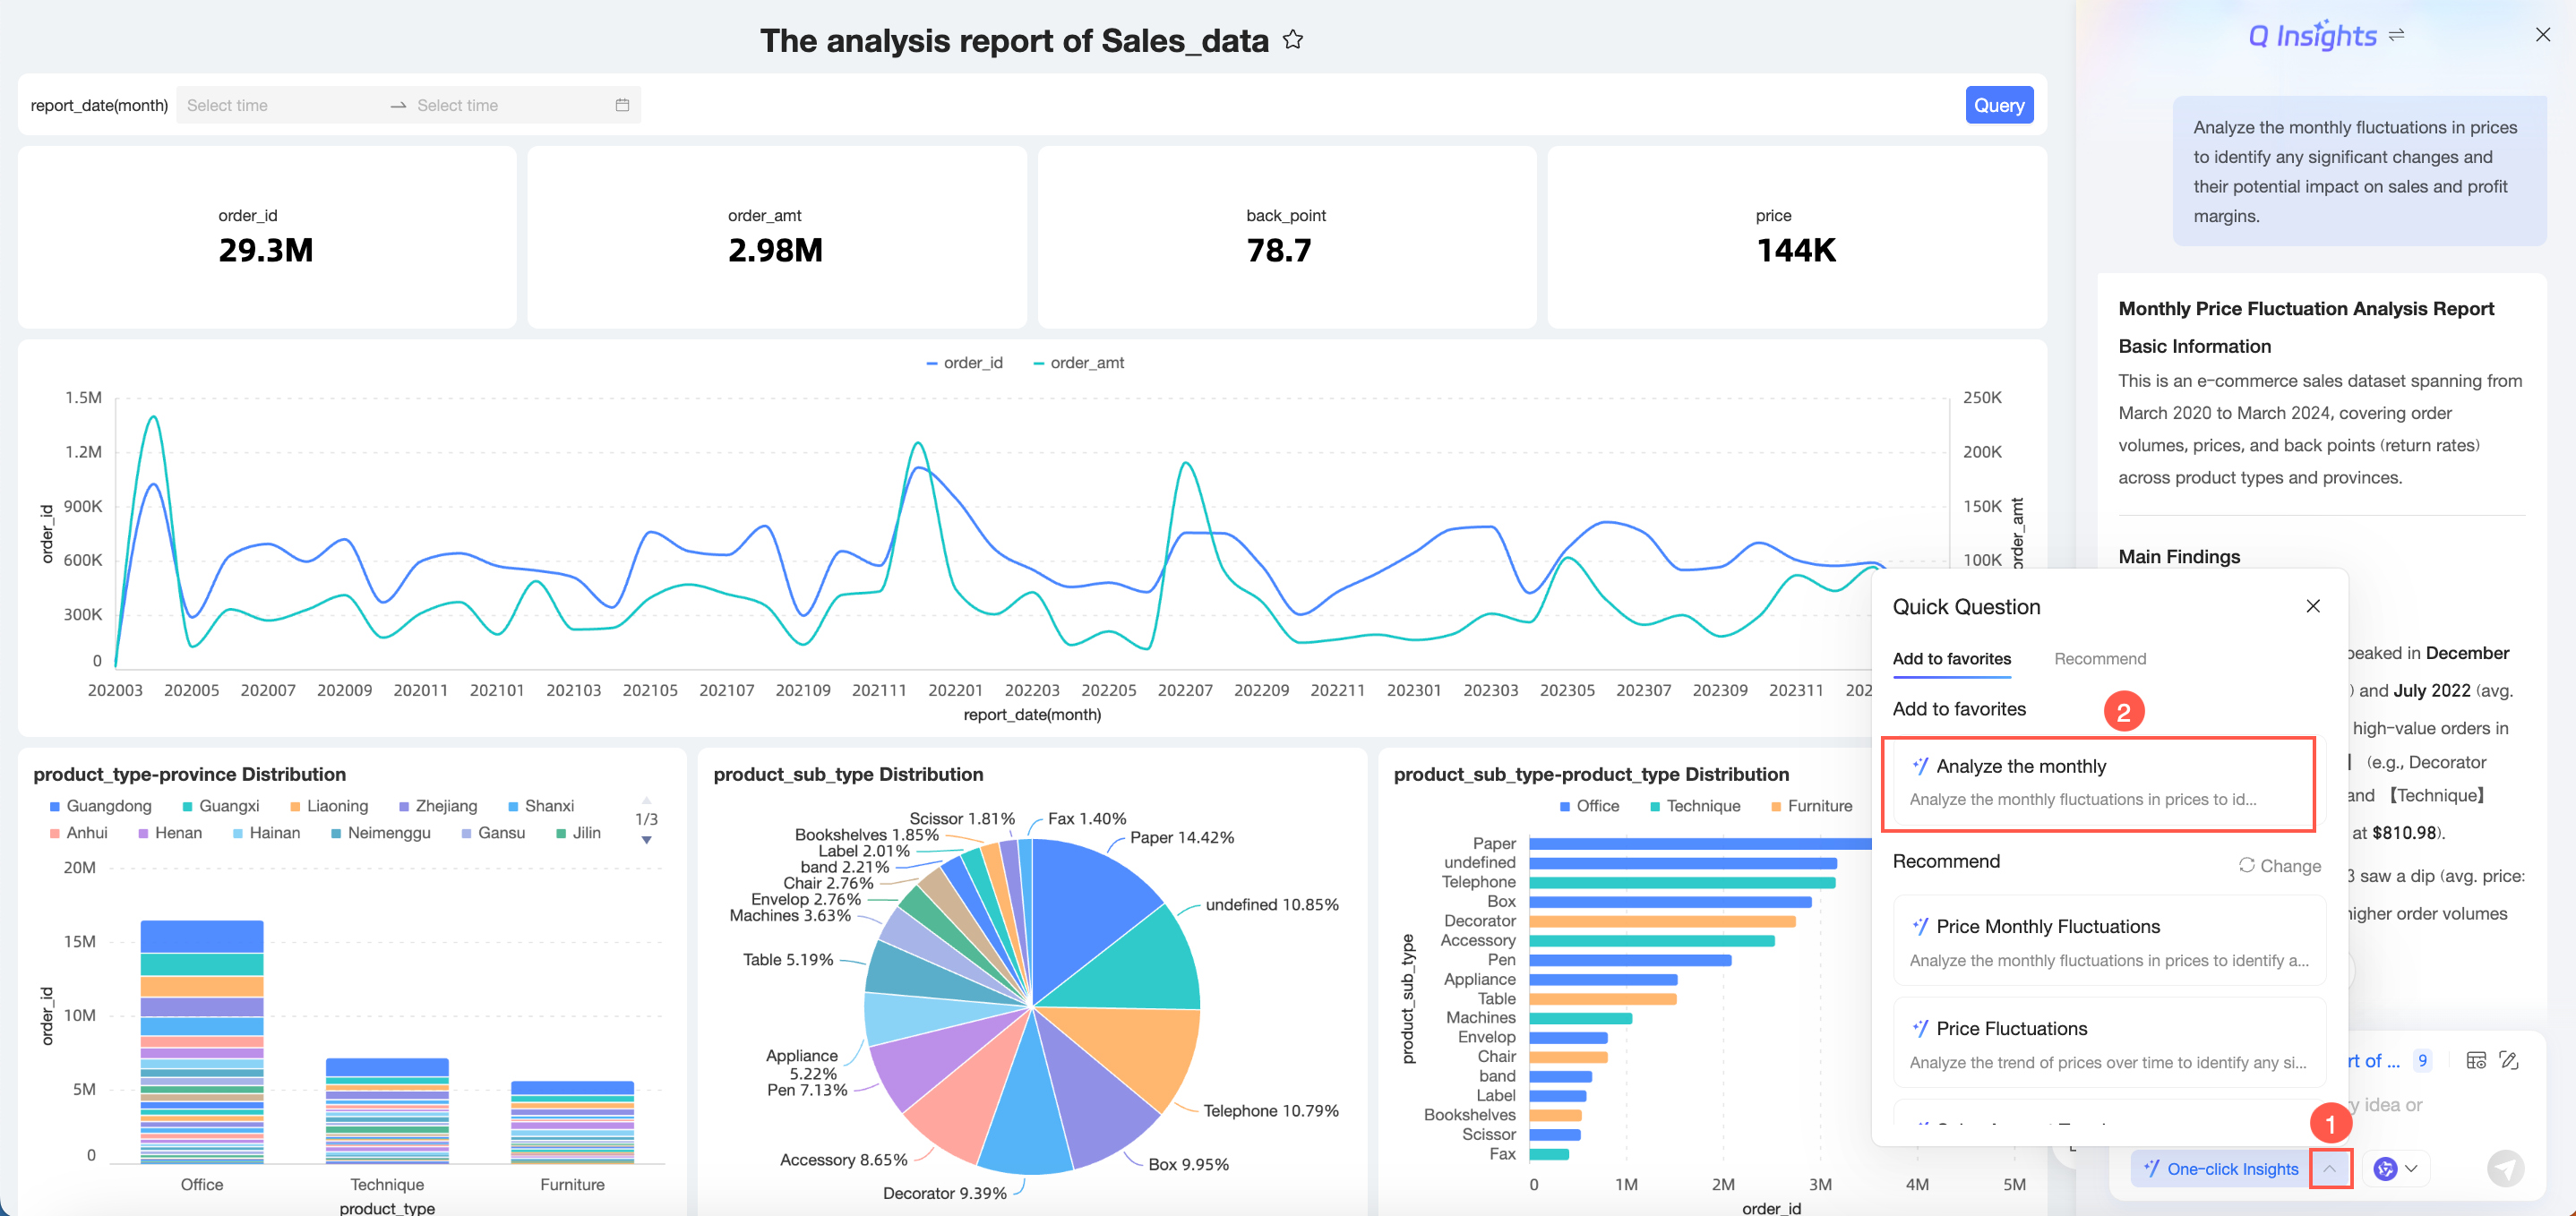
Recommended questions
-
The system automatically generates recommended questions for the current dashboard. You can click a question to ask it directly.
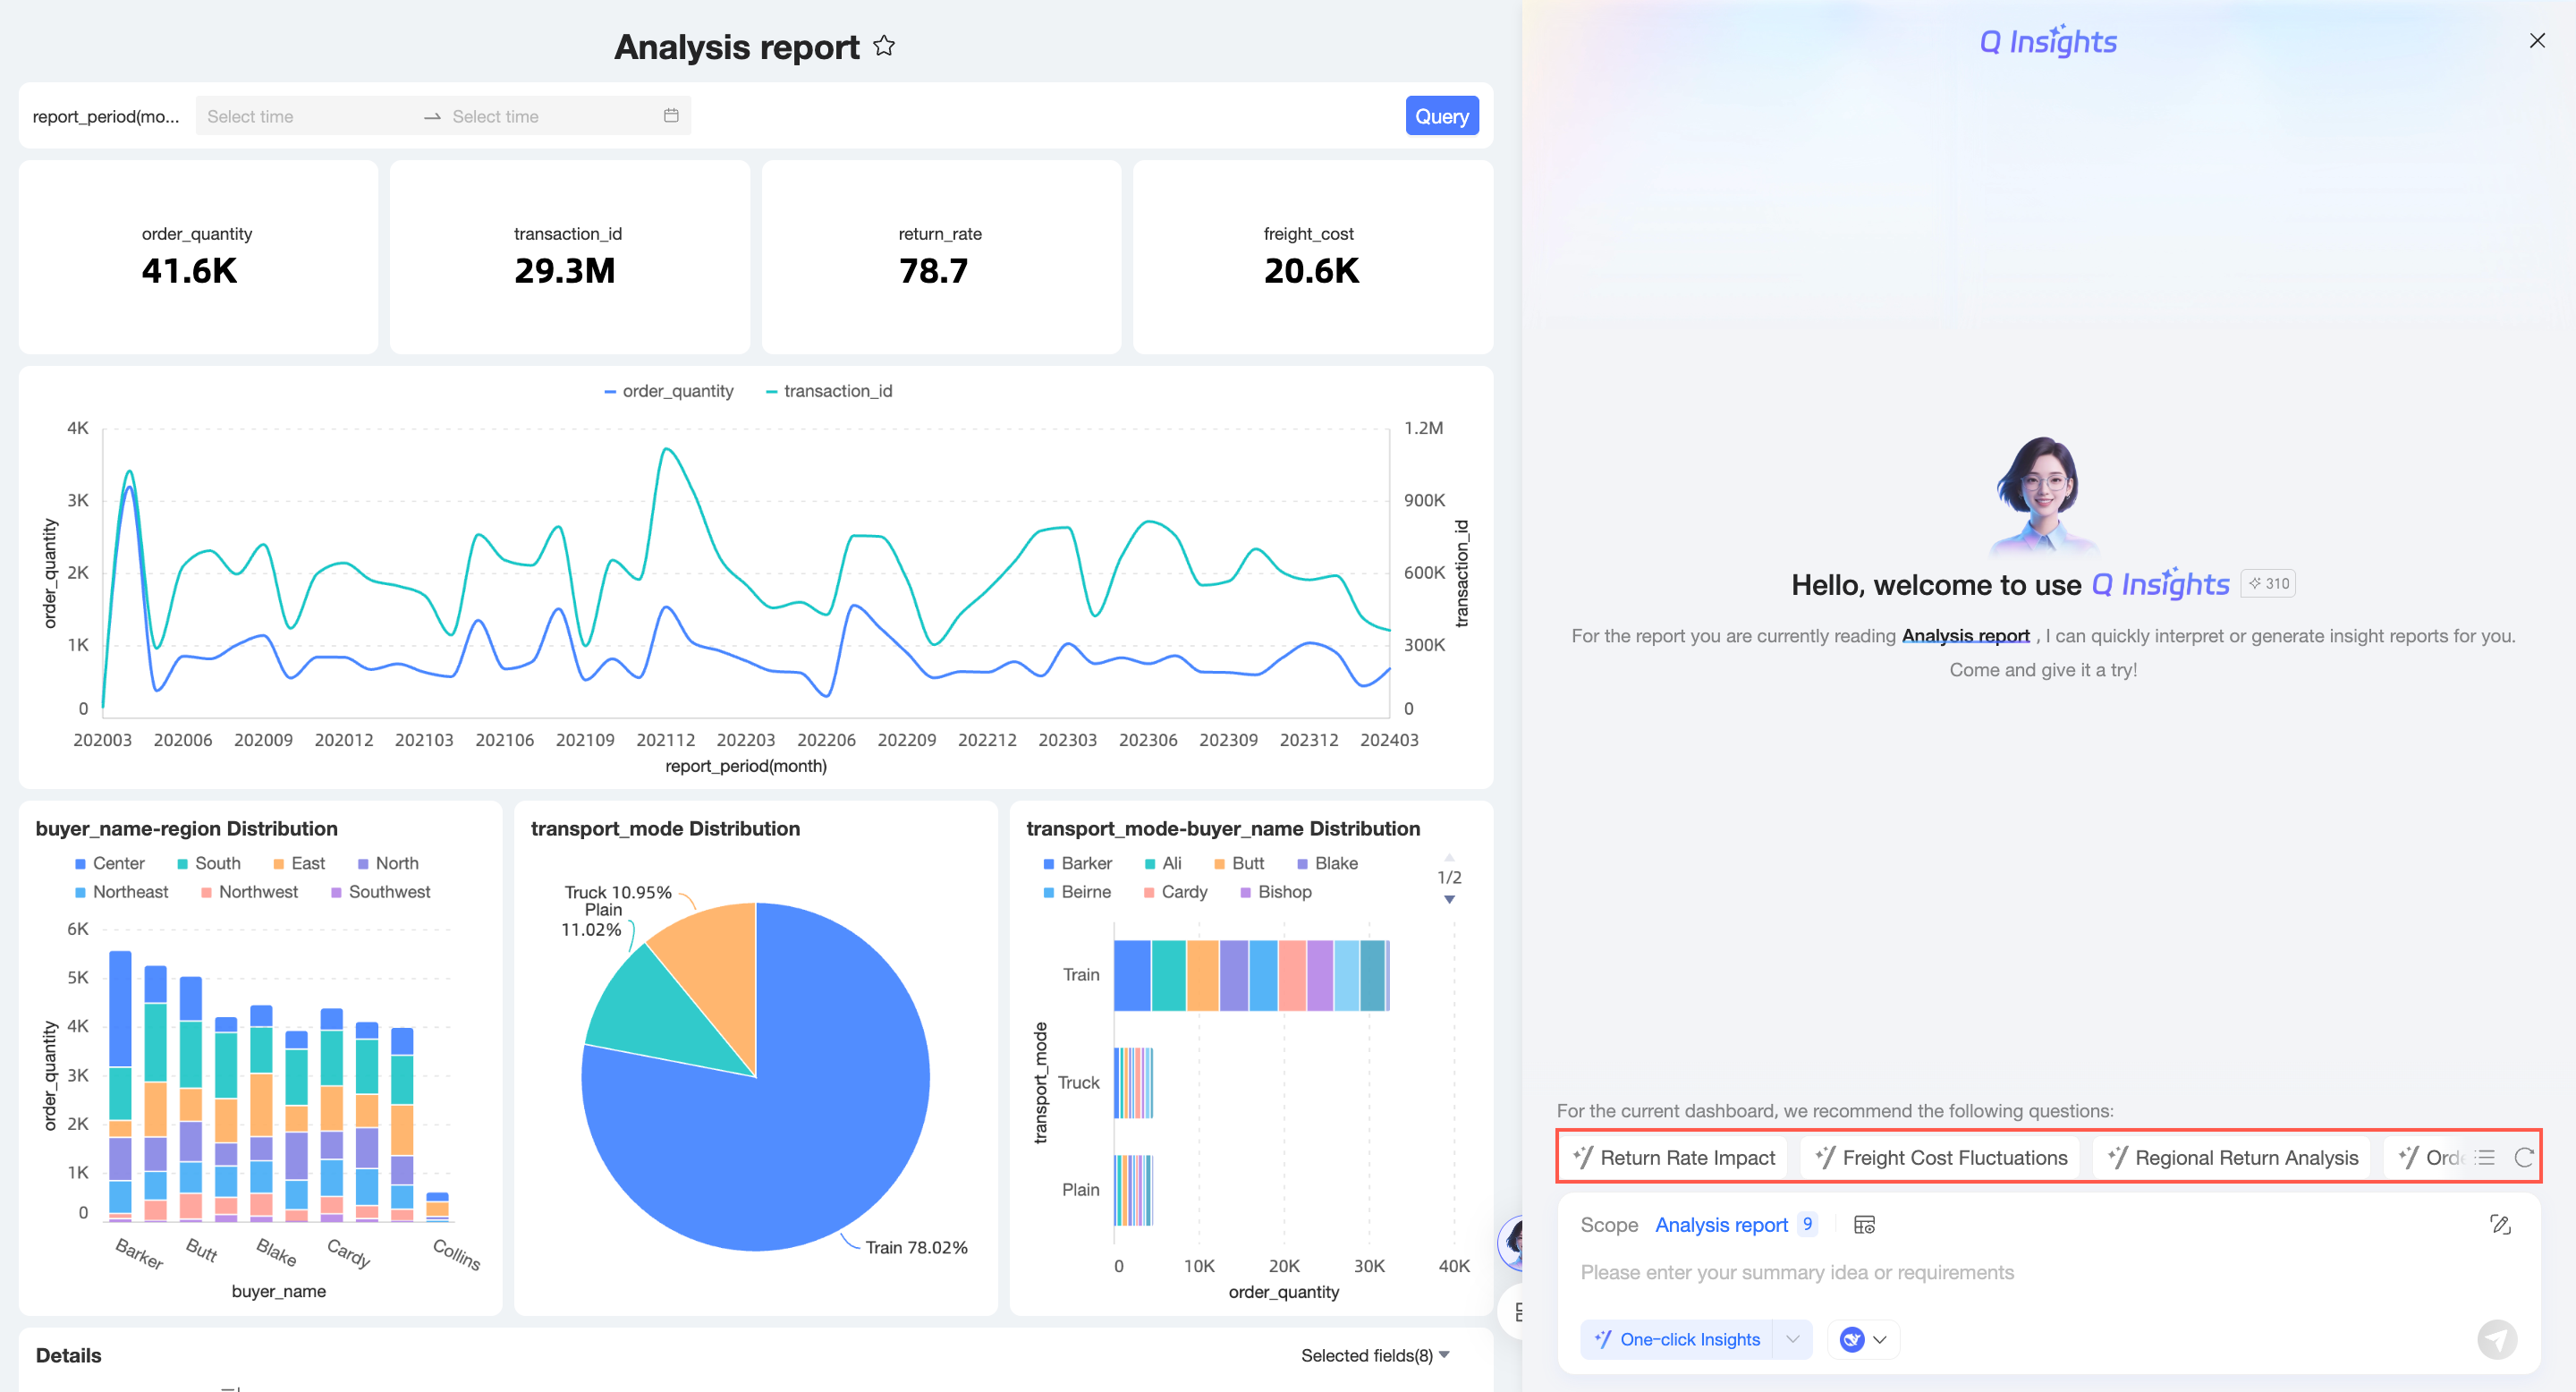 Click the
  icon to get a new set of recommended questions.
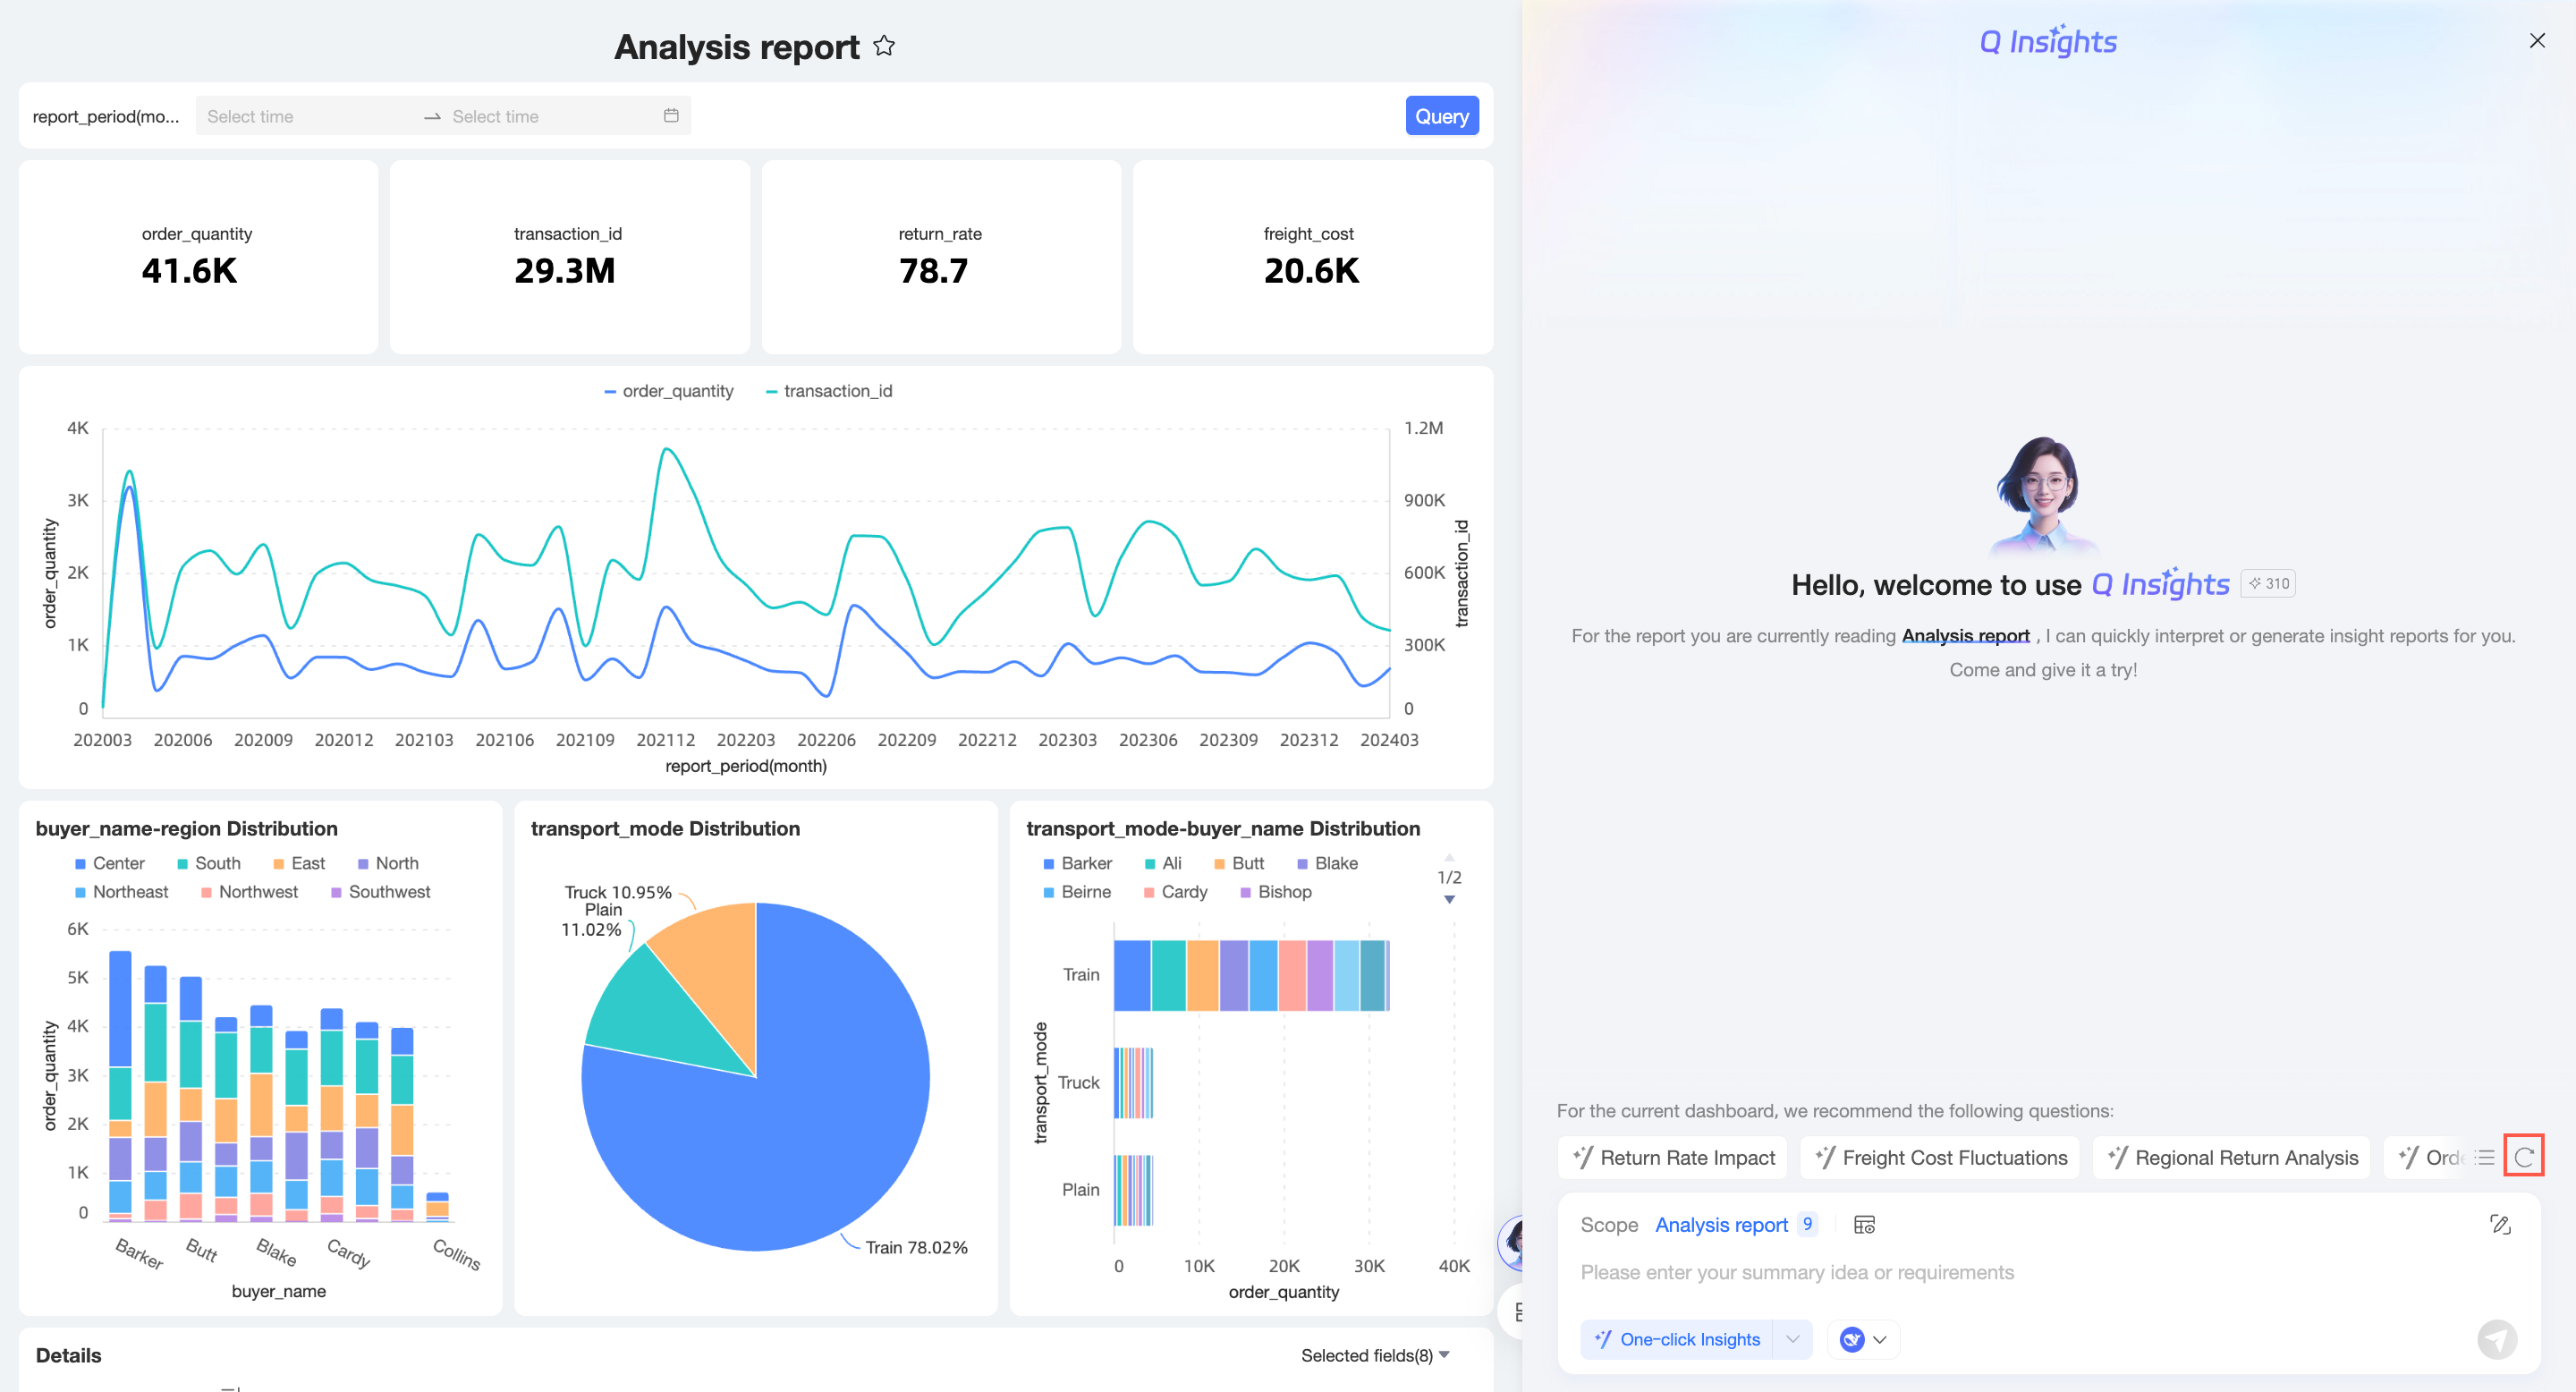
-
You can also click the
 icon in the lower-left corner to access Quick Questions.
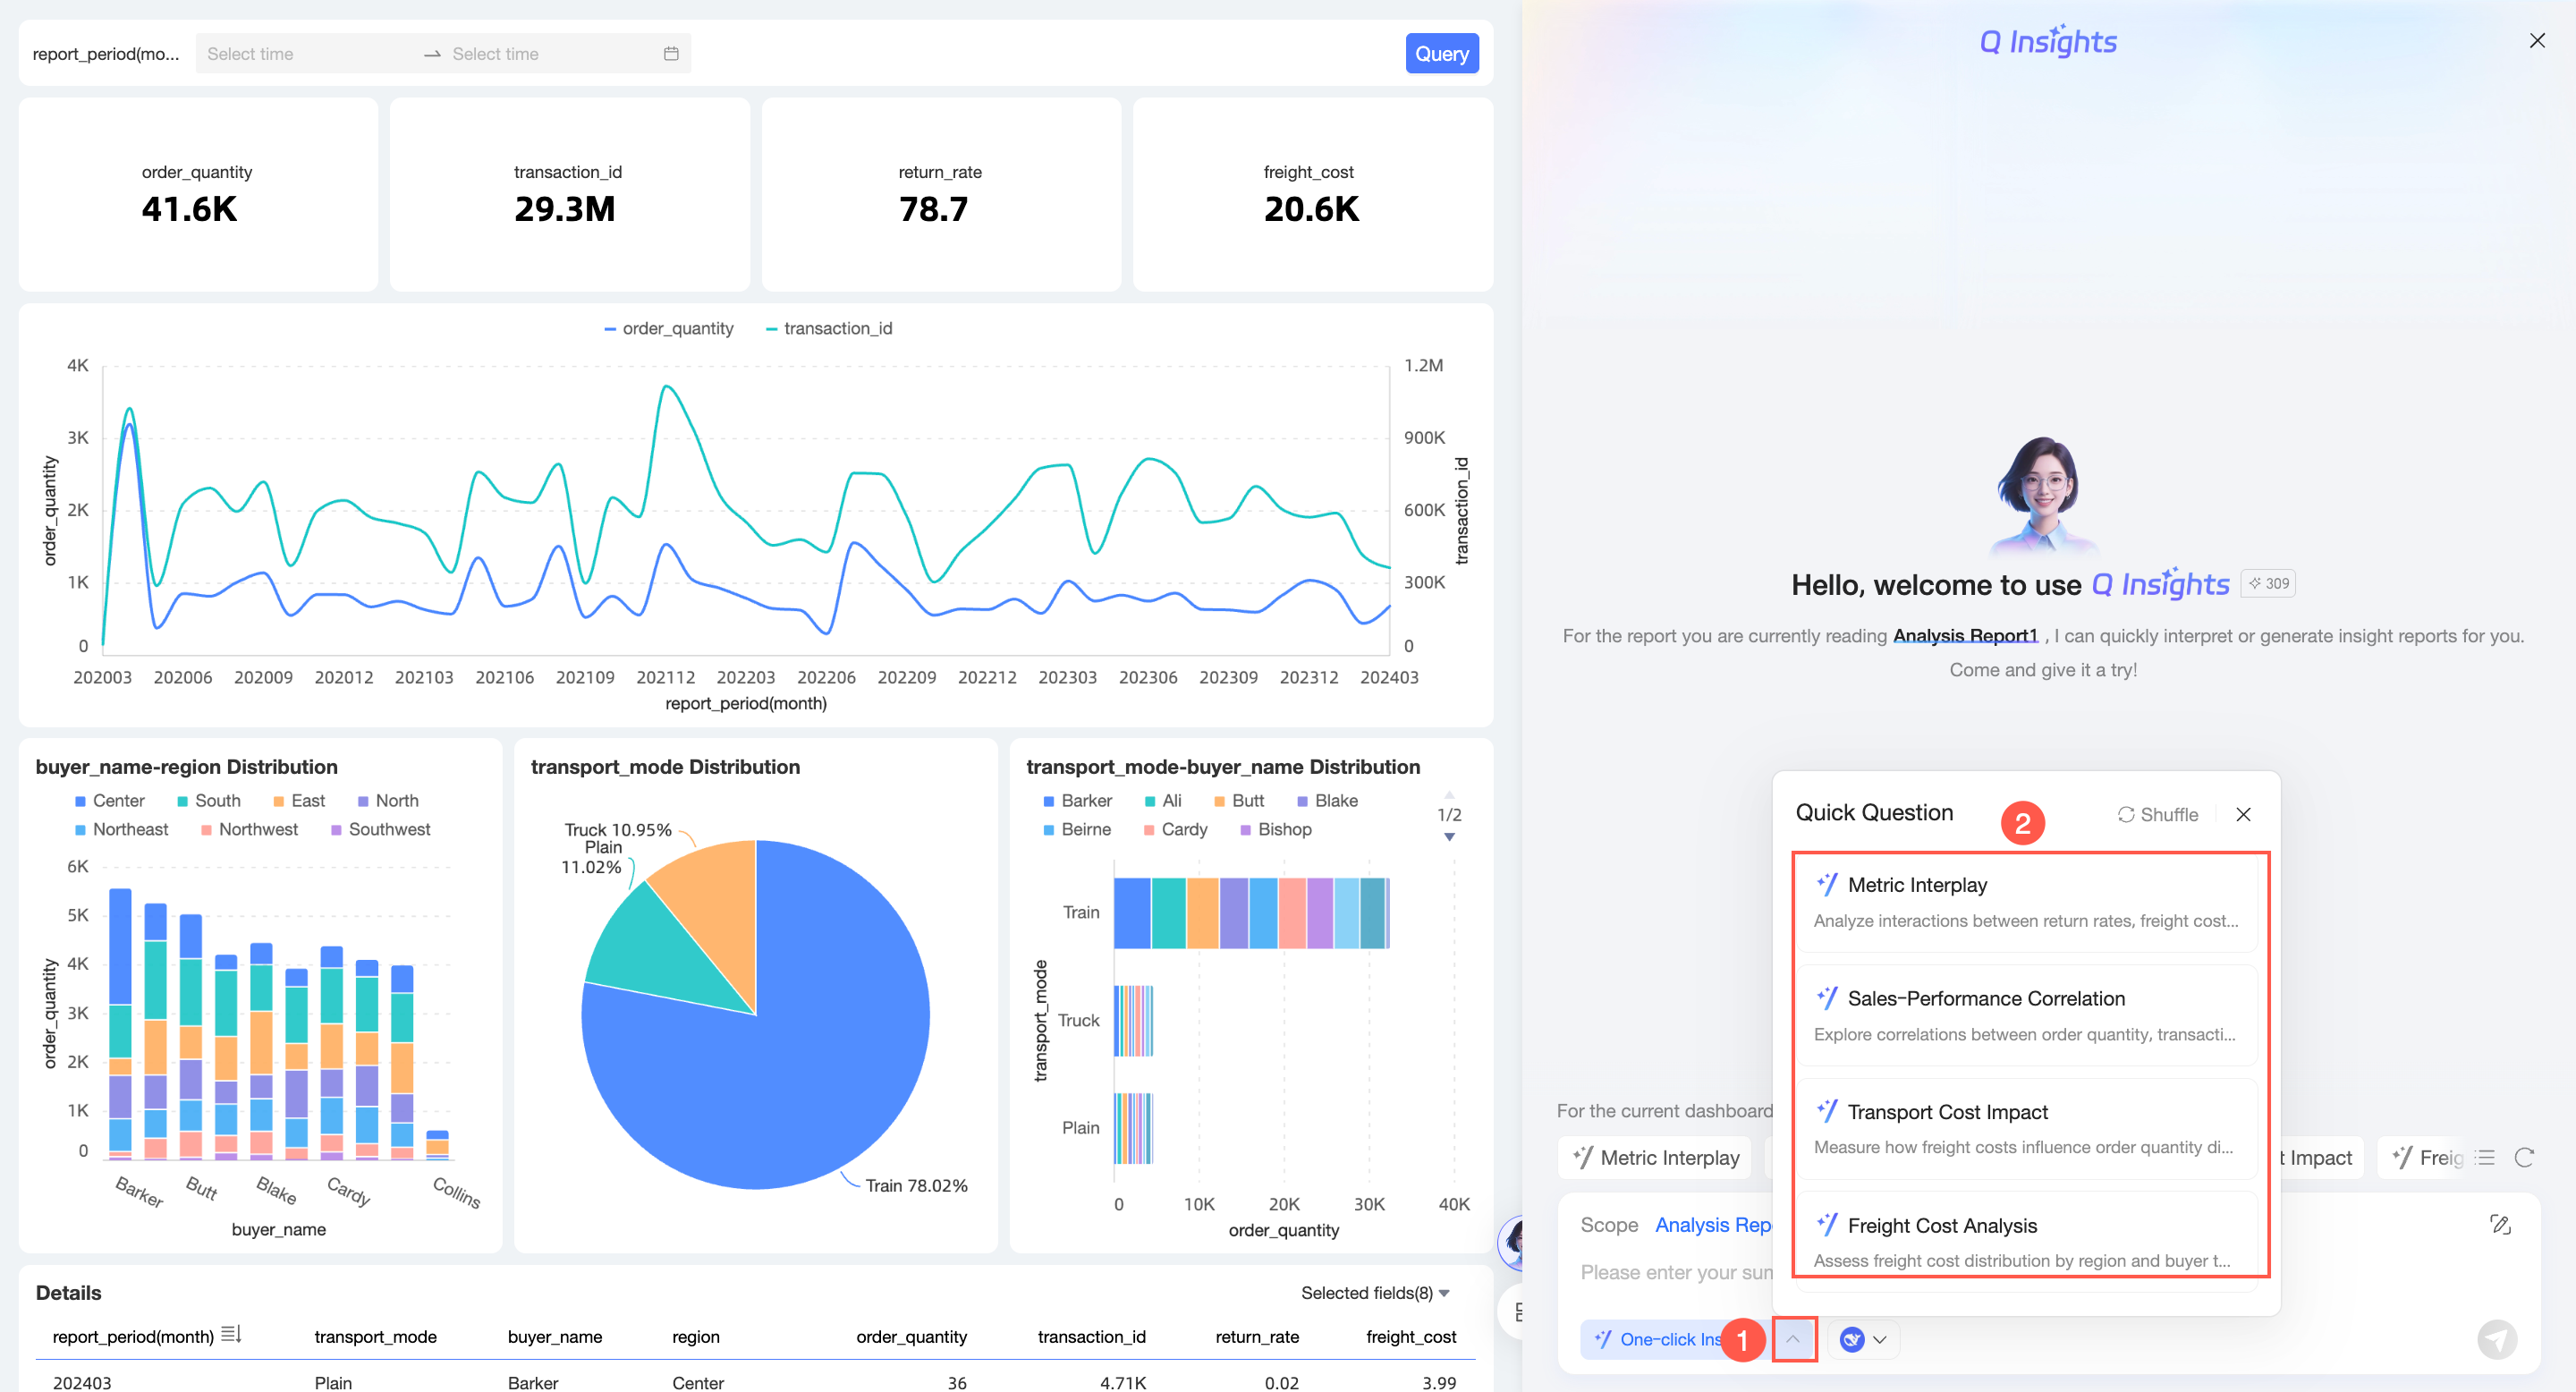 Click the Refresh icon to get another recommended question.
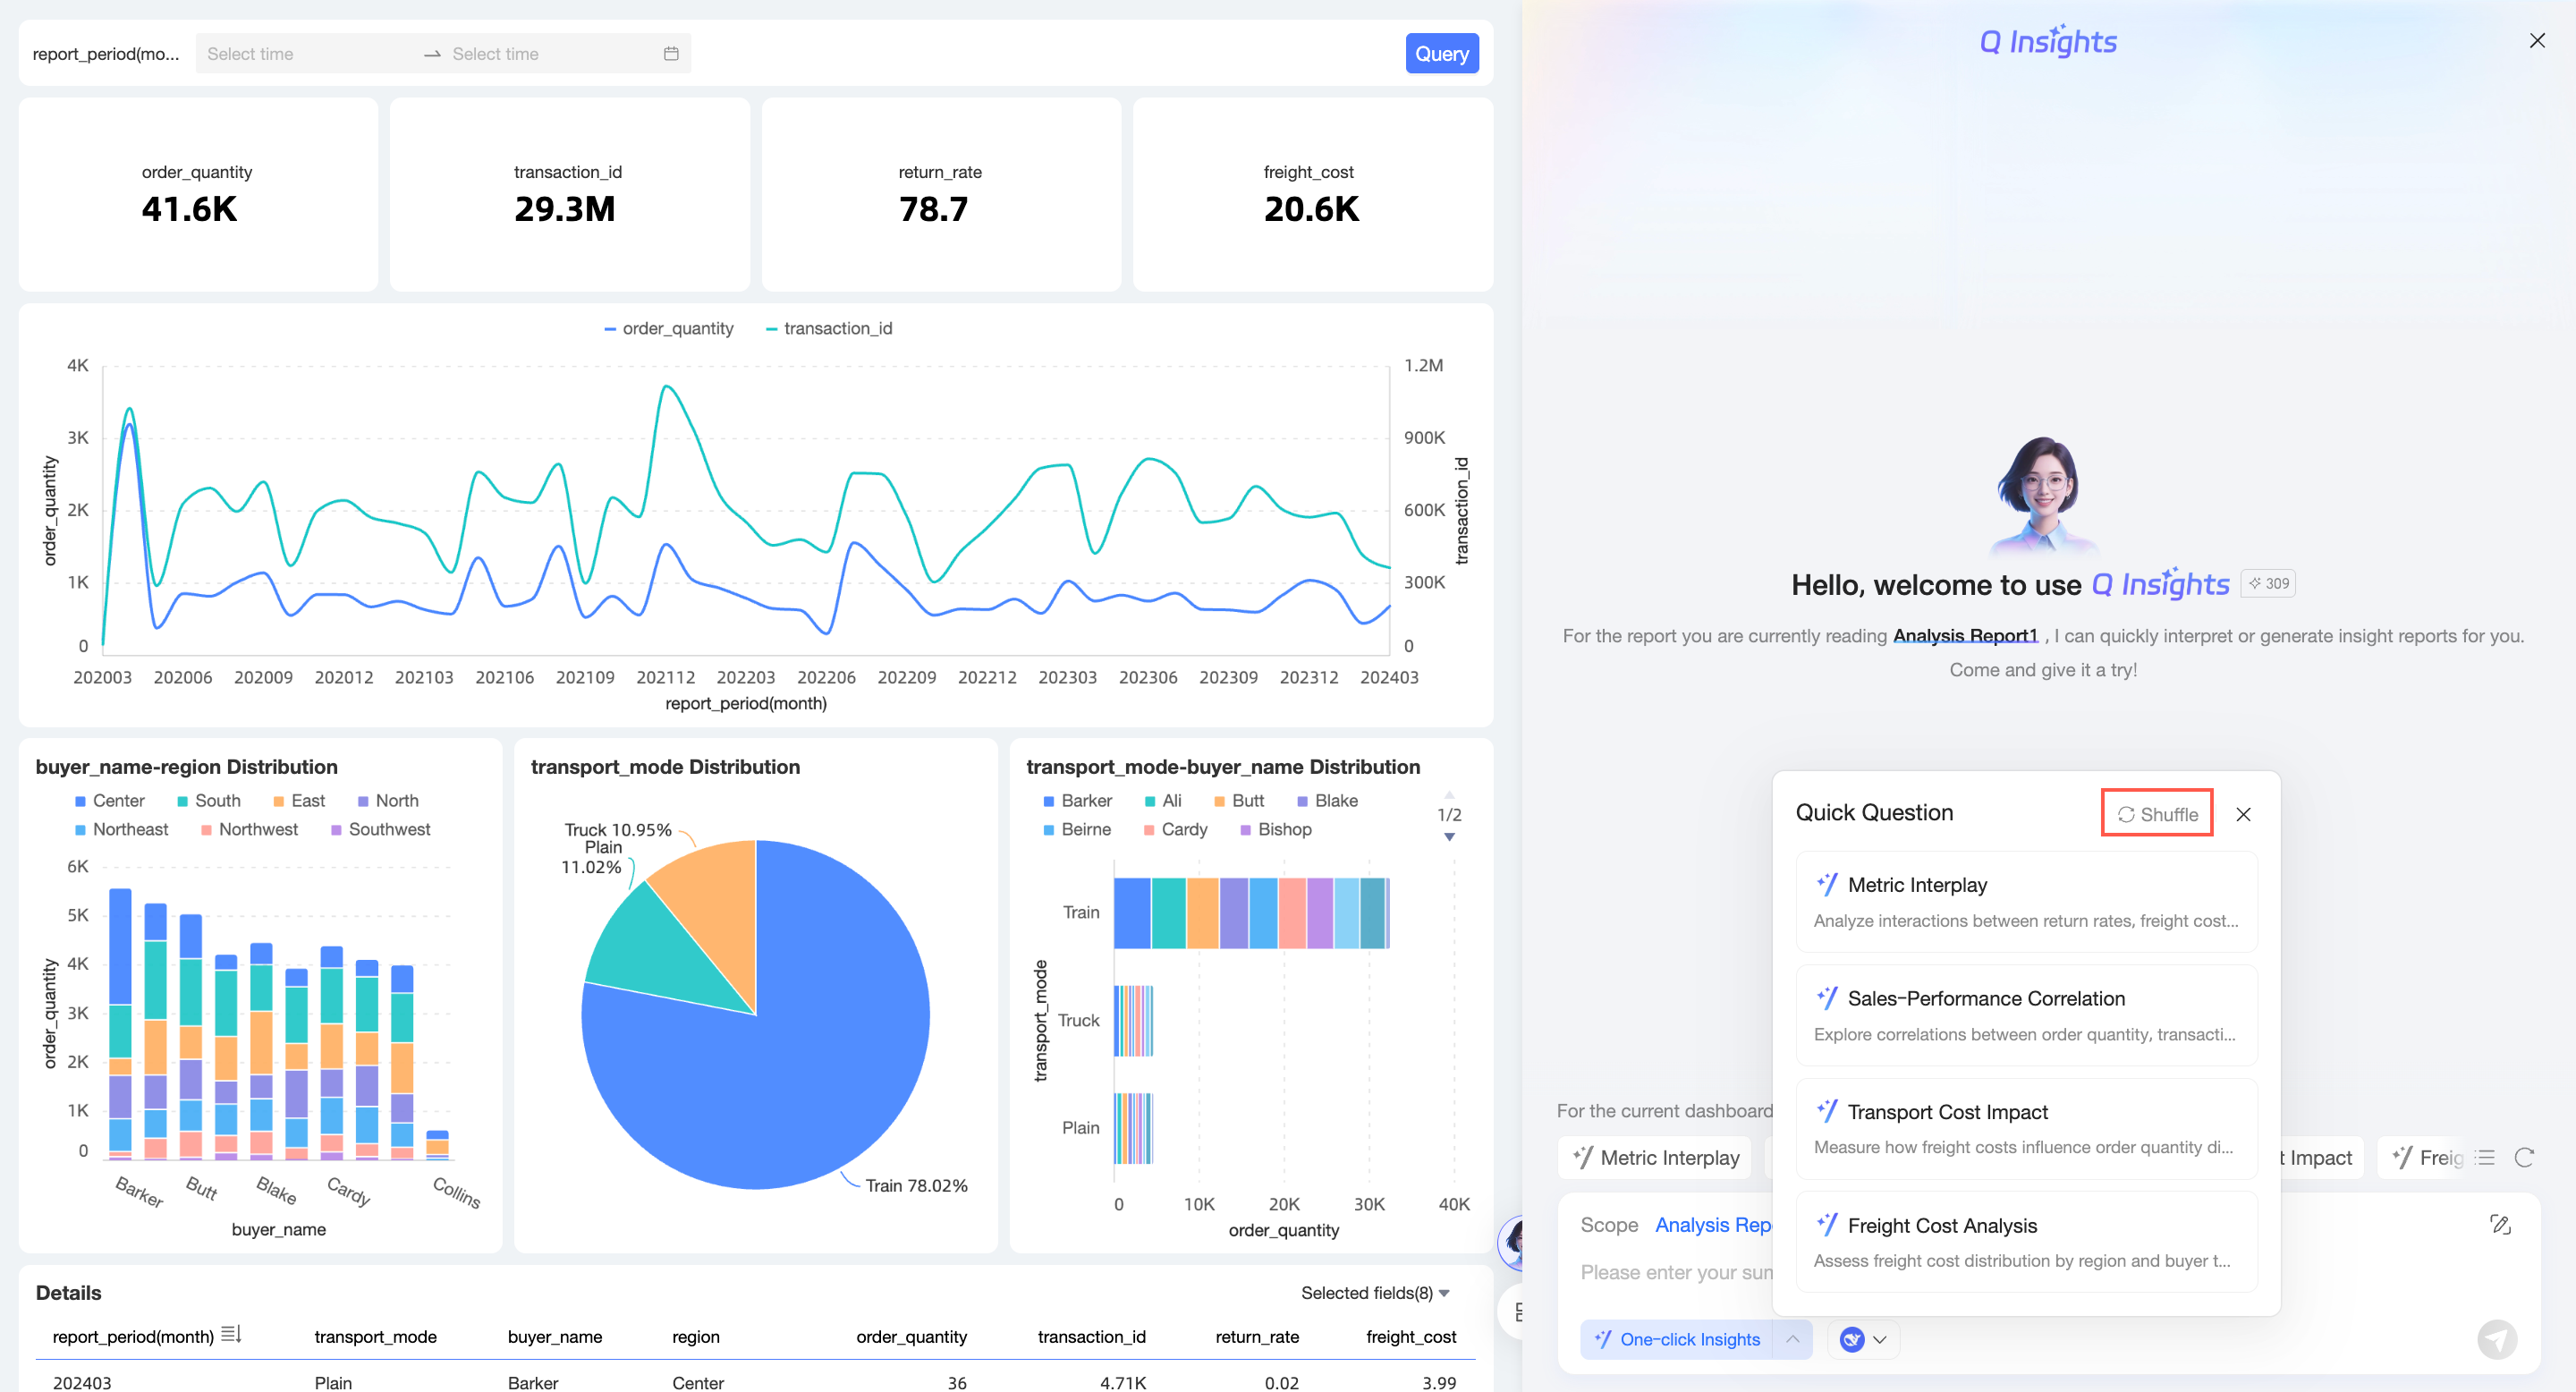
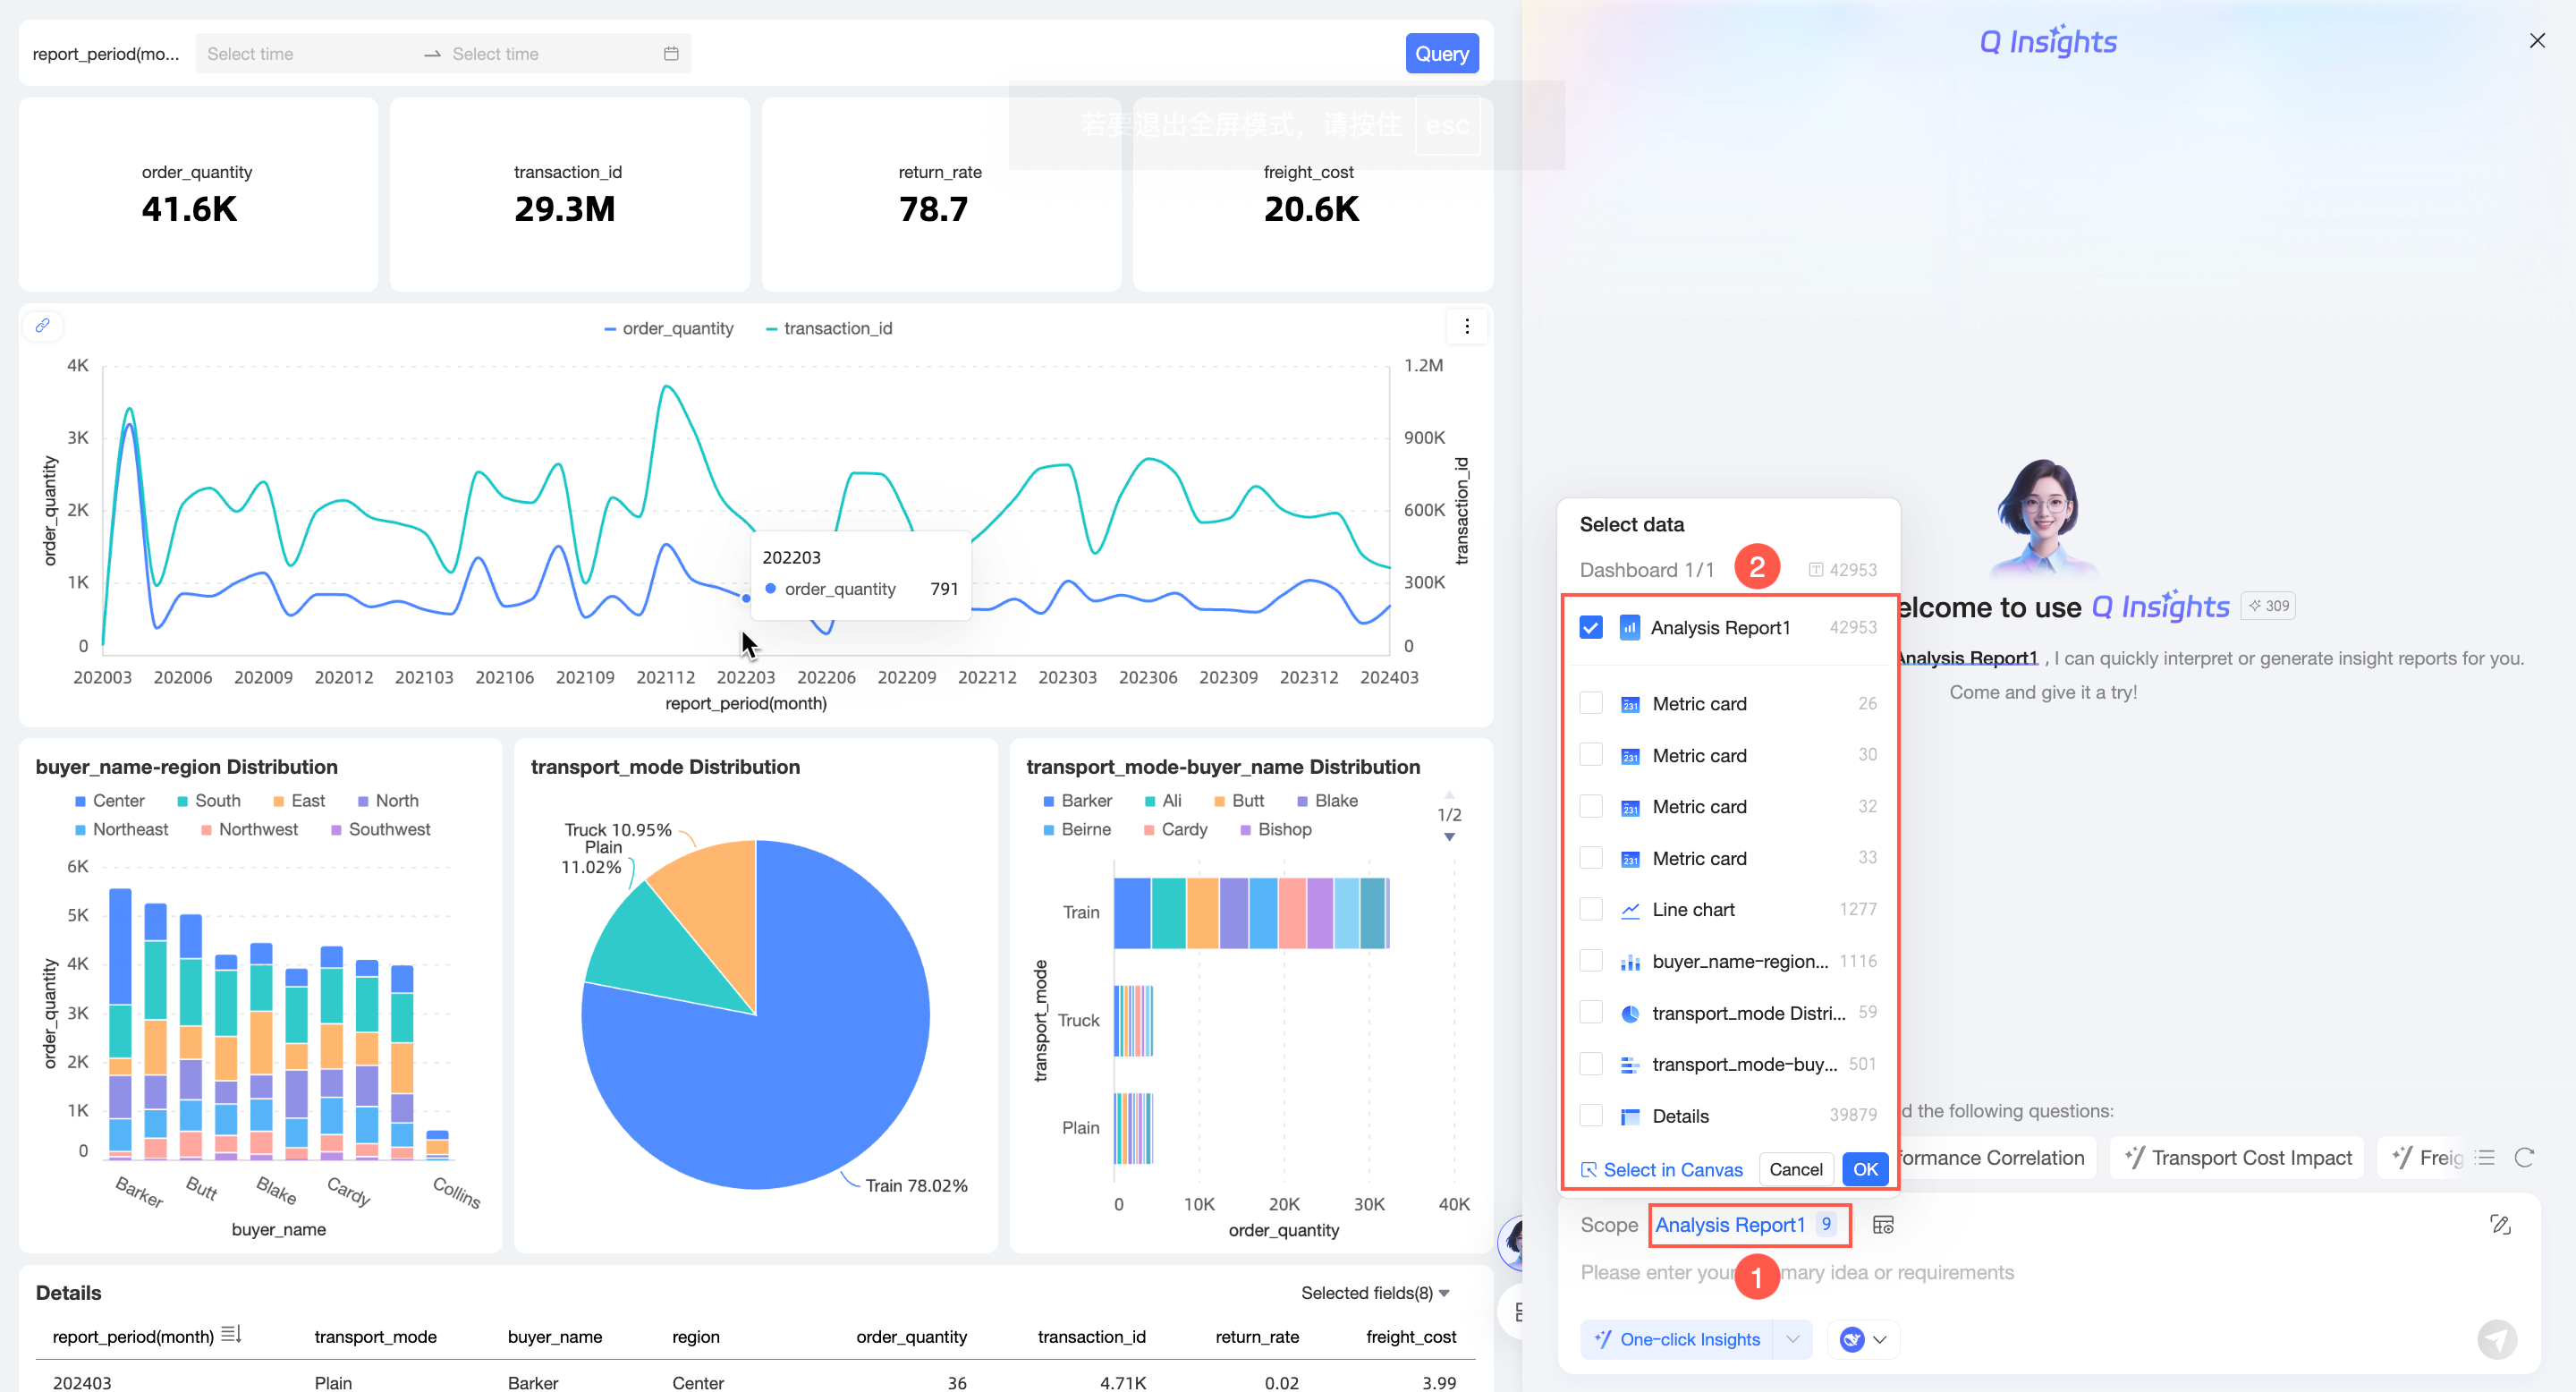
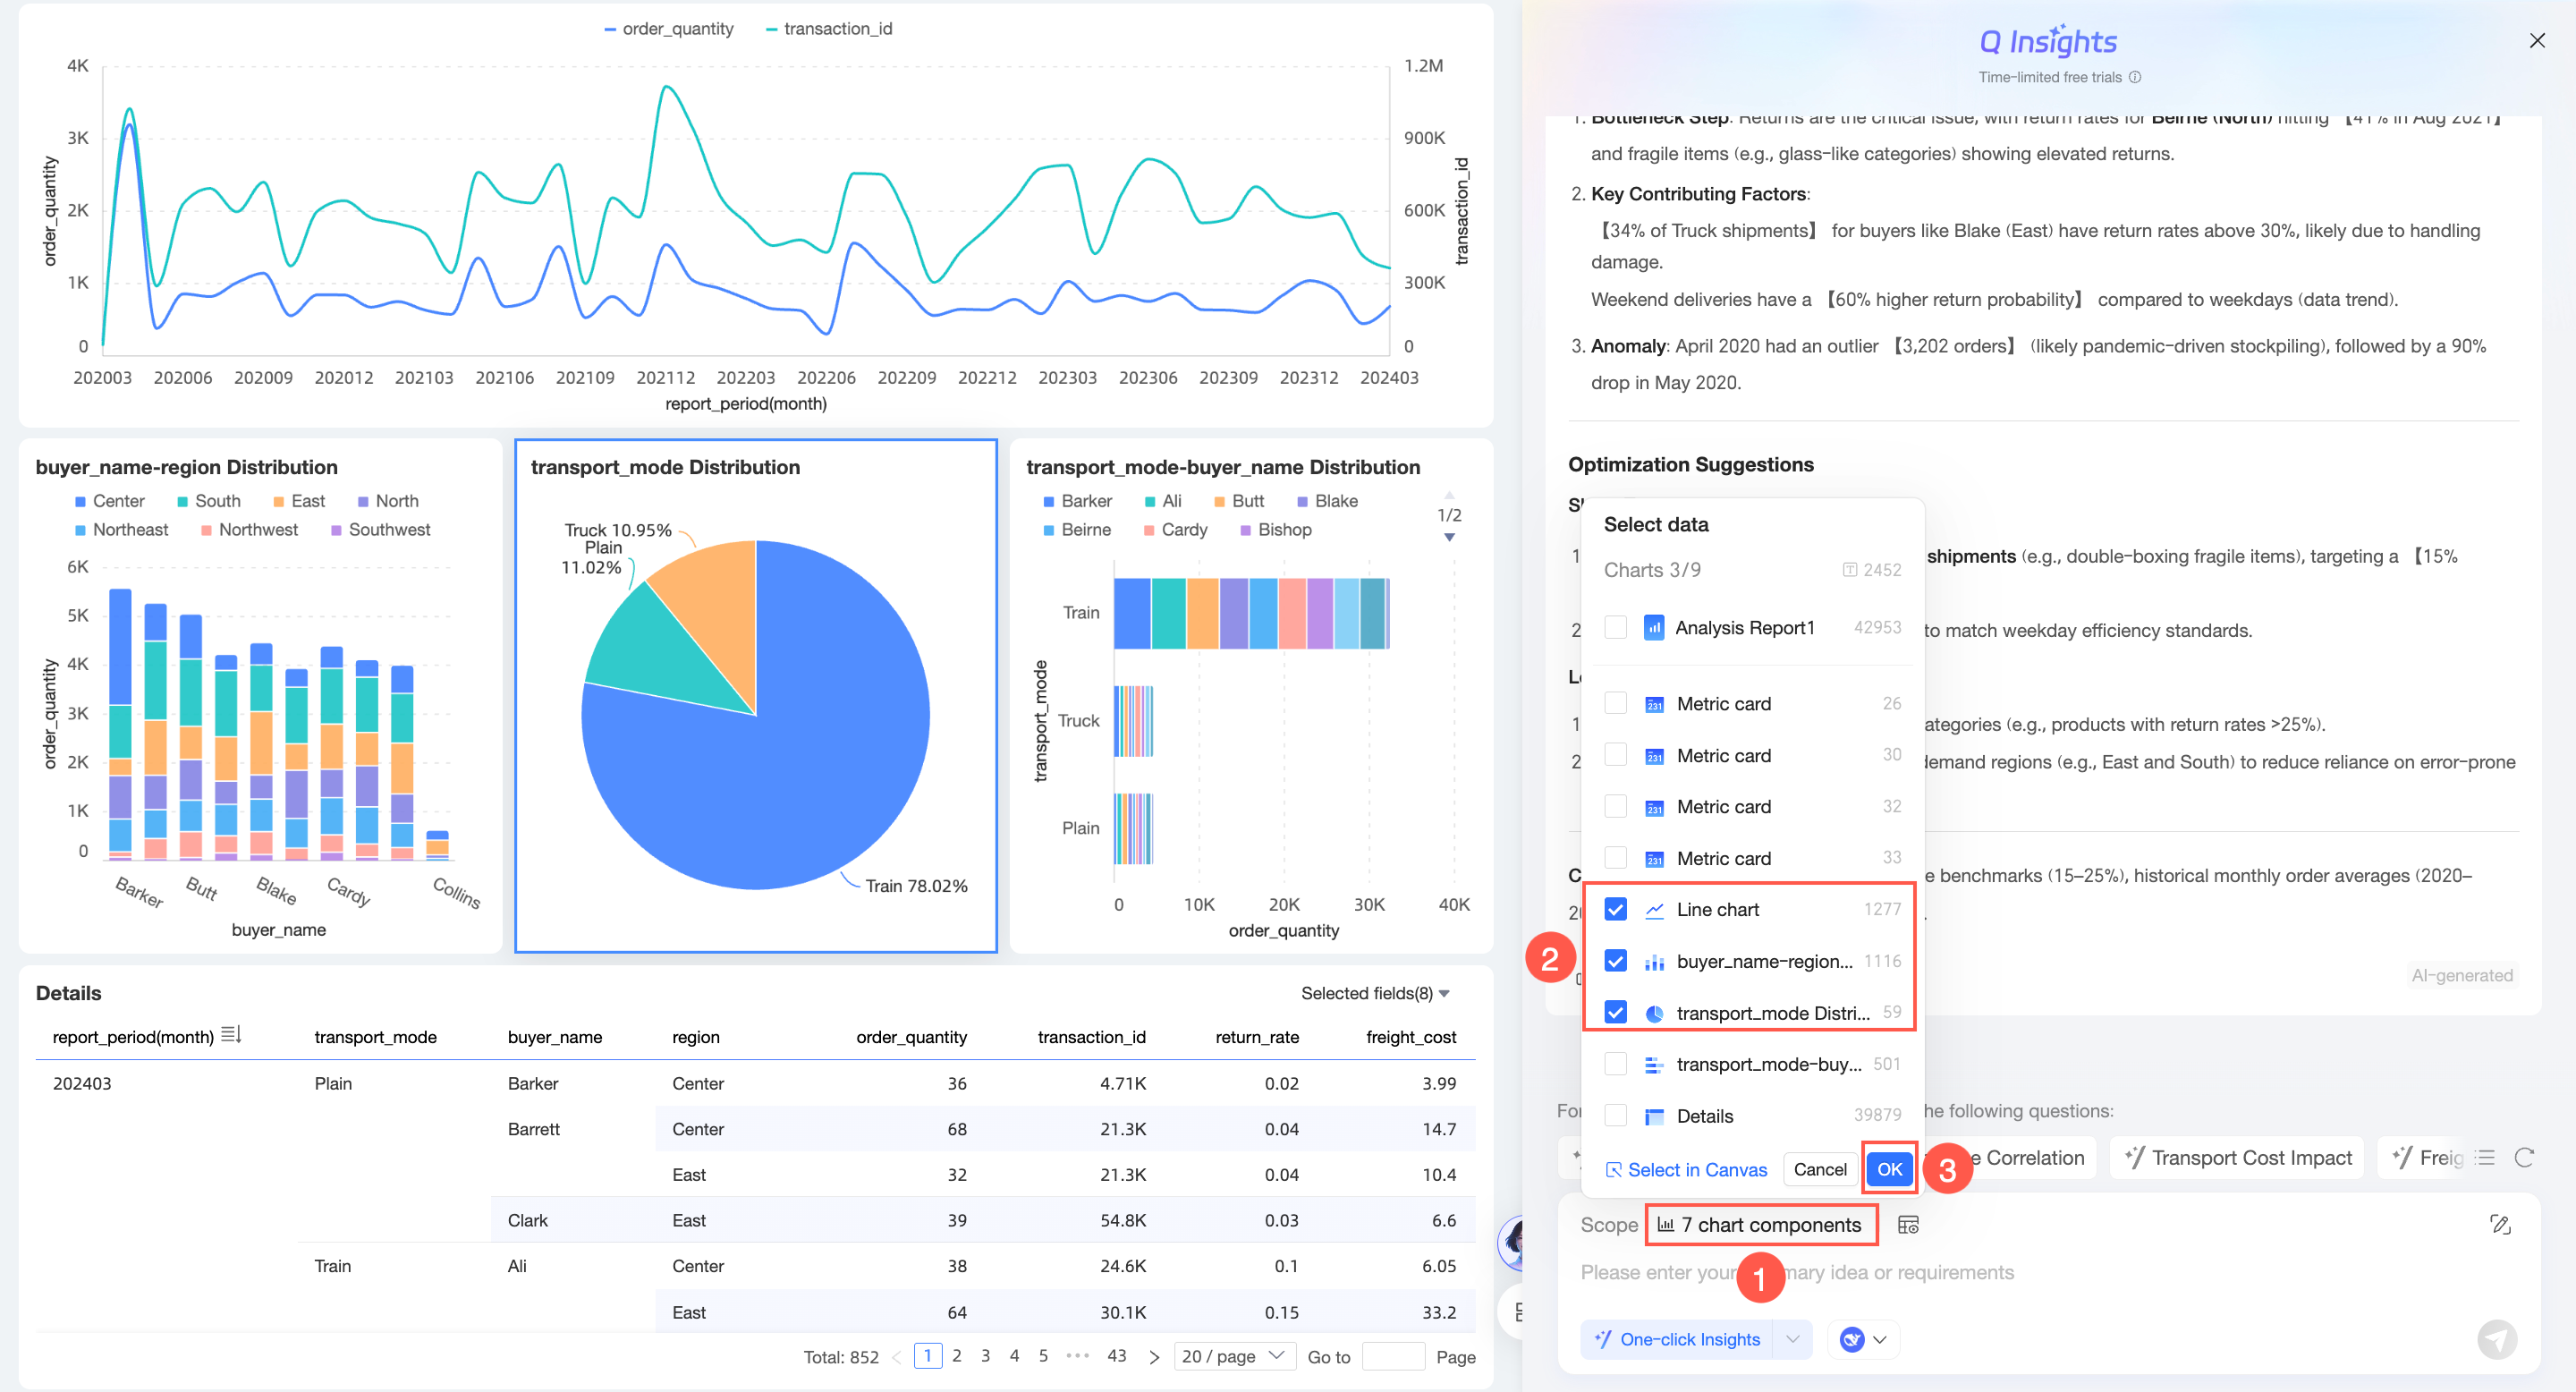
Select an interpretation scope
In the Q Insights panel, the entire dashboard is selected for interpretation by default. You can change the scope as needed.
-
You can select the checkboxes next to multiple charts and click OK to confirm your selection.
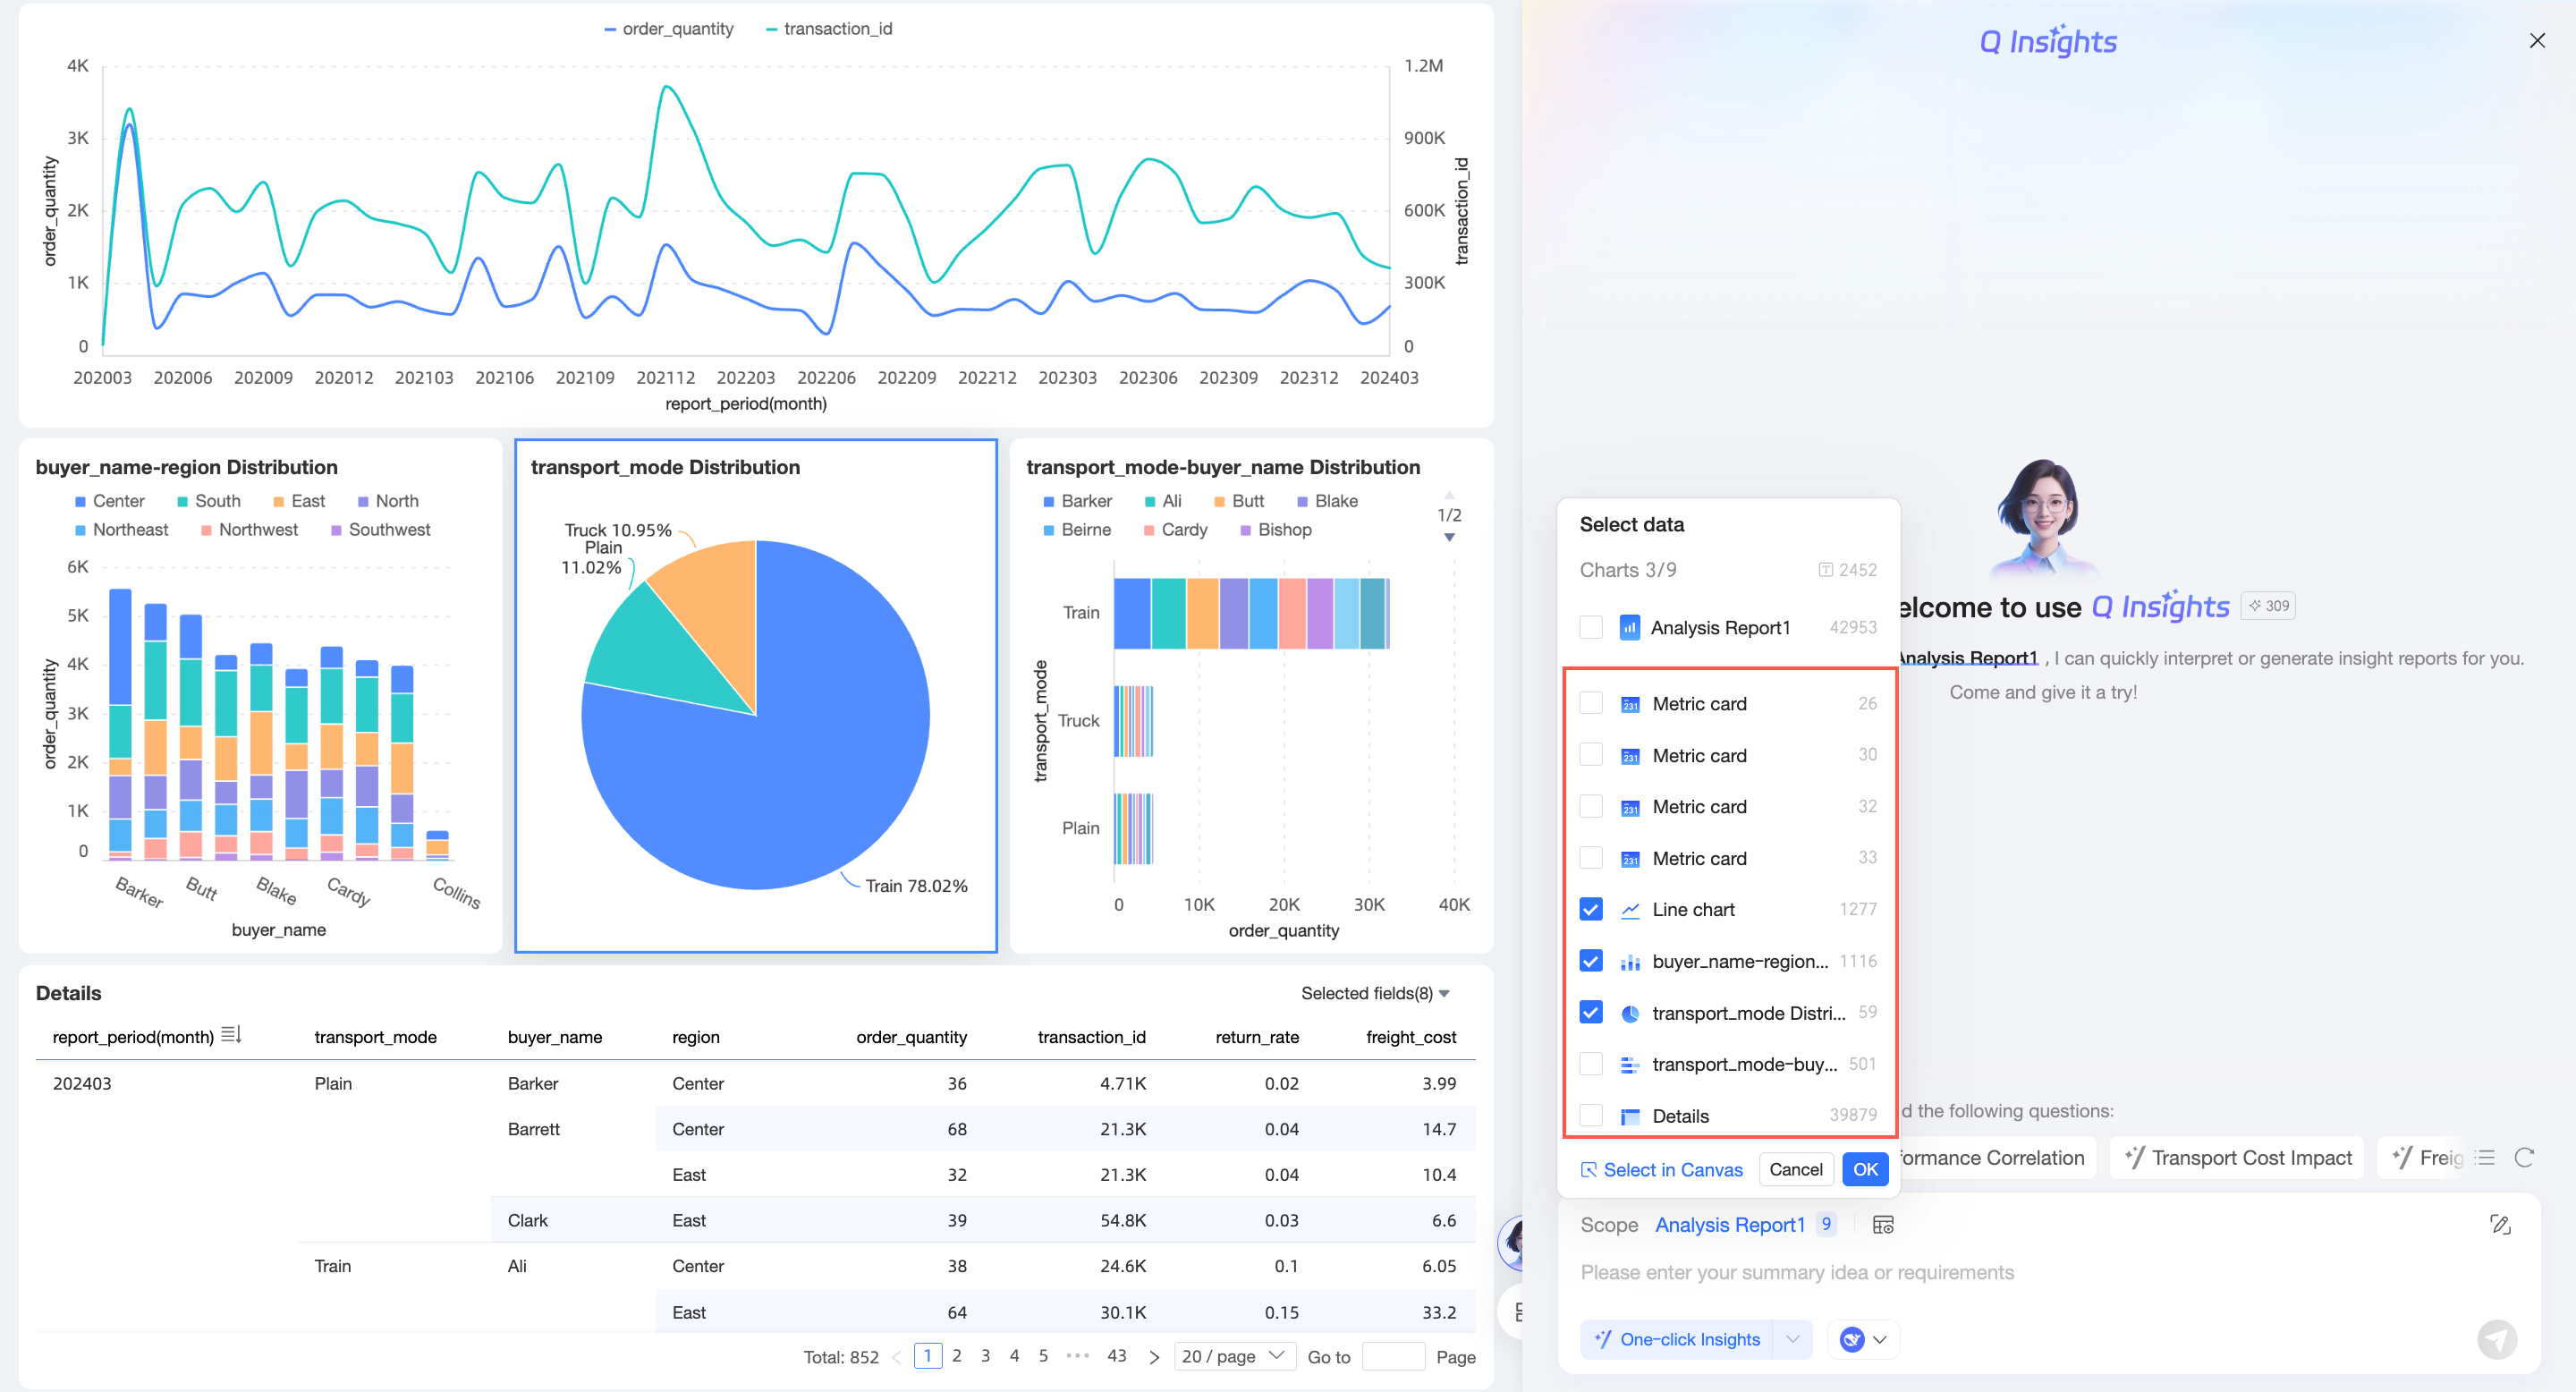
-
You can also click Select on Canvas to choose multiple charts and then click Done.
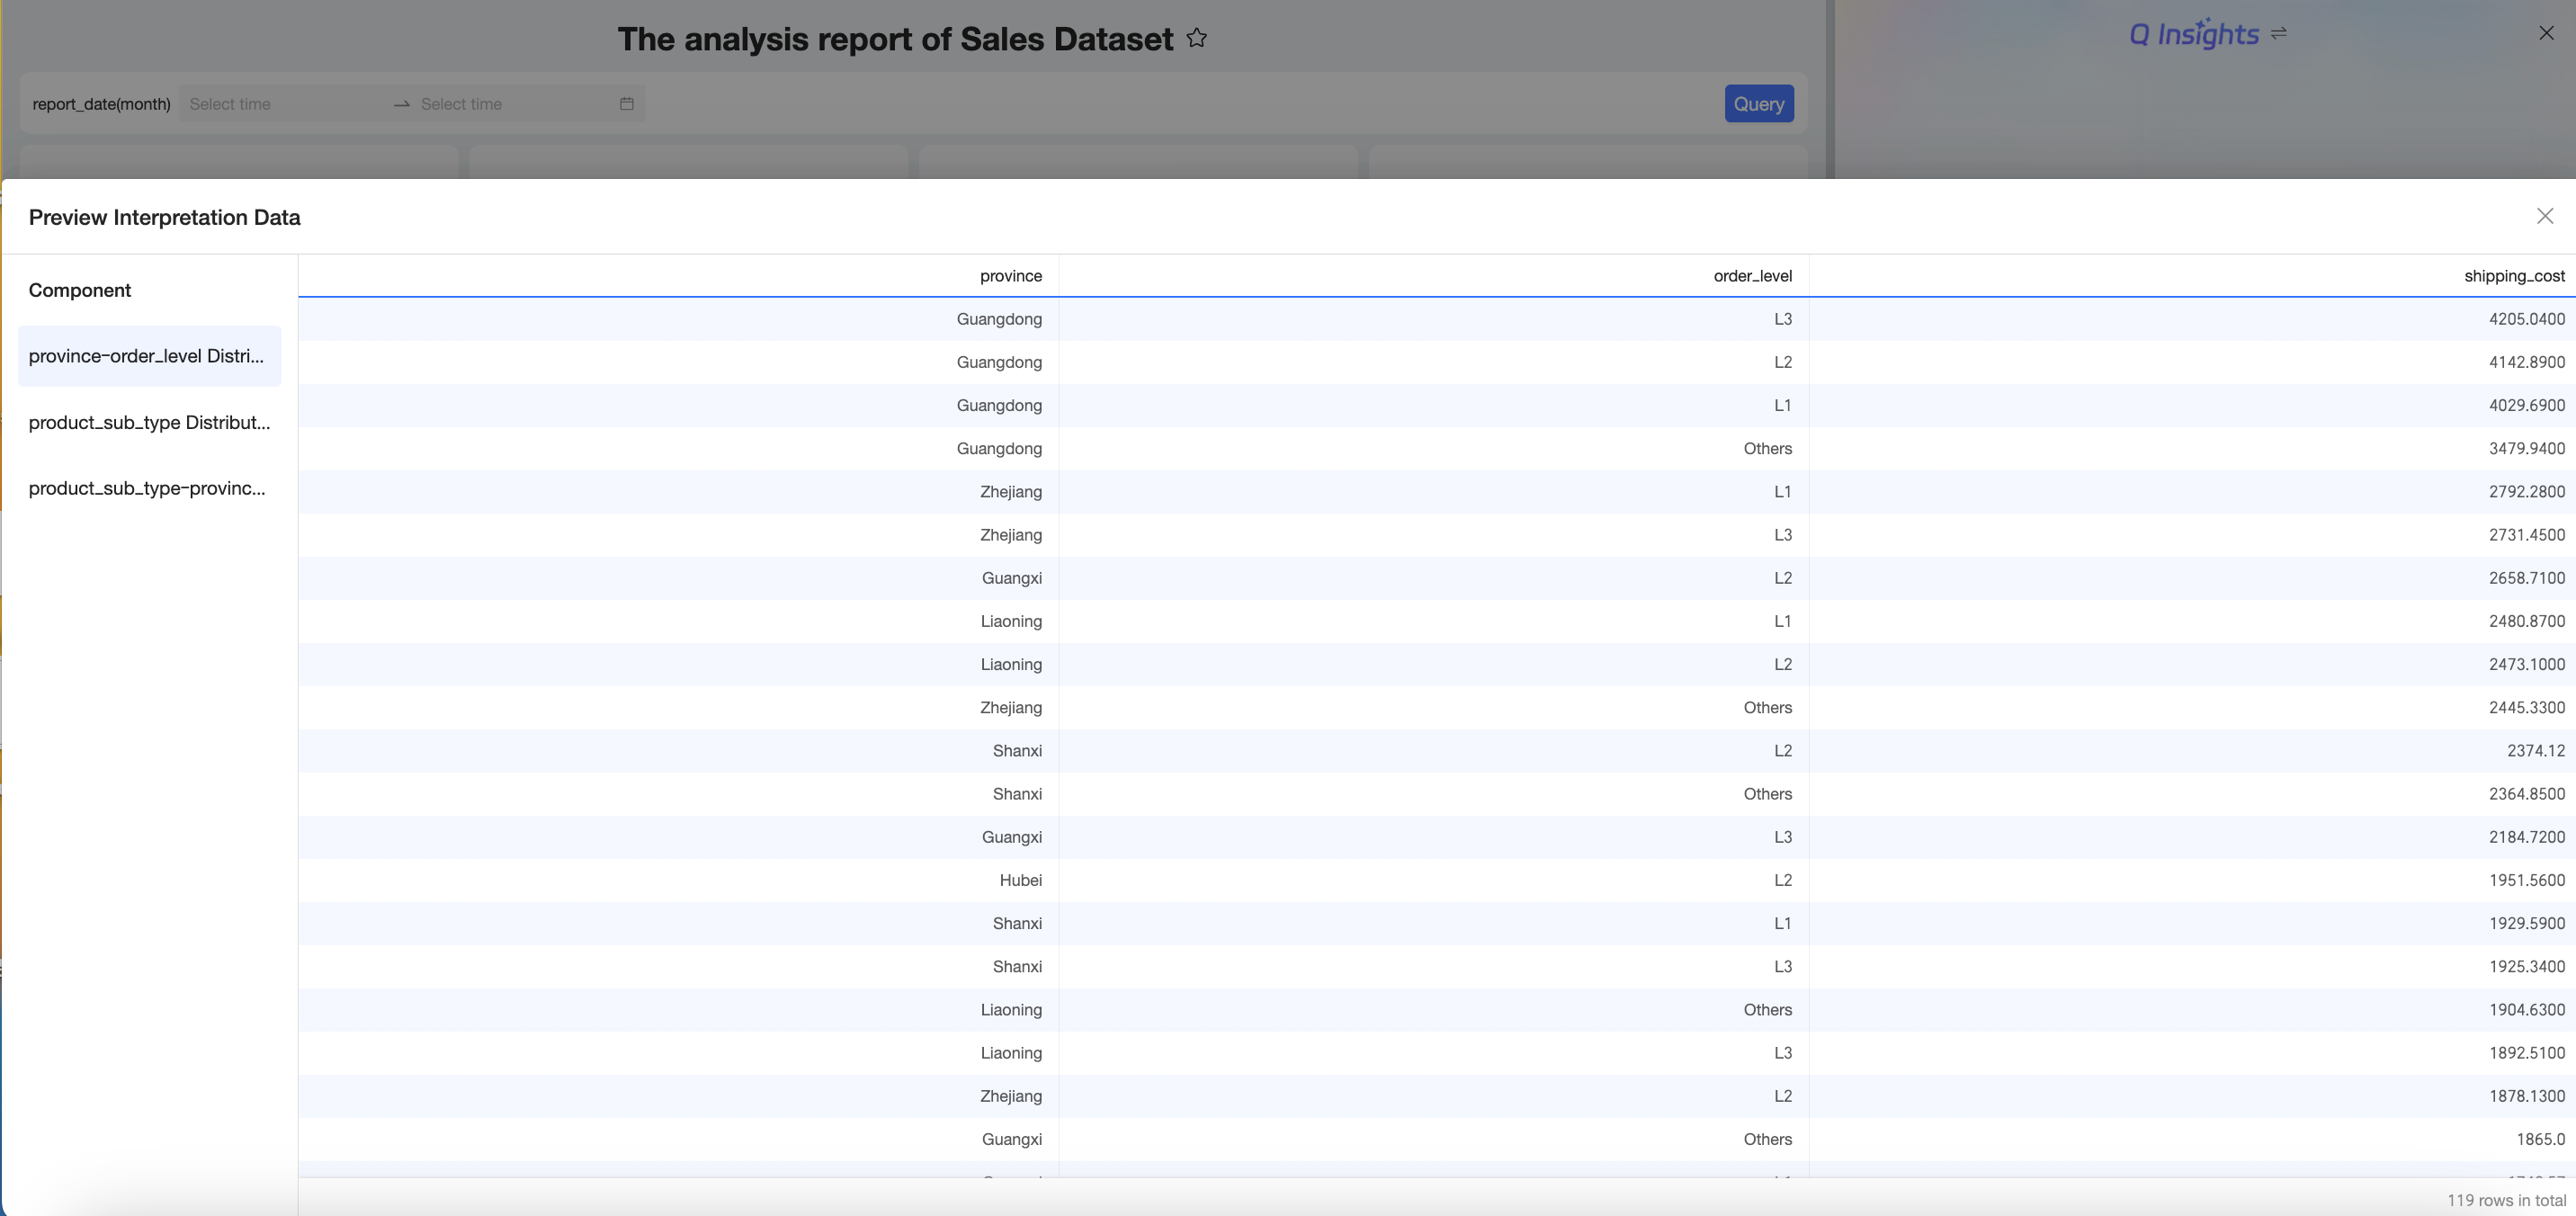
Preview interpretation data
After you select the interpretation scope, you can click Preview Interpretation Data.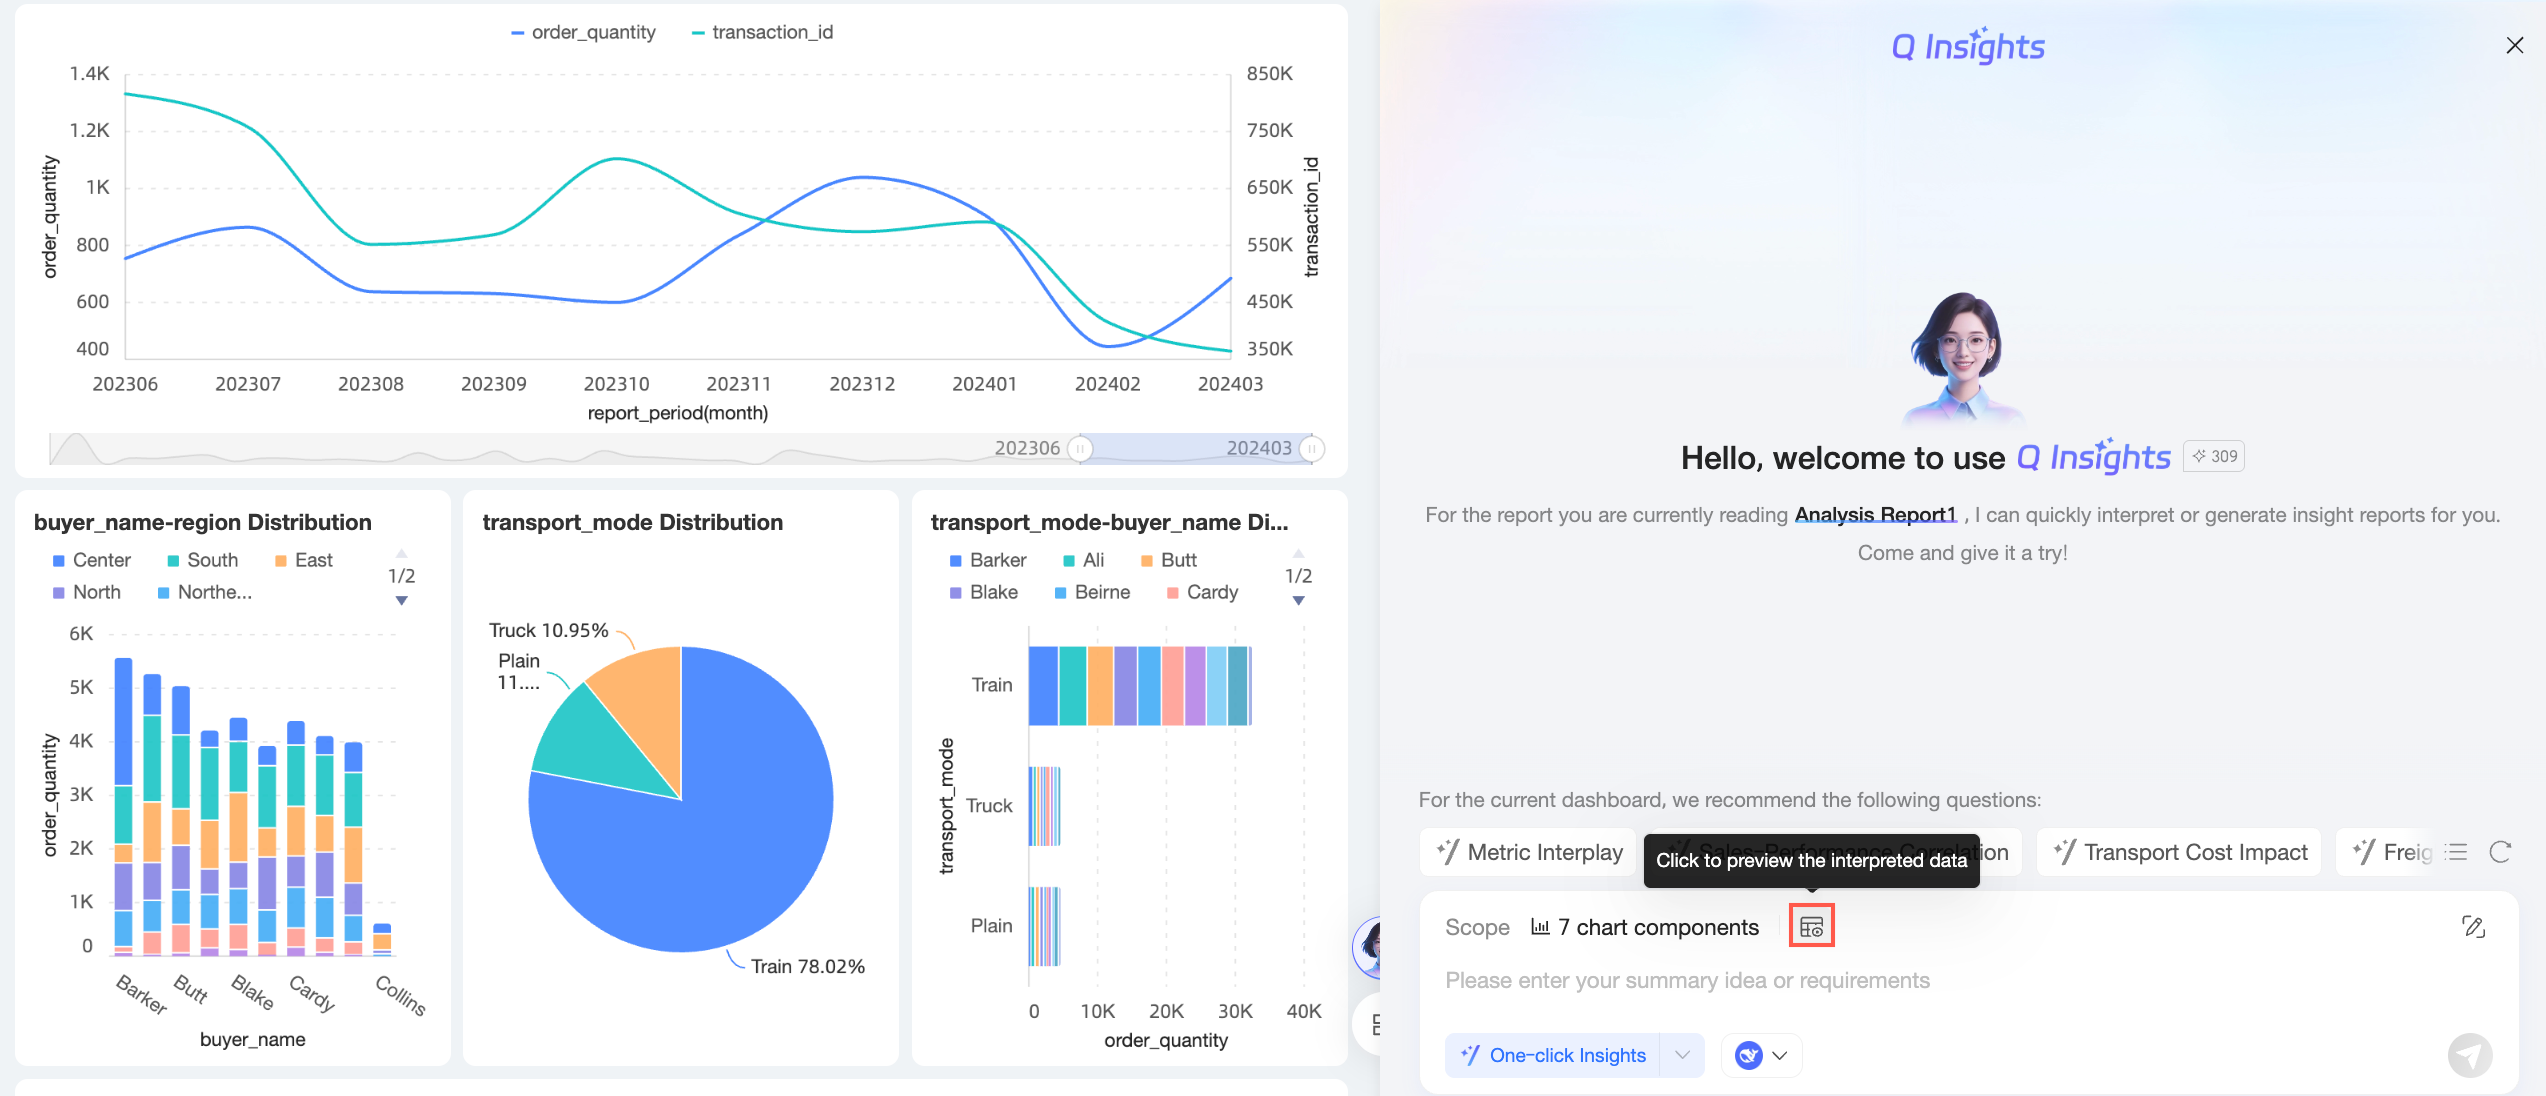
The following figure shows a data preview.
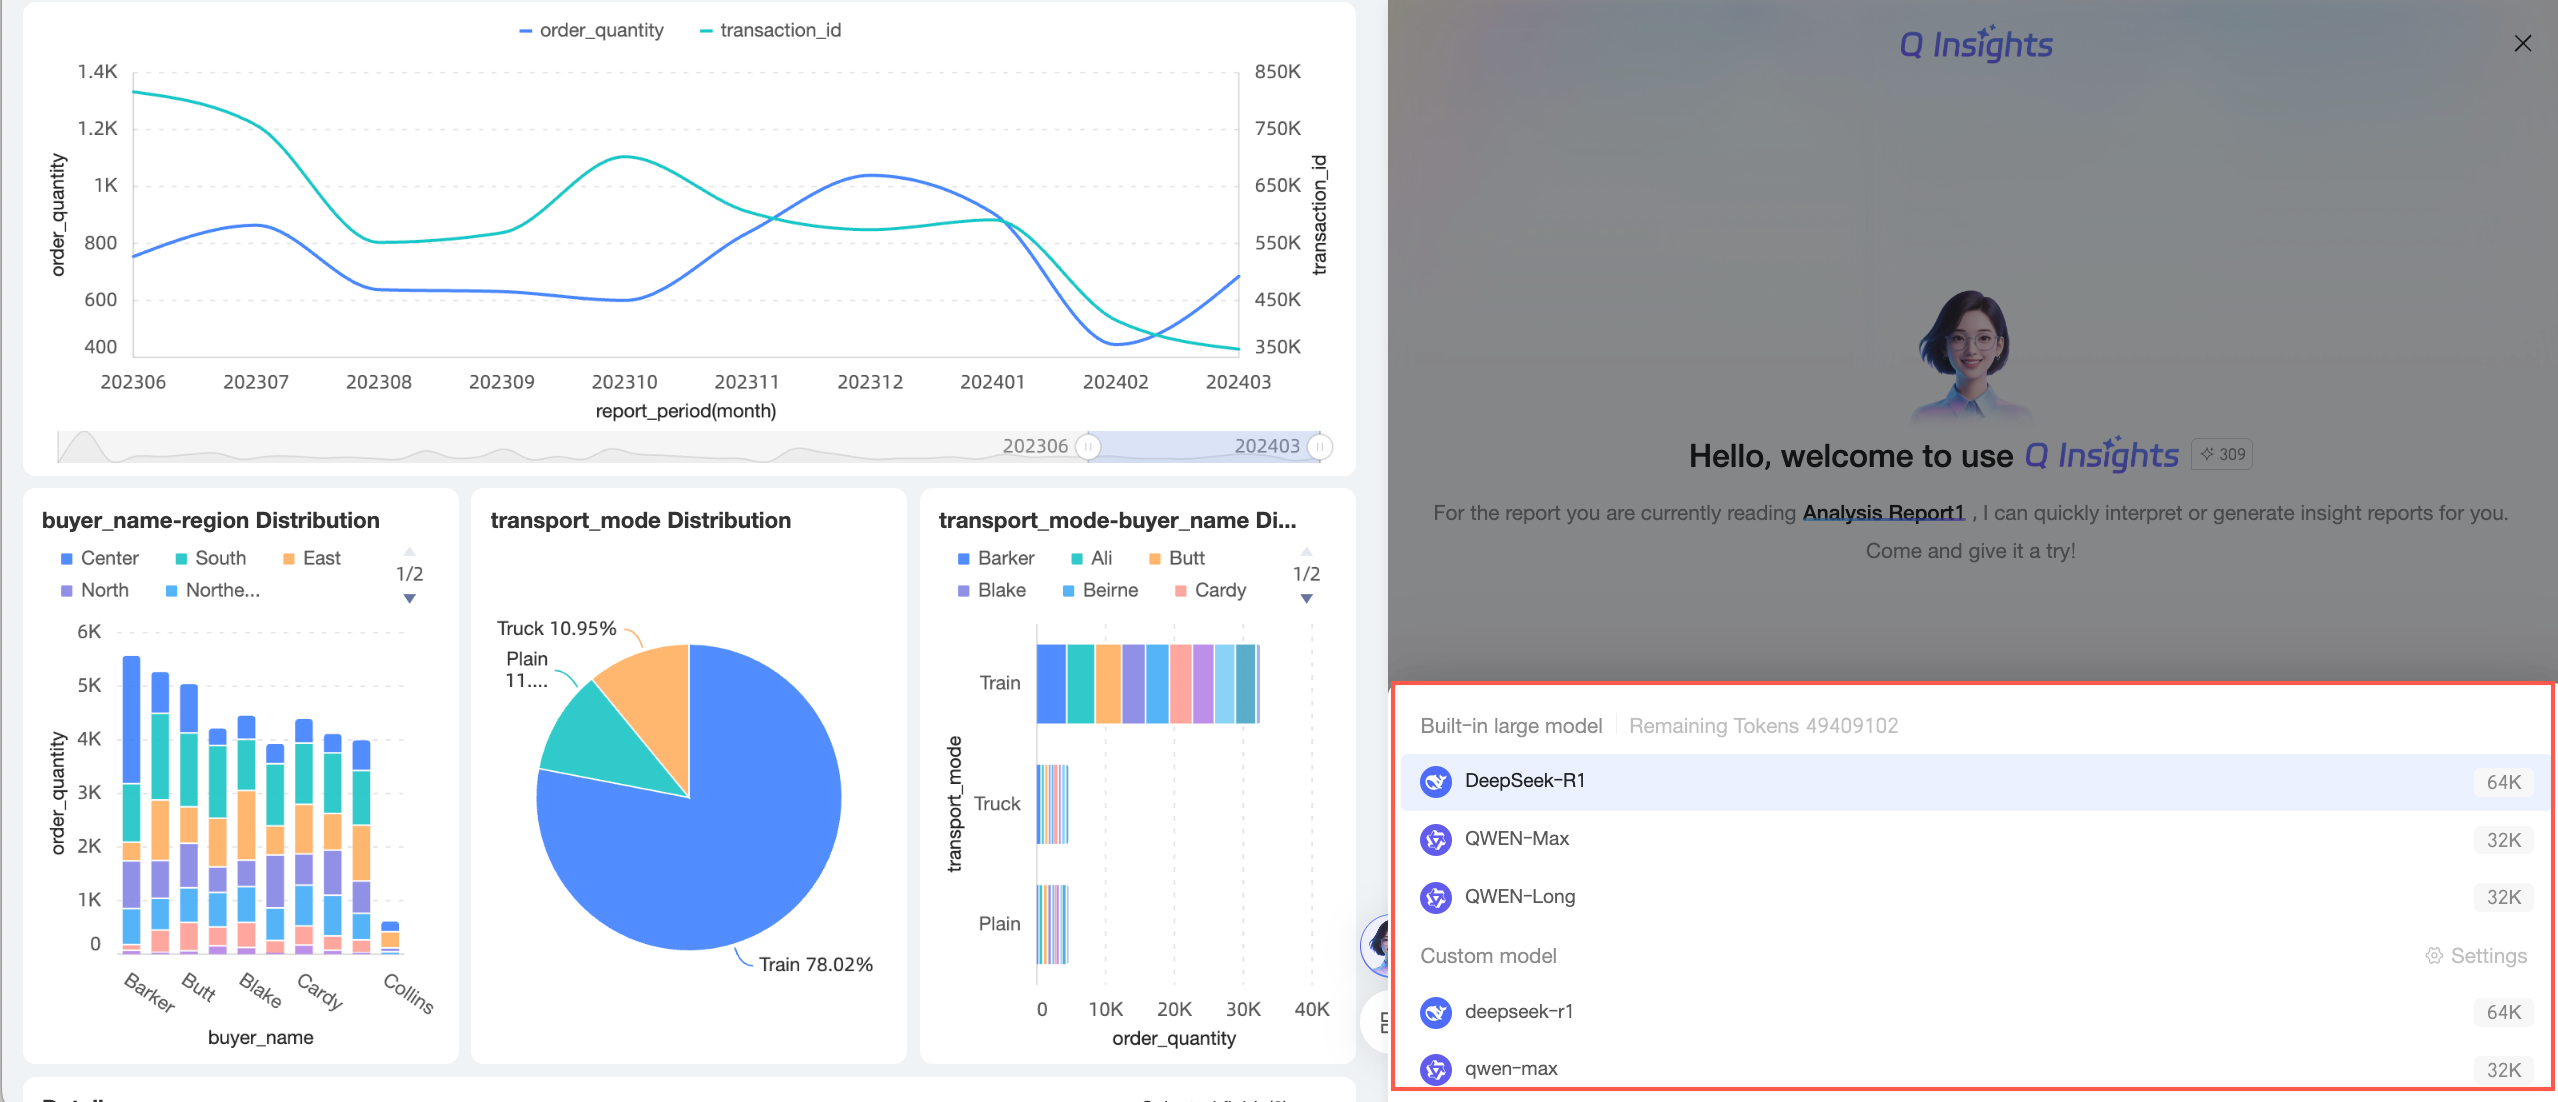
Select a model
You can choose between a built-in large language model and a custom large language model.
Enable enterprise knowledge base search
After you enable enterprise knowledge base search, you can select the knowledge bases you want to use.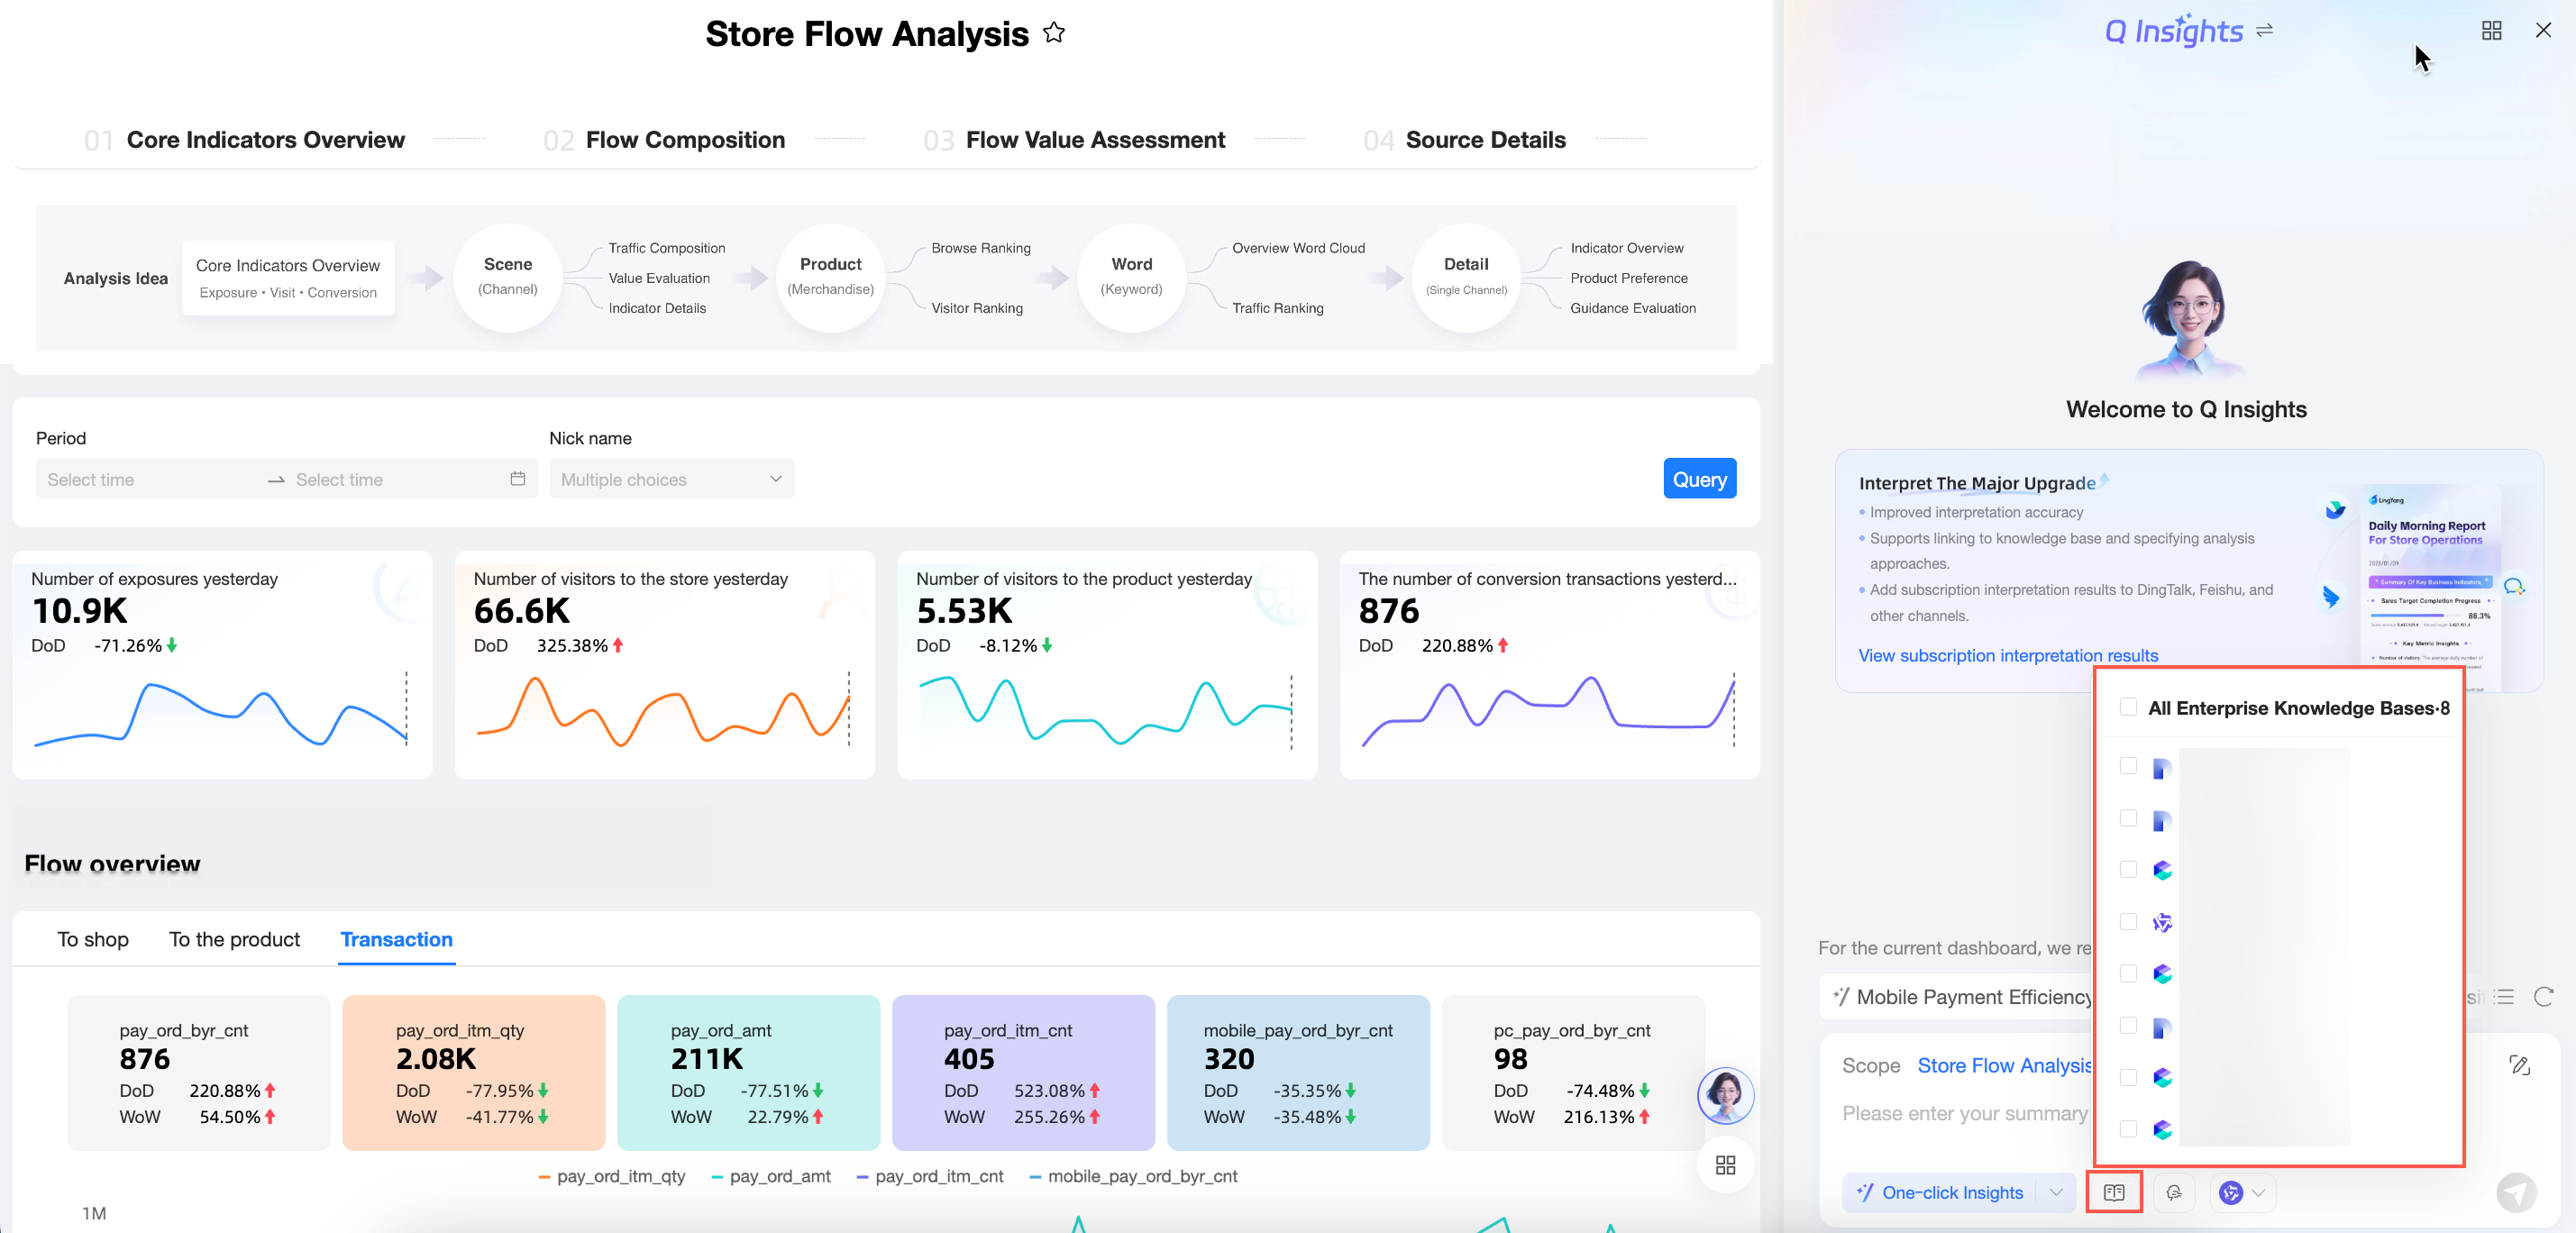
When enabled, the large language model uses information from the selected knowledge bases to generate reports better aligned with your company's business context and logic.
Before you can select a knowledge base, an organization administrator must configure and enable it in Organization Management. For more information about how to configure a knowledge base, see Knowledge base management.
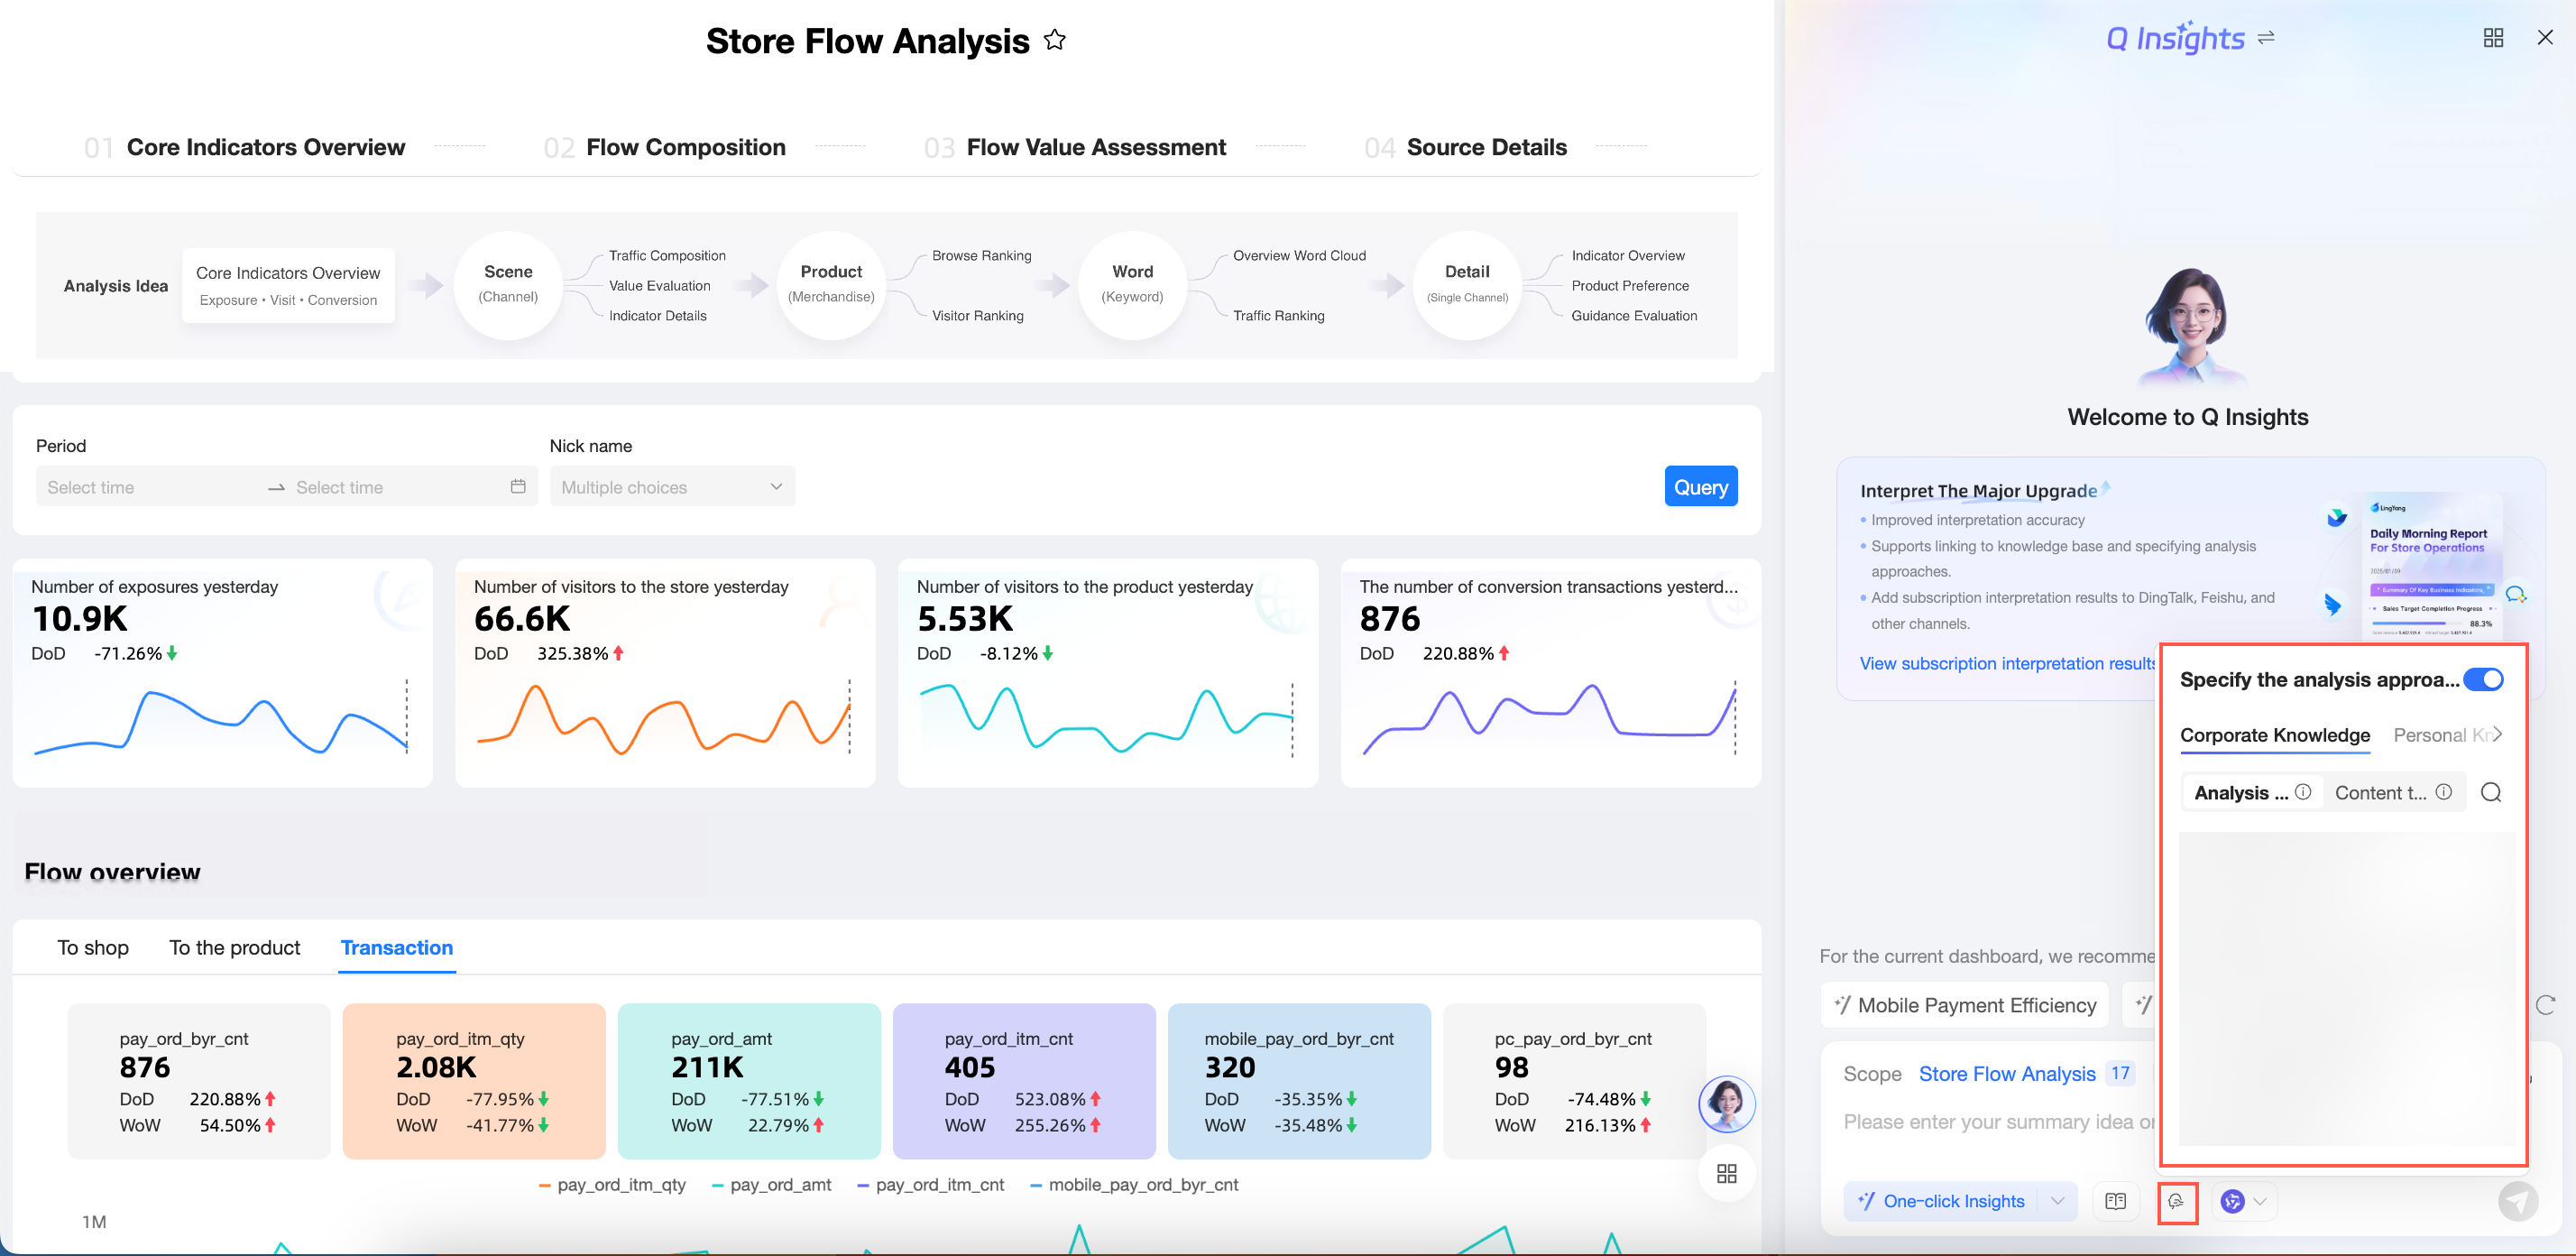
Specify an analysis approach
After you enable this option, you can select an analysis approach from your enterprise knowledge or personal knowledge.
-
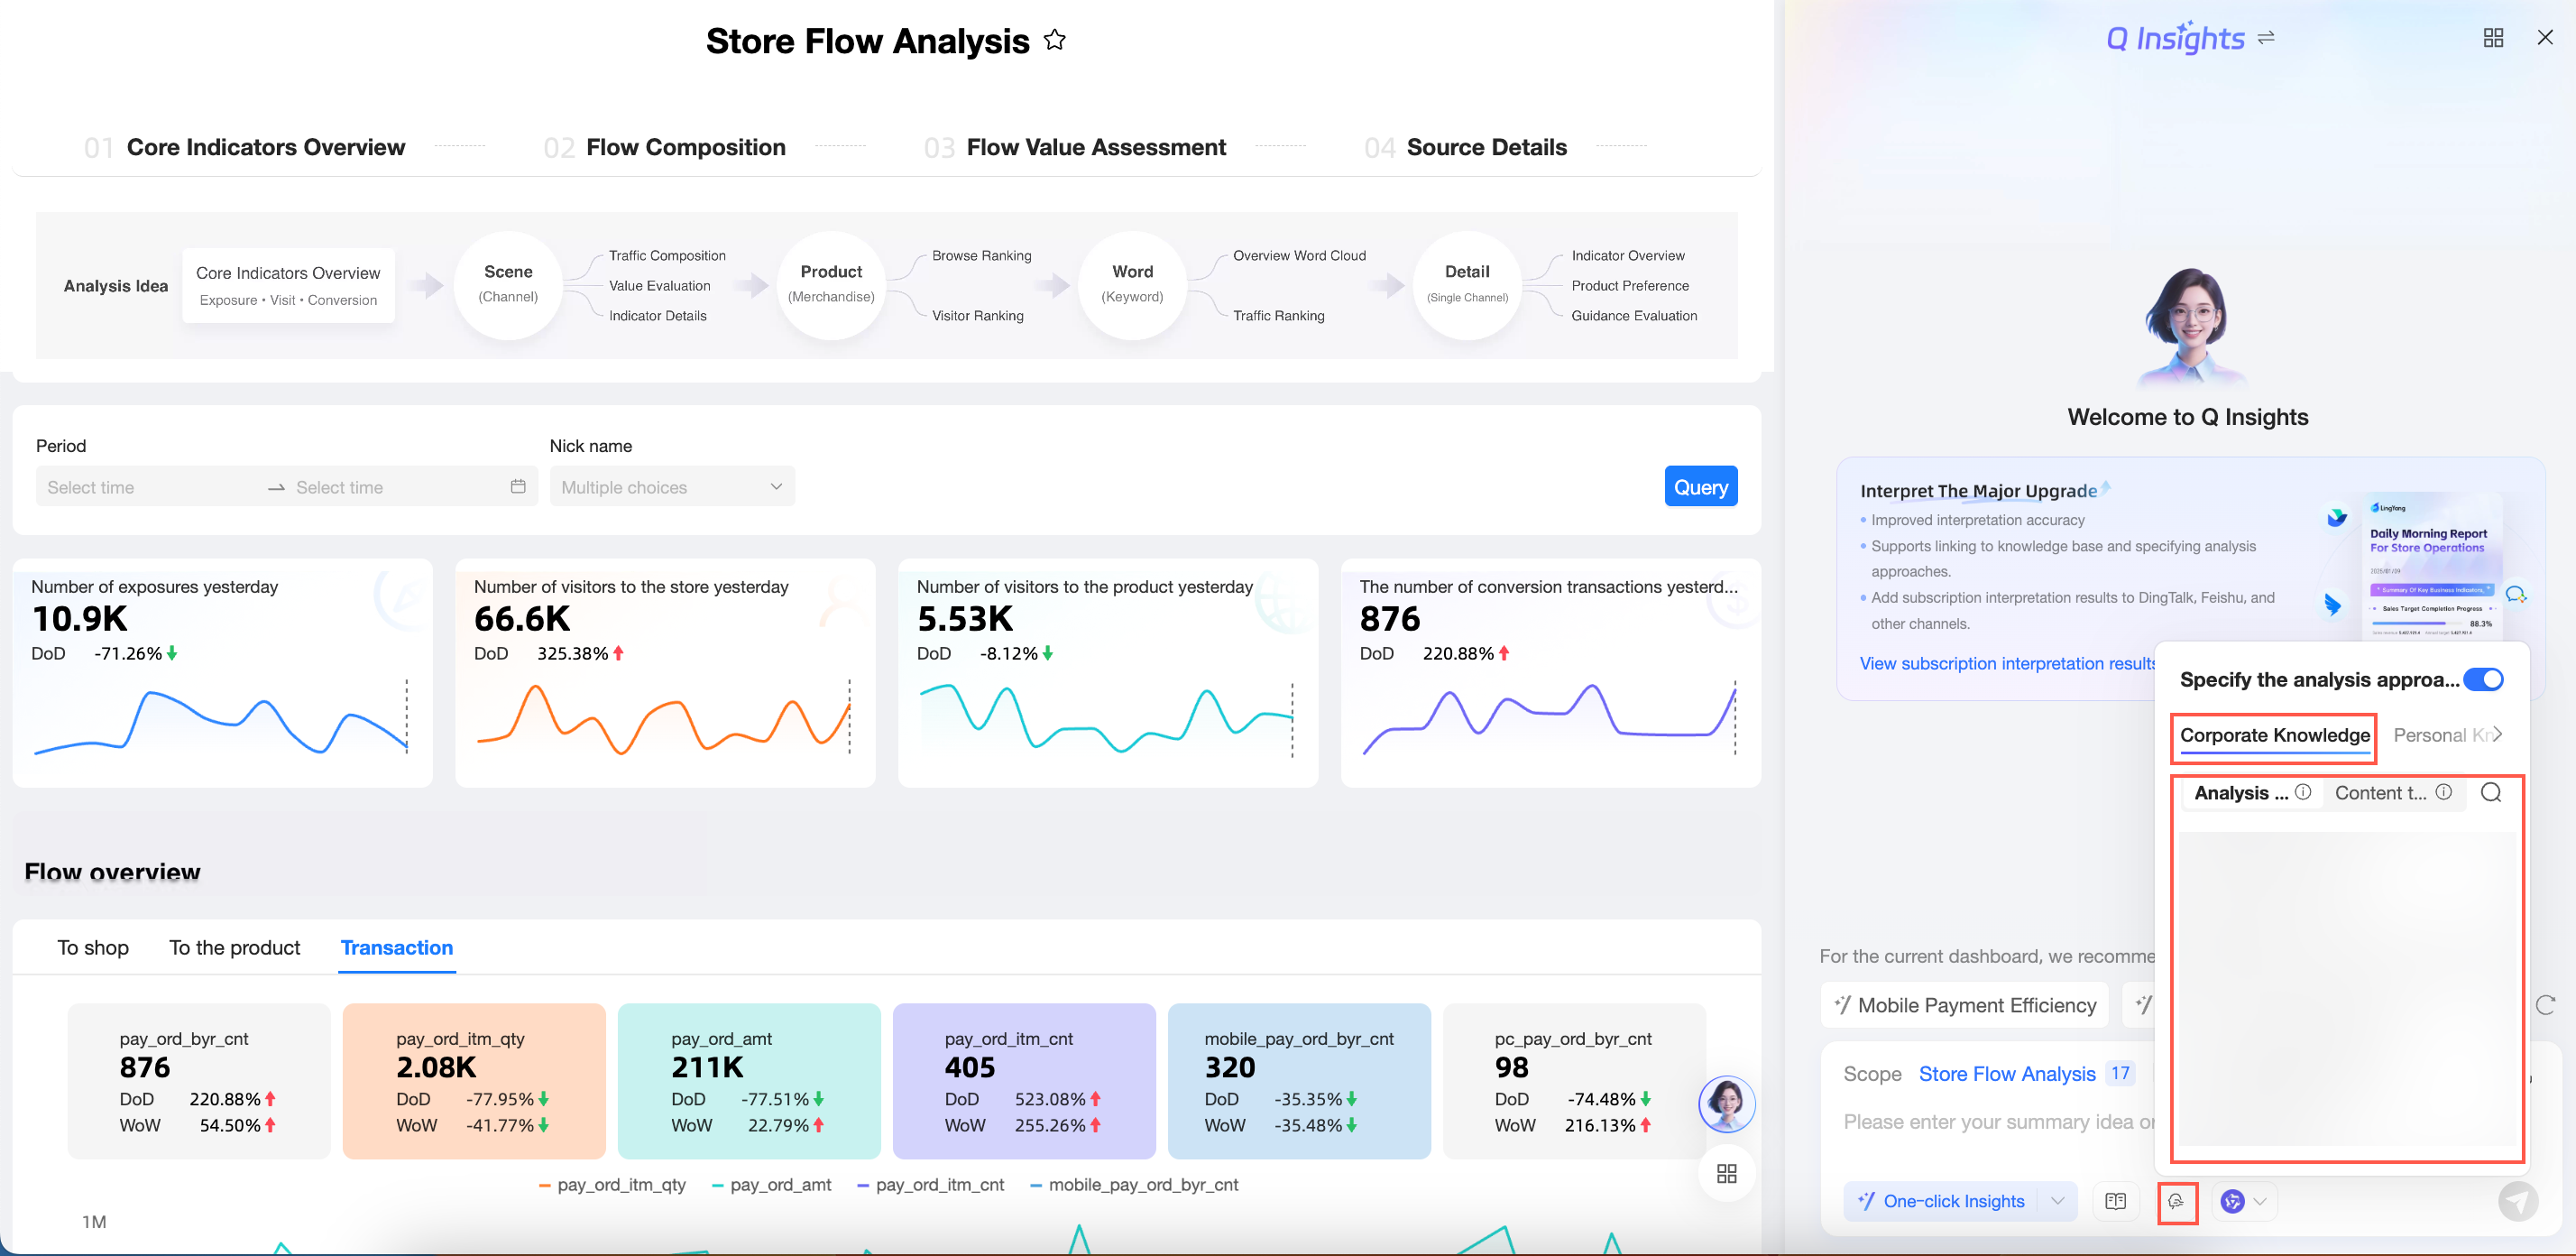
The Enterprise Knowledge tab displays organization-wide knowledge content that is configured and maintained centrally. This standardizes the analytical scope and content structure, ensuring that reports from different team members conform to organizational standards.
Here, you can select the required analysis approach or content template.
-
Analysis approach: Defines the analytical methodology. Configuring an analysis approach guides the system to generate report content aligned with your company's analytical methods, avoiding generic or irrelevant results.
The large language model generates the report's content structure. If you have specific layout requirements, switch to the Content Template tab and select a template. You can also define the content structure by using prompts or uploading attachments.
-
Content template: Presets your company's standard report frameworks and ensures the analytical logic better meets your expectations.
Click the
 icon next to an analysis approach or content template to preview its details in the Specify an analysis approach dialog box.
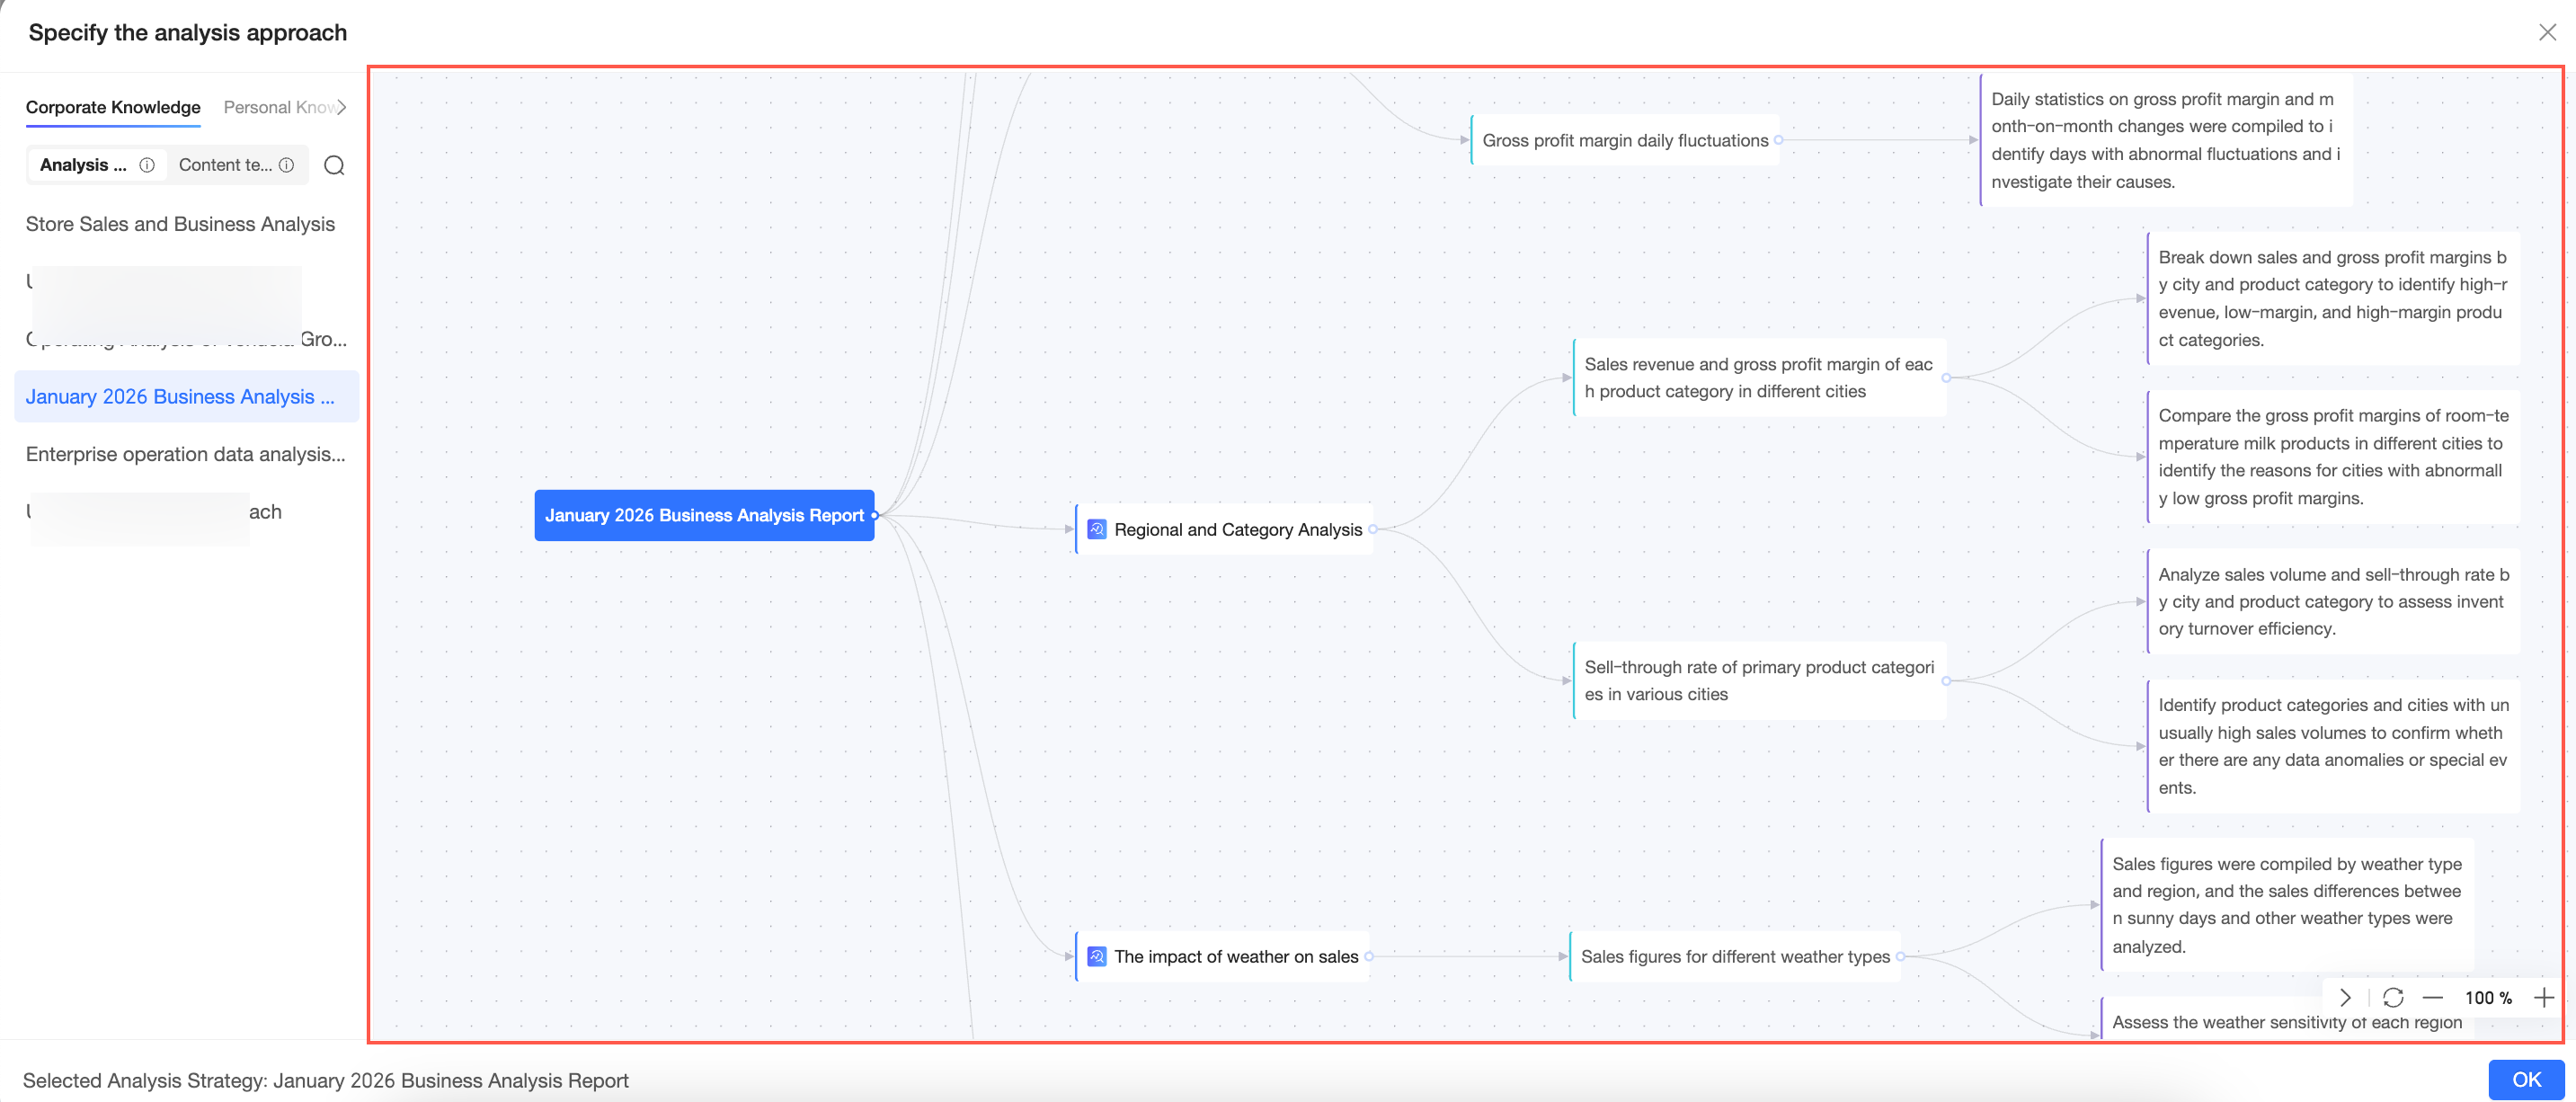 Note
Note-
If you do not specify an analysis approach, the large language model will automatically plan the analysis based on your prompt.
-
Before you can select an analysis approach or content template, an organization administrator must configure and enable it in Organization Management. For instructions on how to configure them, see Knowledge base management.
-
-
The Personal Knowledge tab displays private knowledge uploaded by the current account. You can upload local files based on your business experience. Applying this knowledge helps Q Insights generate content better aligned with your personal work needs and perspective.
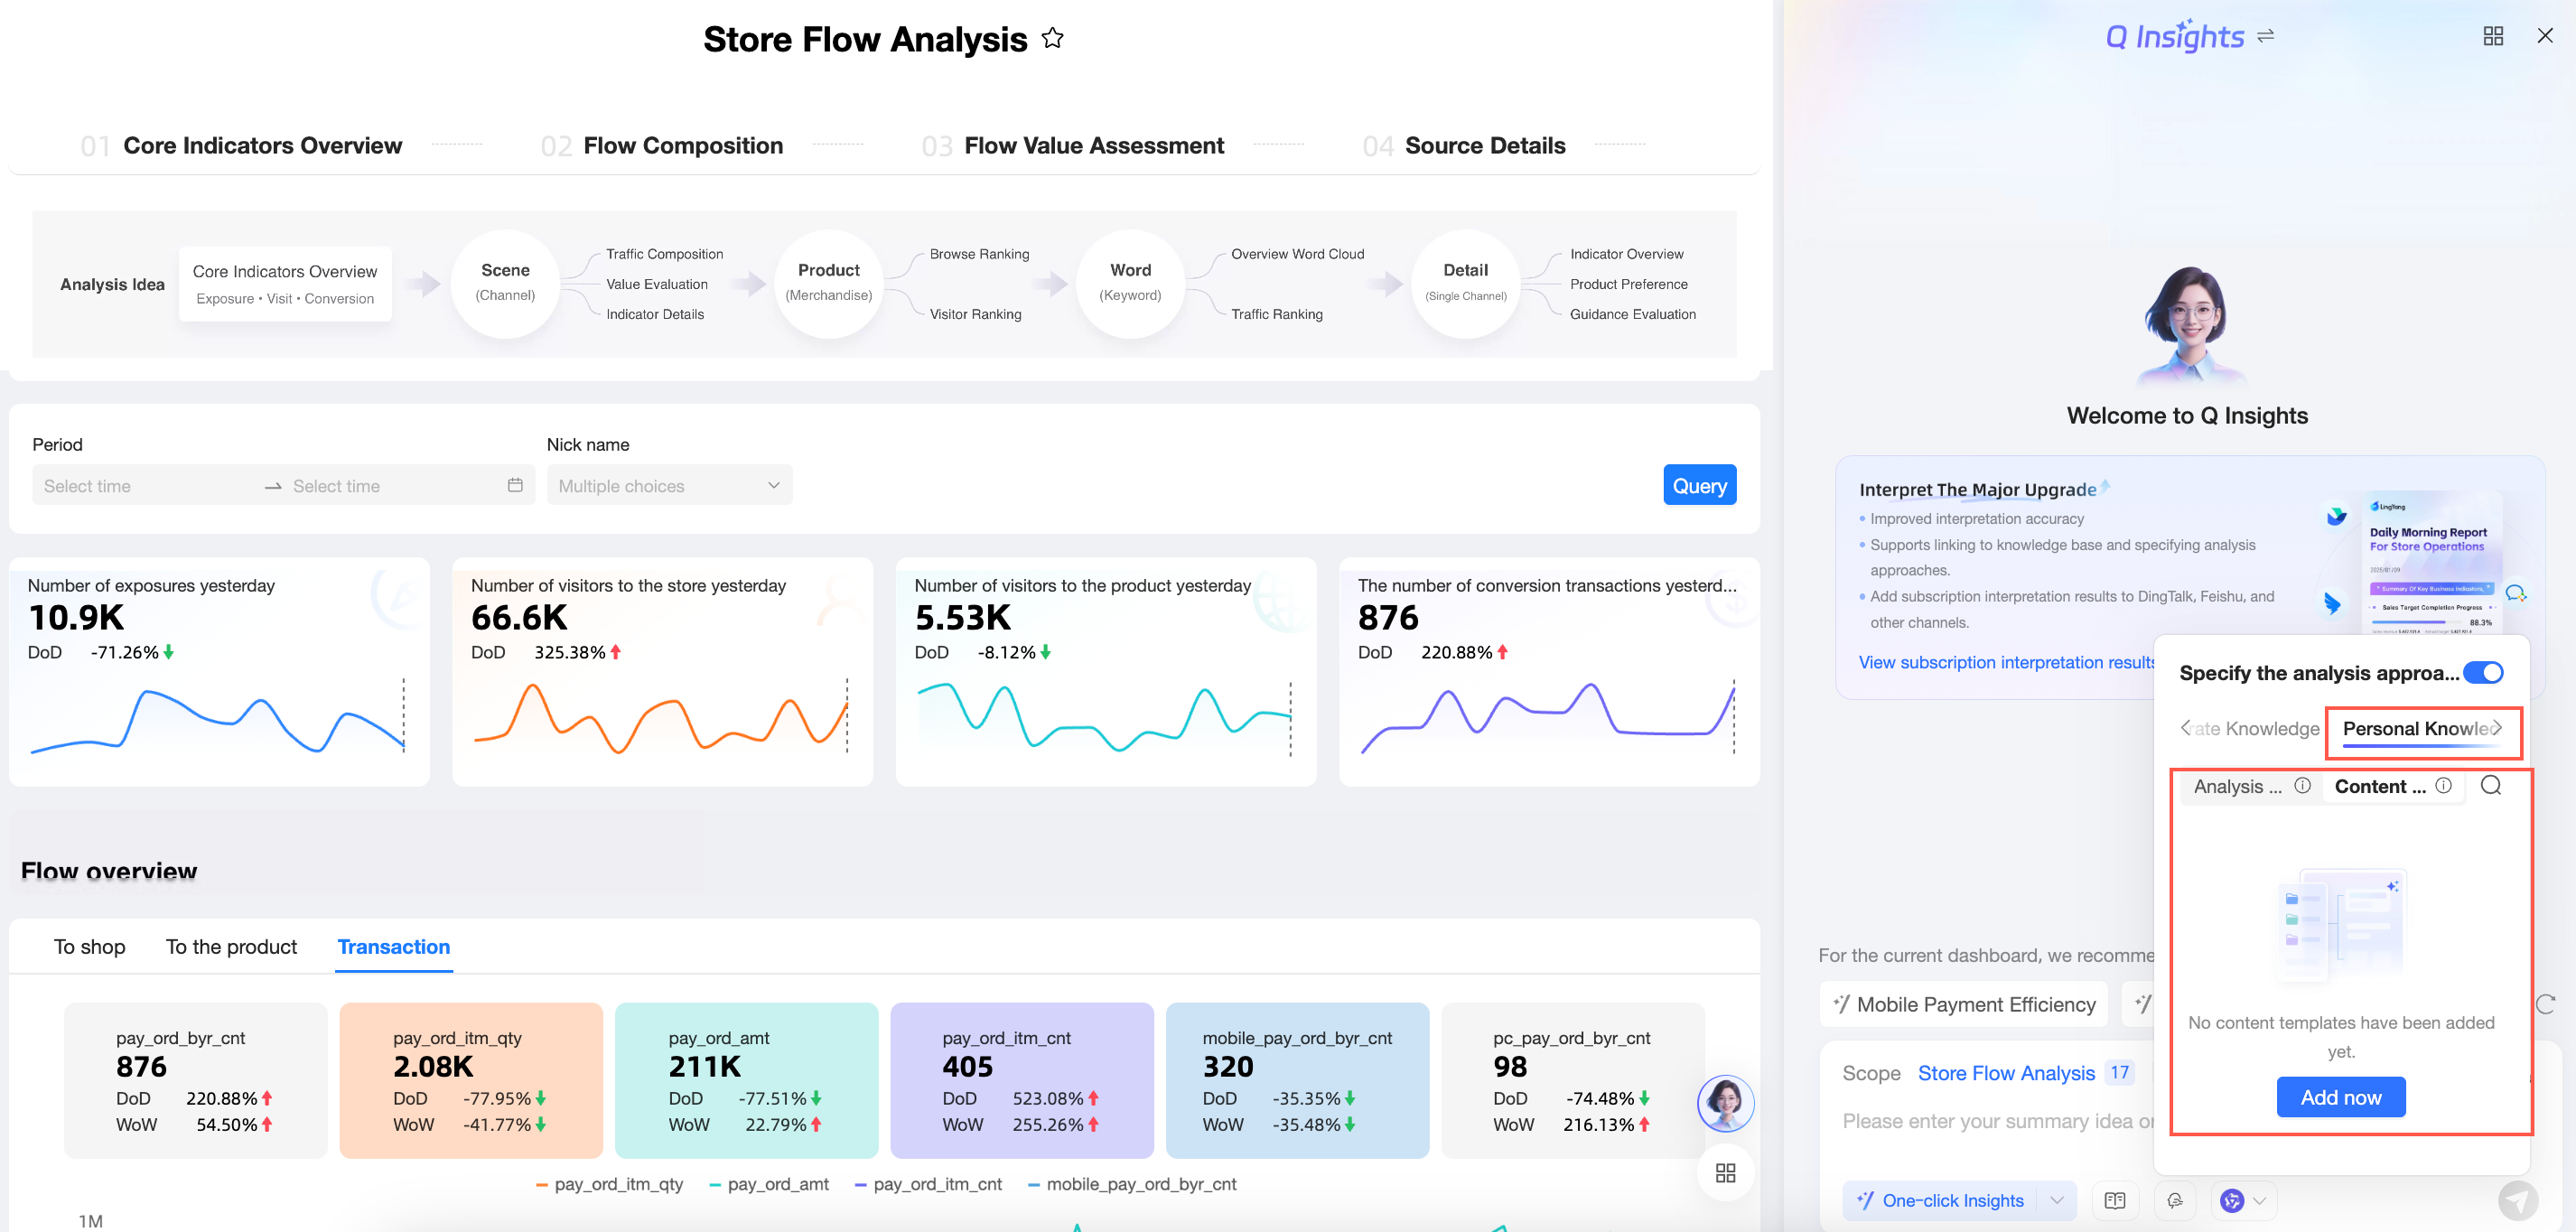
Follow these steps:
-
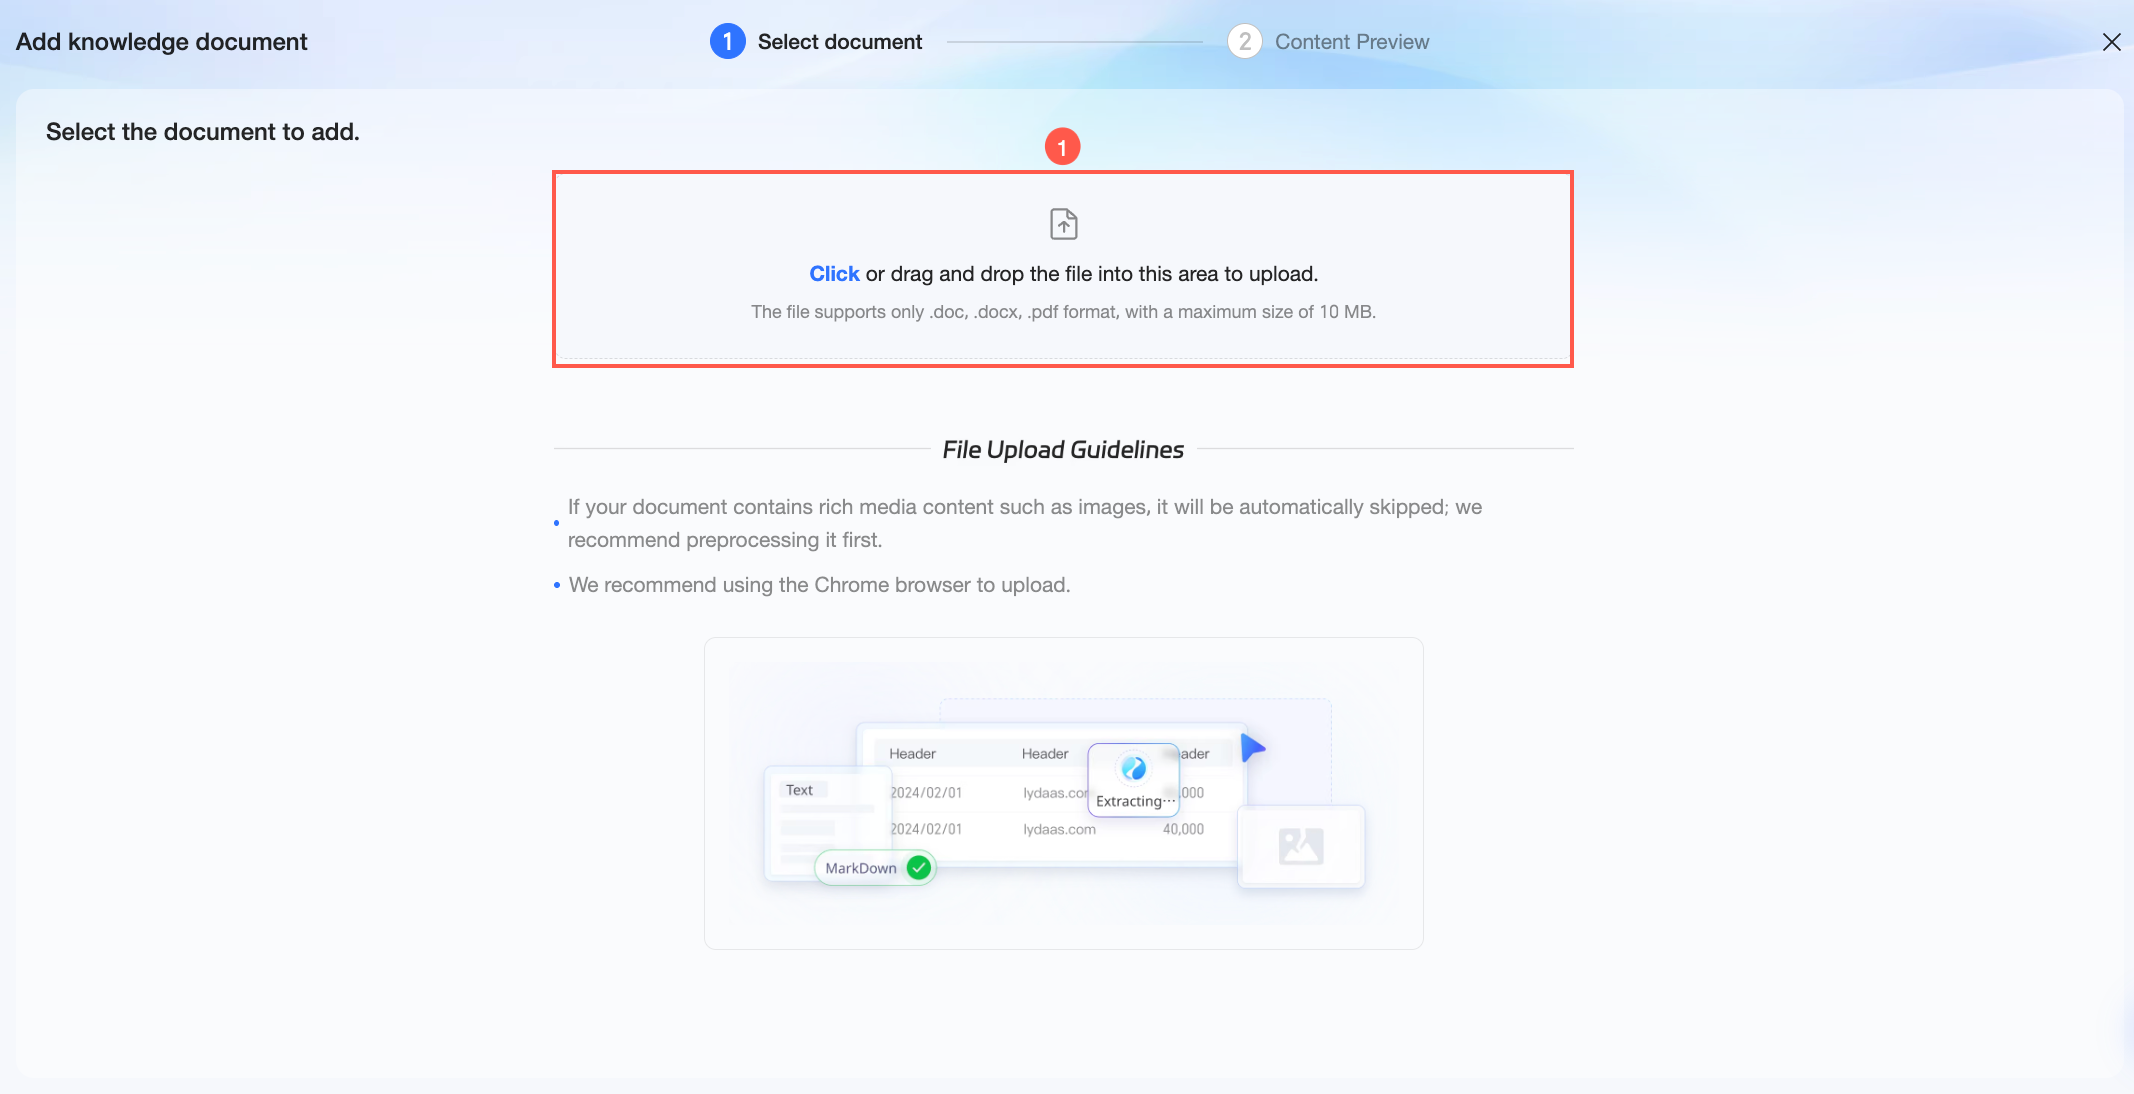
Click Add New Personal Knowledge. In the Add Knowledge Document dialog box, click or drag a knowledge file into area ① to upload it.
NoteOnly .doc and .pdf files are supported. The file size cannot exceed 10 MB.
-
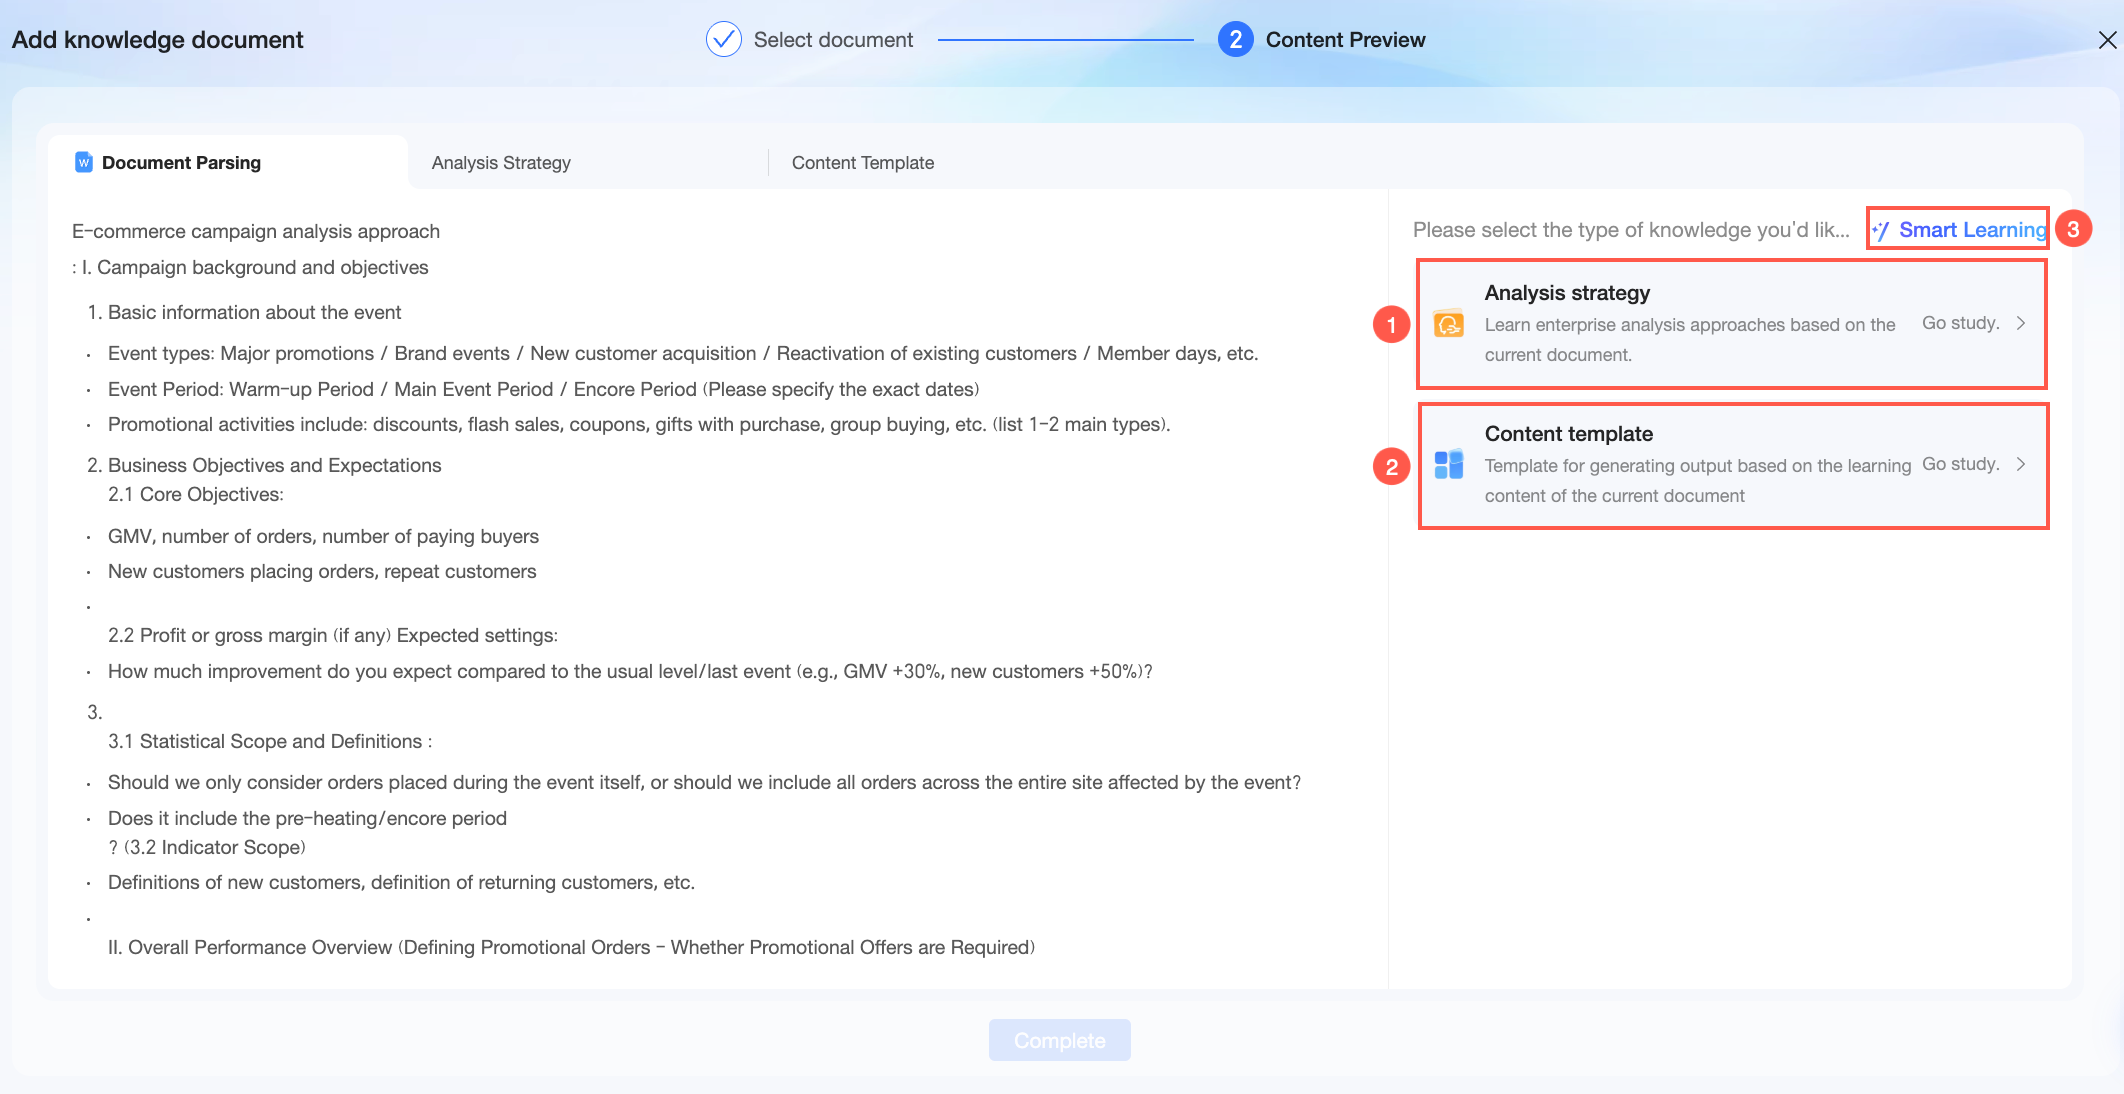
After the upload, the Content Preview stage begins. You can view the source document information on the Document Parsing tab.
-
① Click Learn on the analysis approach card to extract the analysis approach from the current document. After the process is complete, you can view the details on the Analysis approach tab.
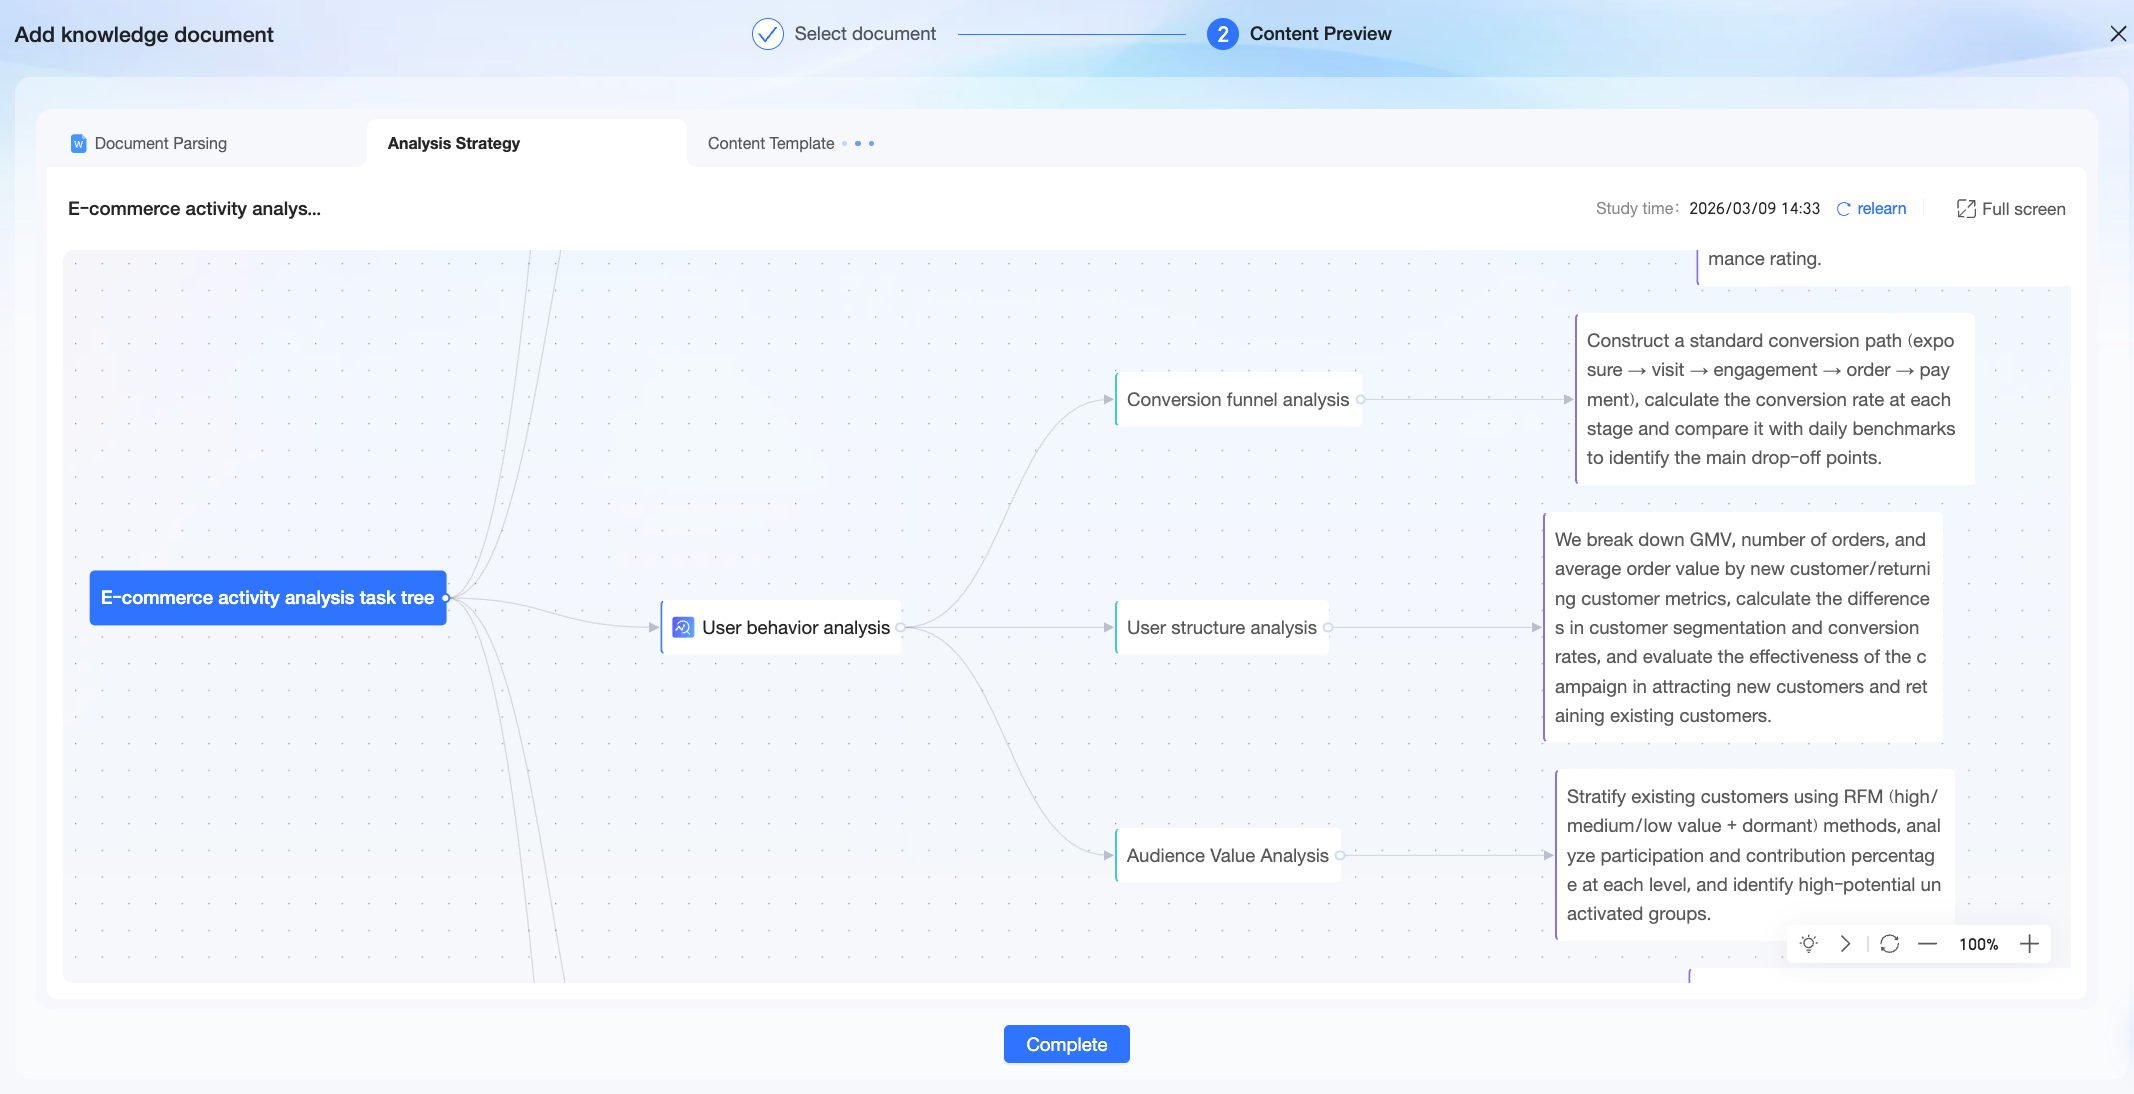 The analysis approach extracted by the system is displayed as a mind map. You can double-click the analysis approach name or node content to edit its text. You can also click the
  icon or use the Delete key to add or remove a node.
 -
② Click Learn on the content template card to learn the content output template from the current document. After the process is complete, you can view the details on the Content template tab.
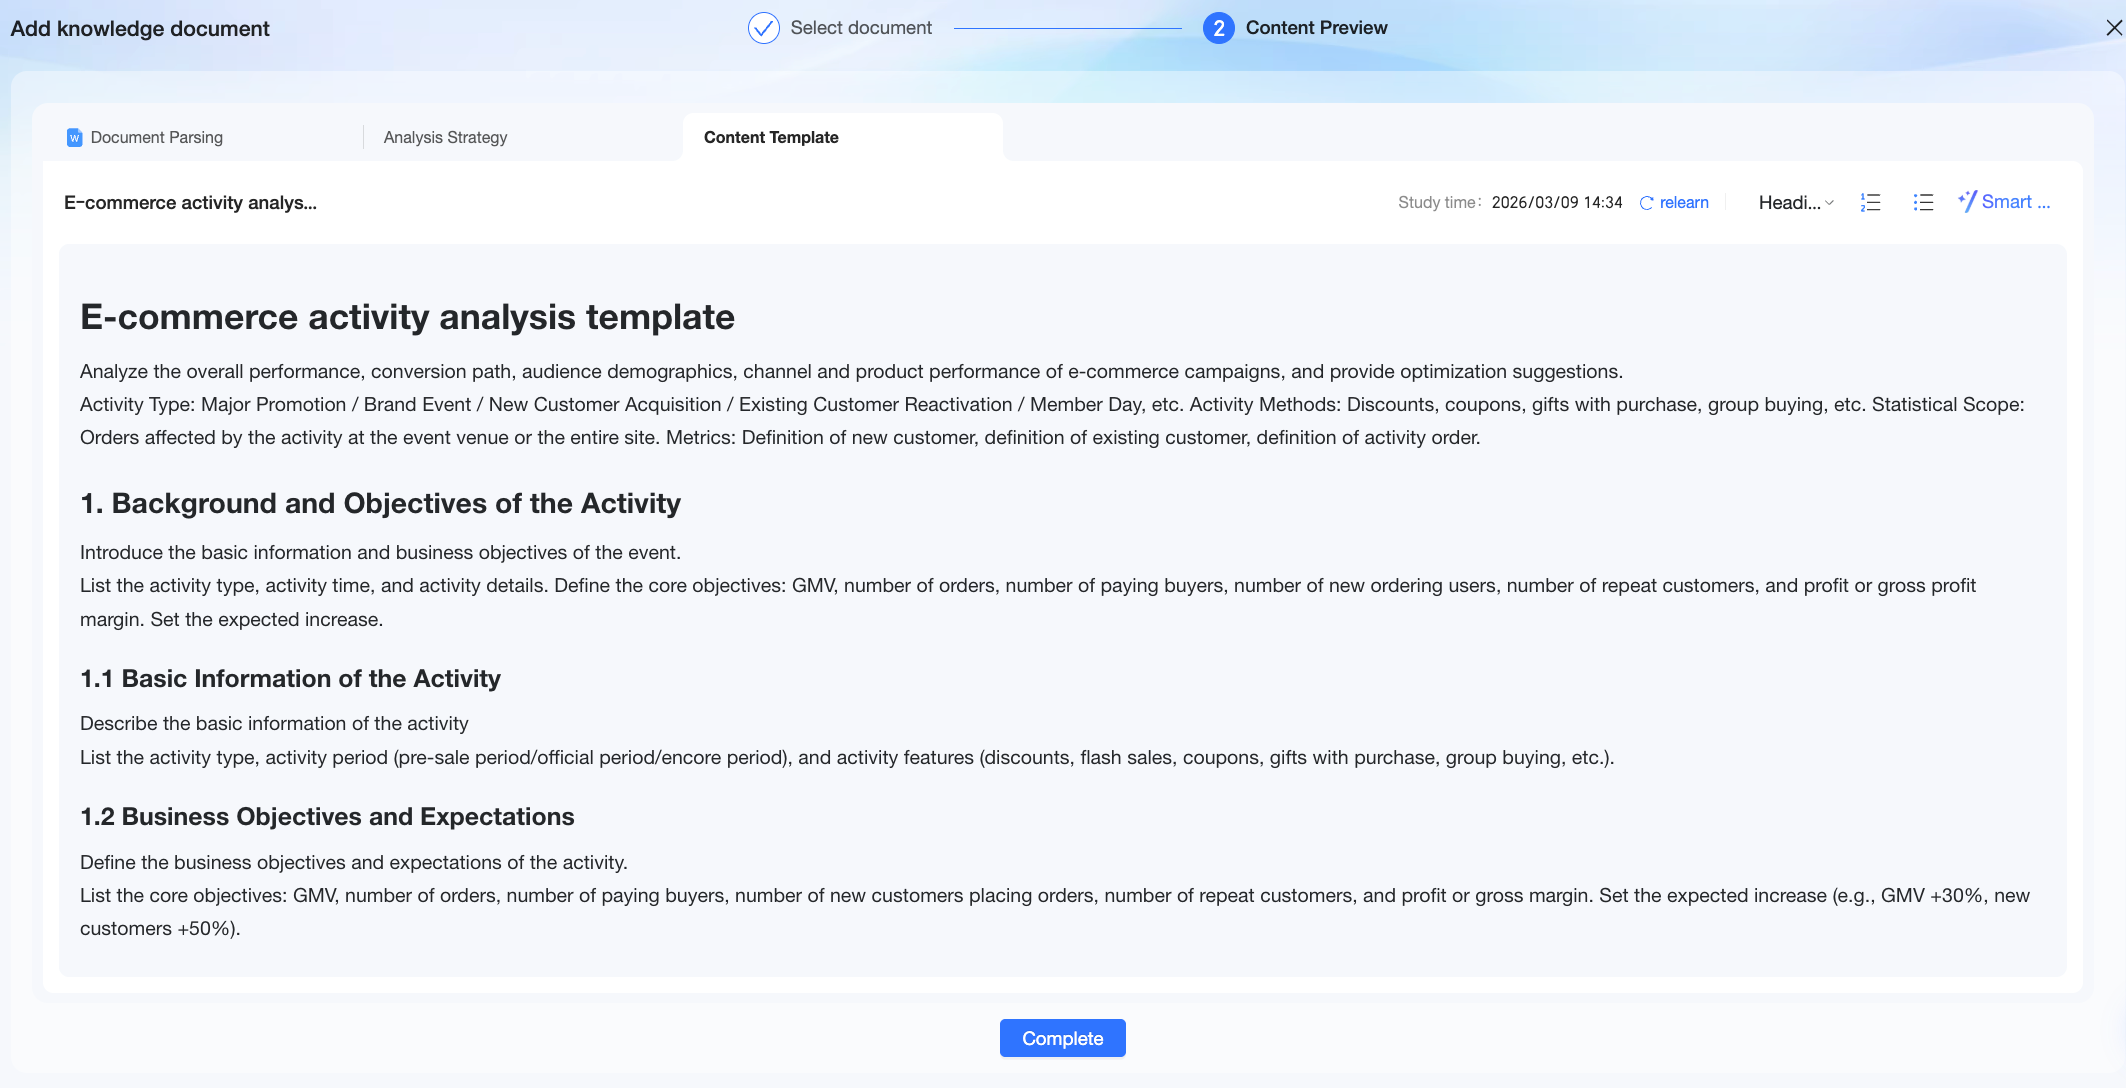 The content template extracted by the system is displayed as a document. You can edit the text, adjust its format, or use AI to help you optimize and refine the existing content.
 -
③ Click Smart Learning for Quick BI to automatically extract the relevant knowledge from the document.
-
-
Click Done. After the knowledge is added, it appears in your personal knowledge list. You can perform the following actions:
-
Select a piece of knowledge to apply it during report generation.
-
Click the
 icon and enter a keyword in the search box to quickly find a piece of knowledge.
 -
Click the
 icon to delete knowledge content that you no longer need.
 -
Click the
icon to preview the knowledge content details in the Specify an analysis approach dialog box.
-
Note-
Personal knowledge is visible only to the individual who uploaded it. It is not accessible to other organization members and is not synchronized to the enterprise knowledge base in Organization Management.
-
When a report creator shares a report generated from personal knowledge, authorized users can update the data and regenerate the report within the shared report. However, they cannot use the creator's personal knowledge for actions like one-click report generation outside of that report.
-
One-click interpretation
You can click one-click interpretation to quickly interpret the dashboard data.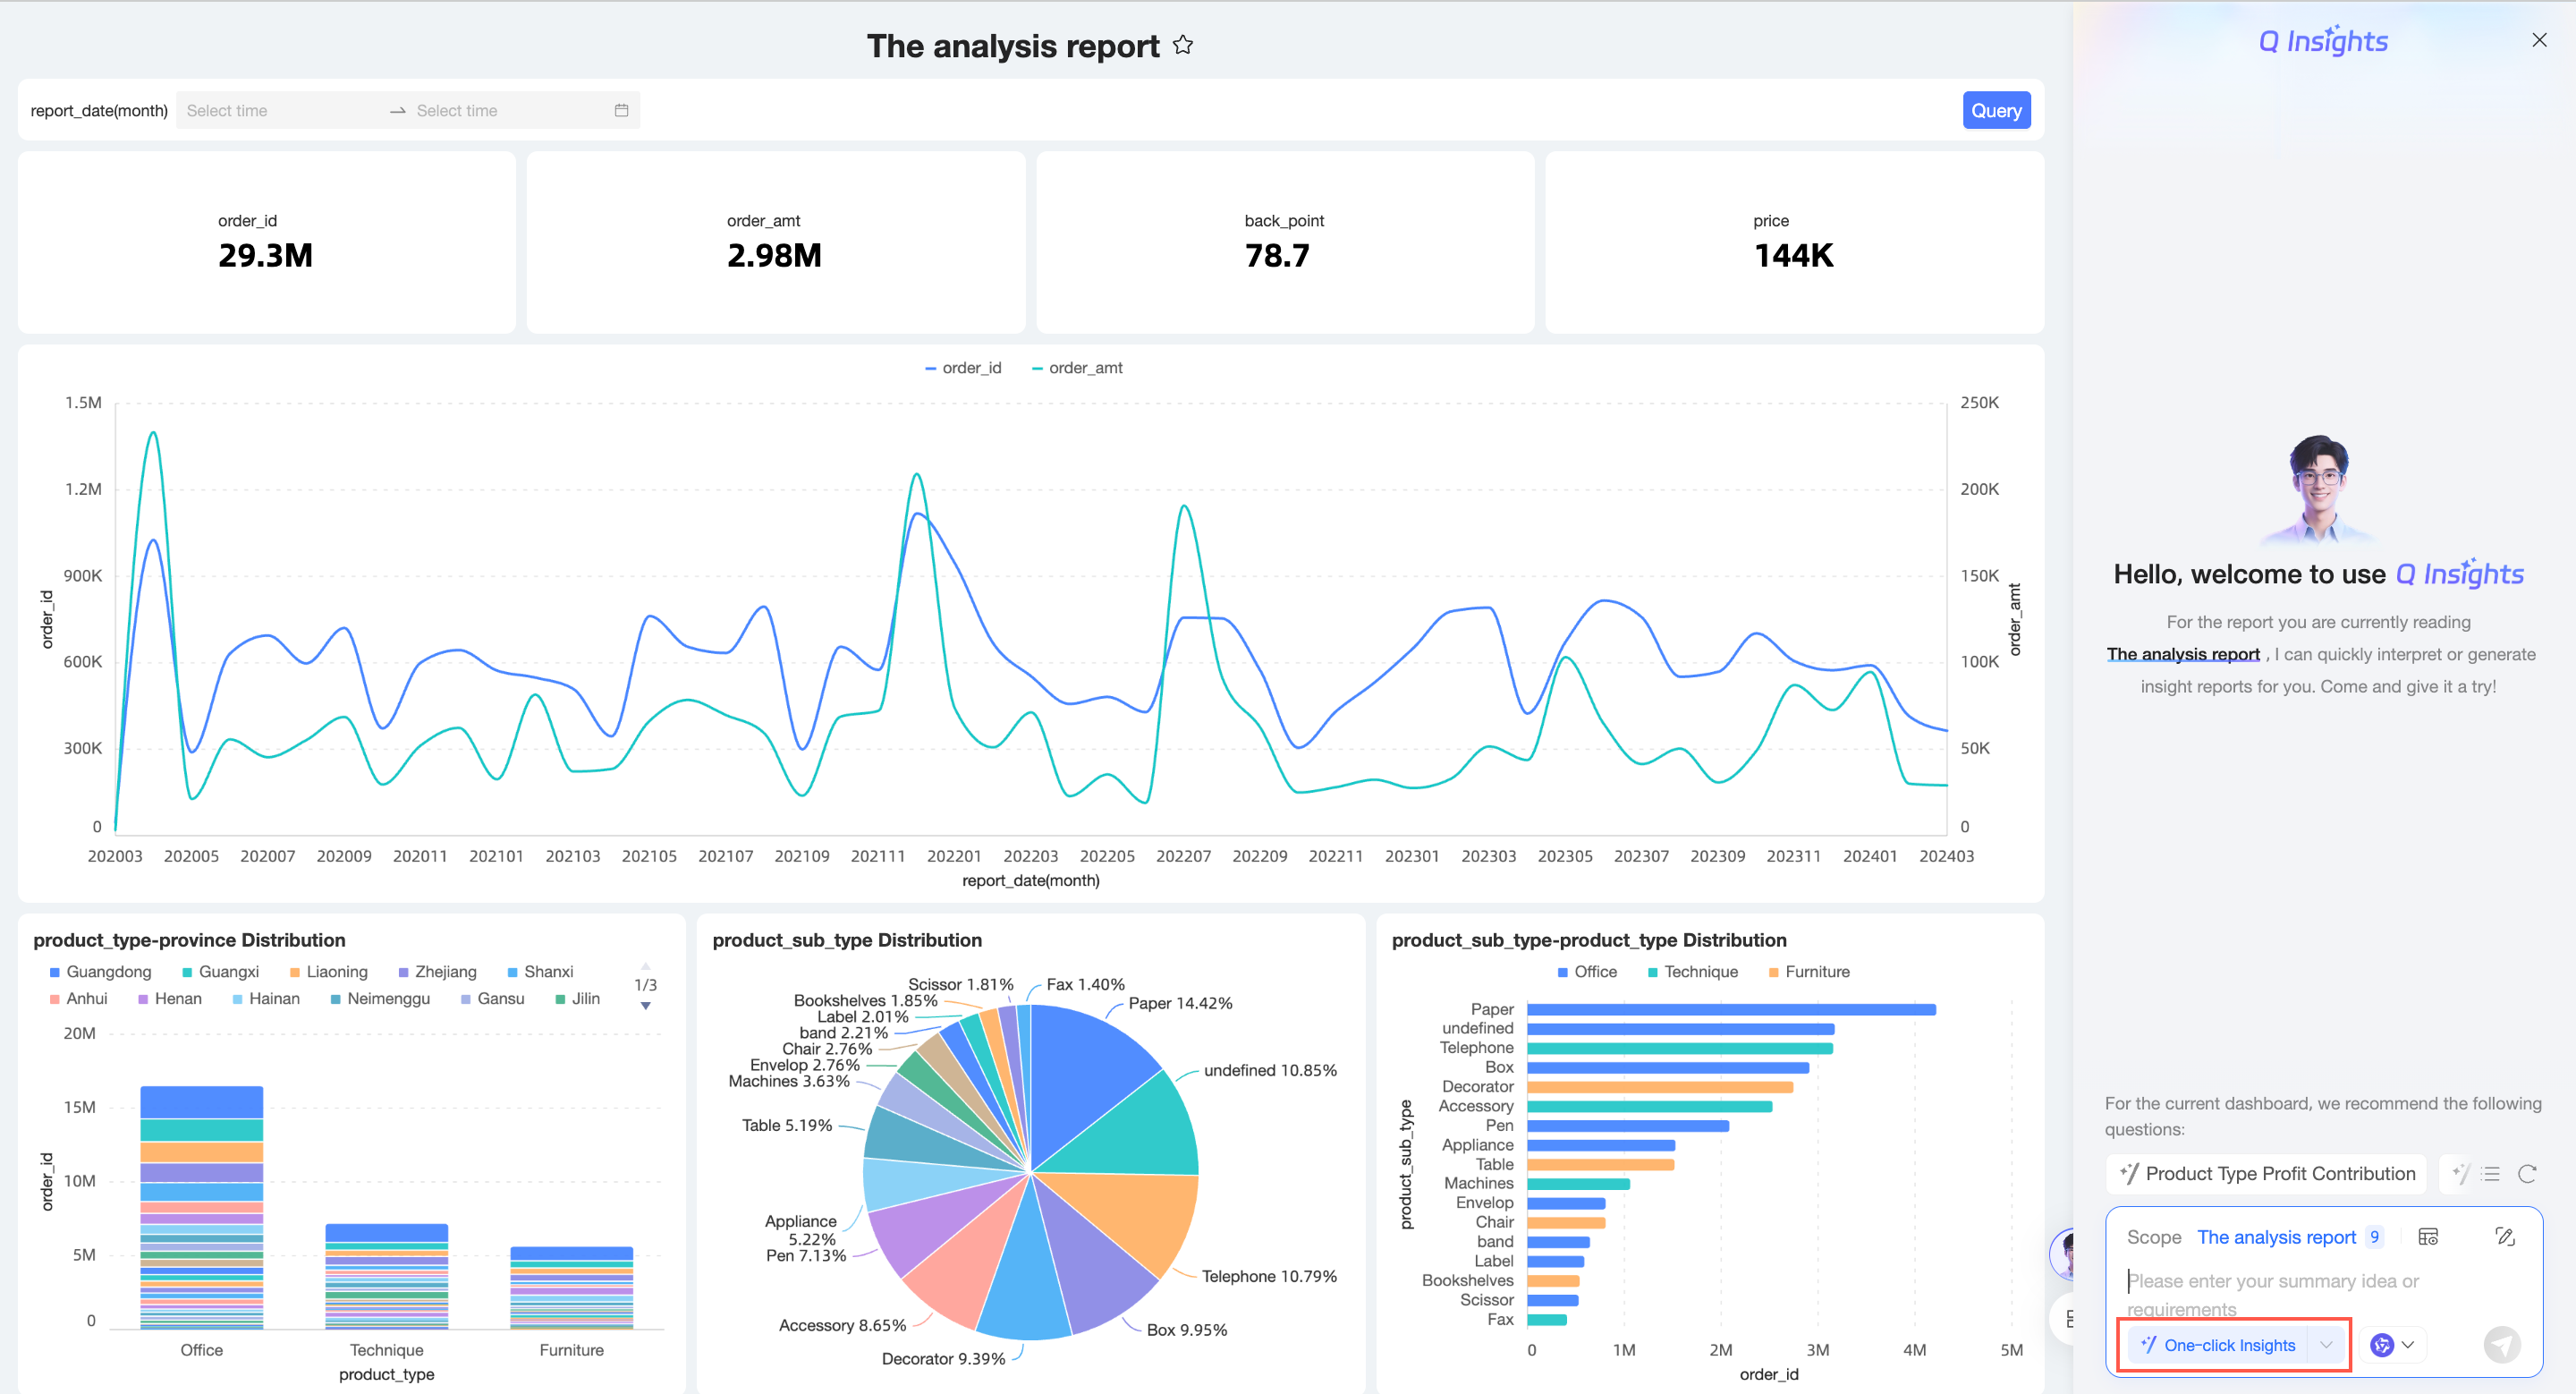
If a preset prompt is configured, the system performs the interpretation based on the preset prompt.
Enter an analysis approach
Simple input
Enter a simple query or analysis approach, then click the ![]() icon in the lower-right corner or press Enter. The system returns the data interpretation results.
icon in the lower-right corner or press Enter. The system returns the data interpretation results.
Composite analysis approach
-
Click the
 icon on the right side of the dialog box to configure the composite analysis approach.
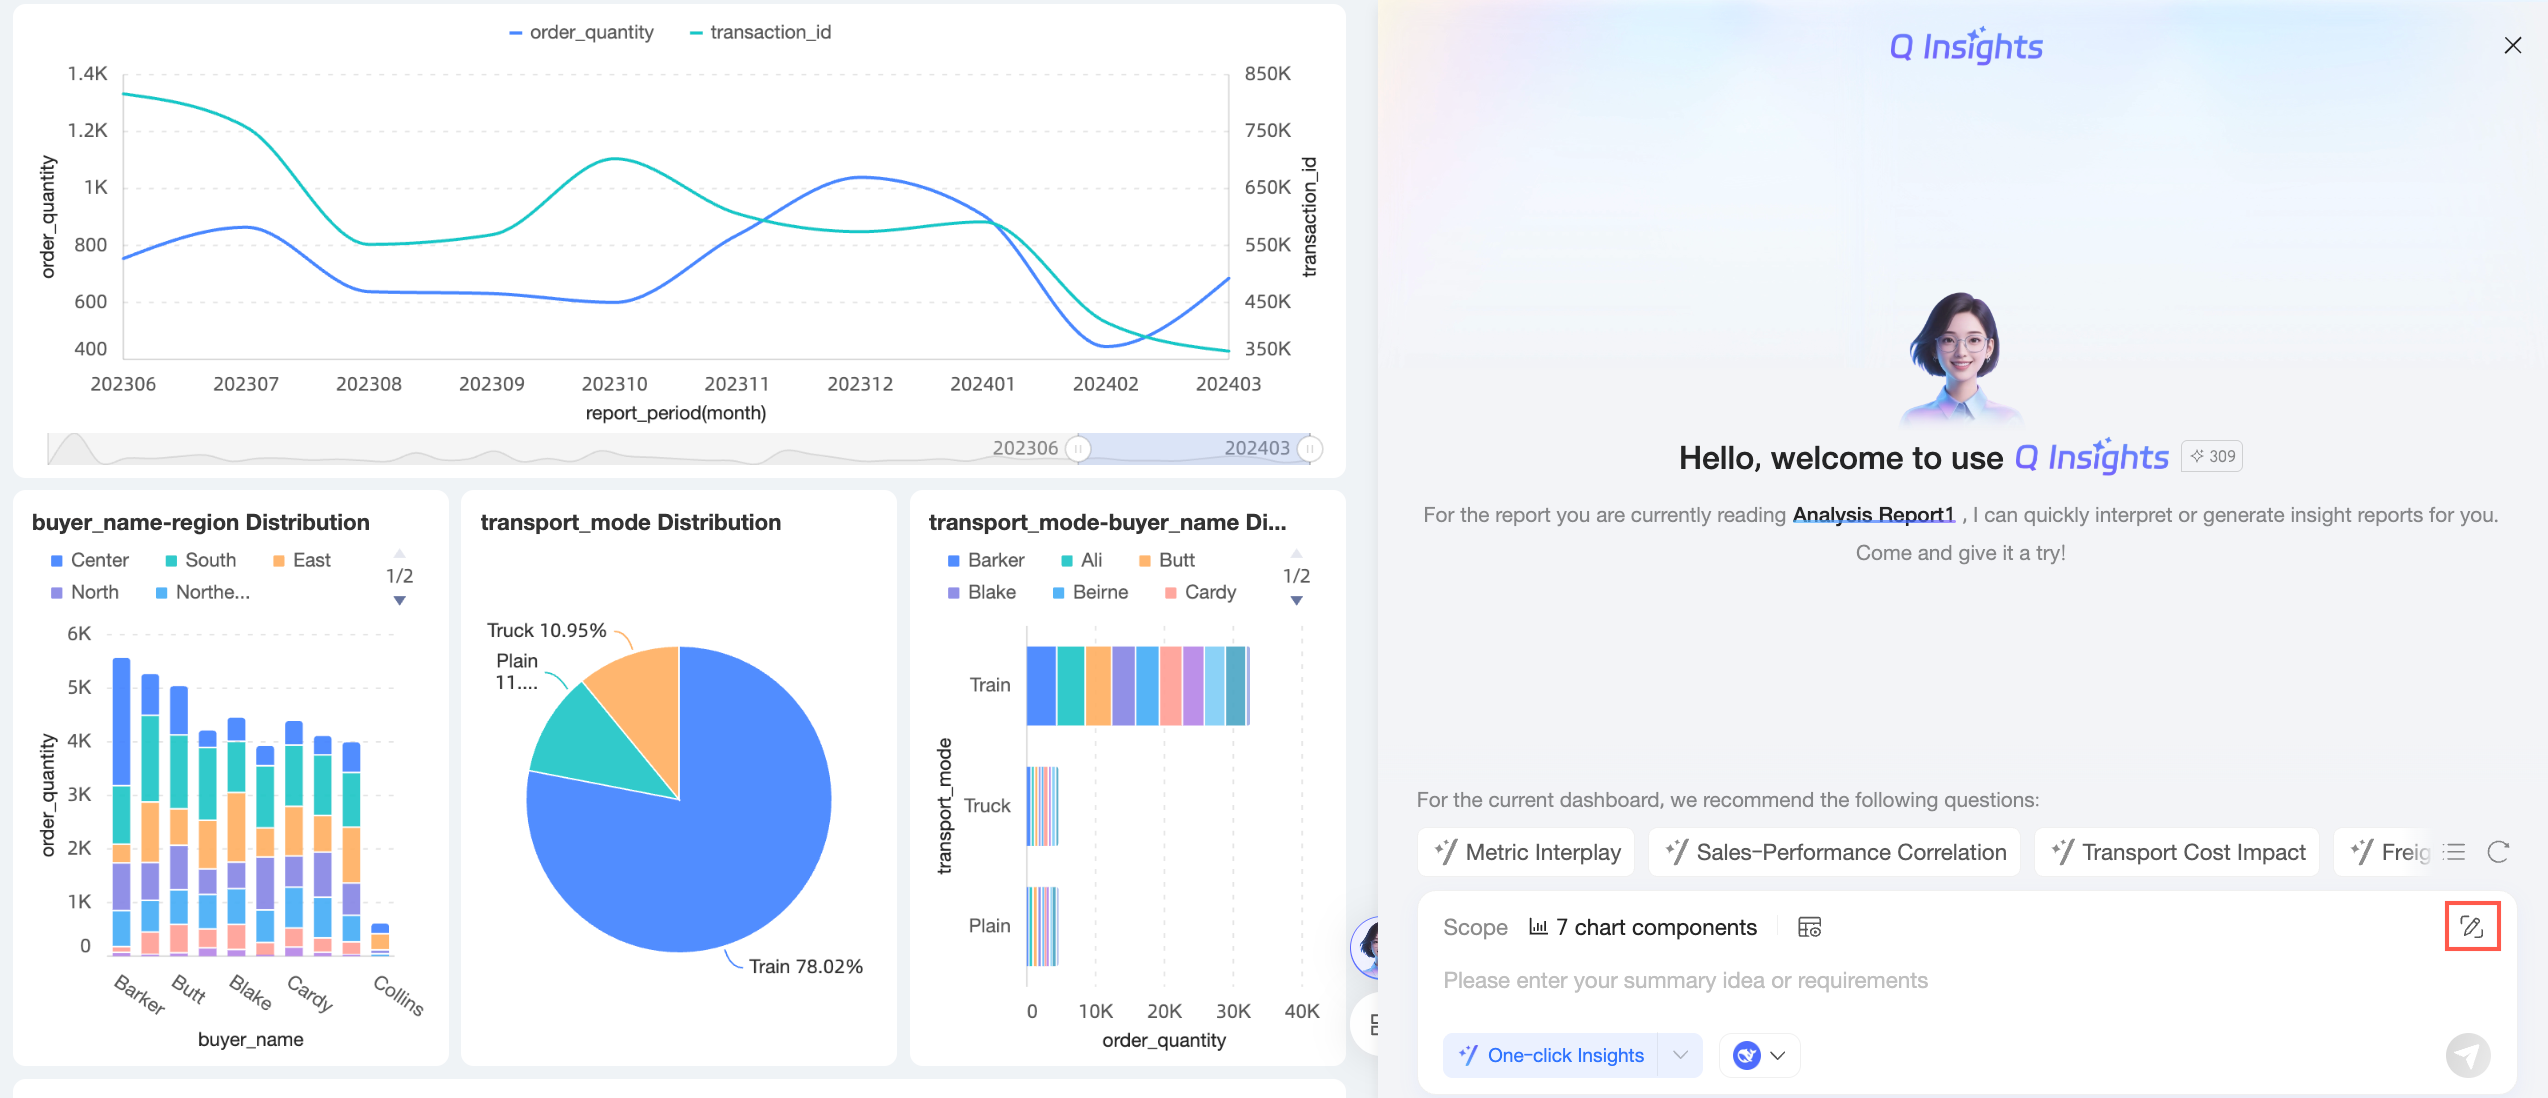
-
On the Composite analysis approach configuration page, set the following parameters.

Parameter
Description
Dashboard preset analysis approach
-
If you have configured a preset prompt, the Dashboard preset analysis approach is enabled by default, and this approach will be applied. You can disable it if you do not want to use the preset approach.
-
This parameter is not displayed if a preset prompt is not configured.
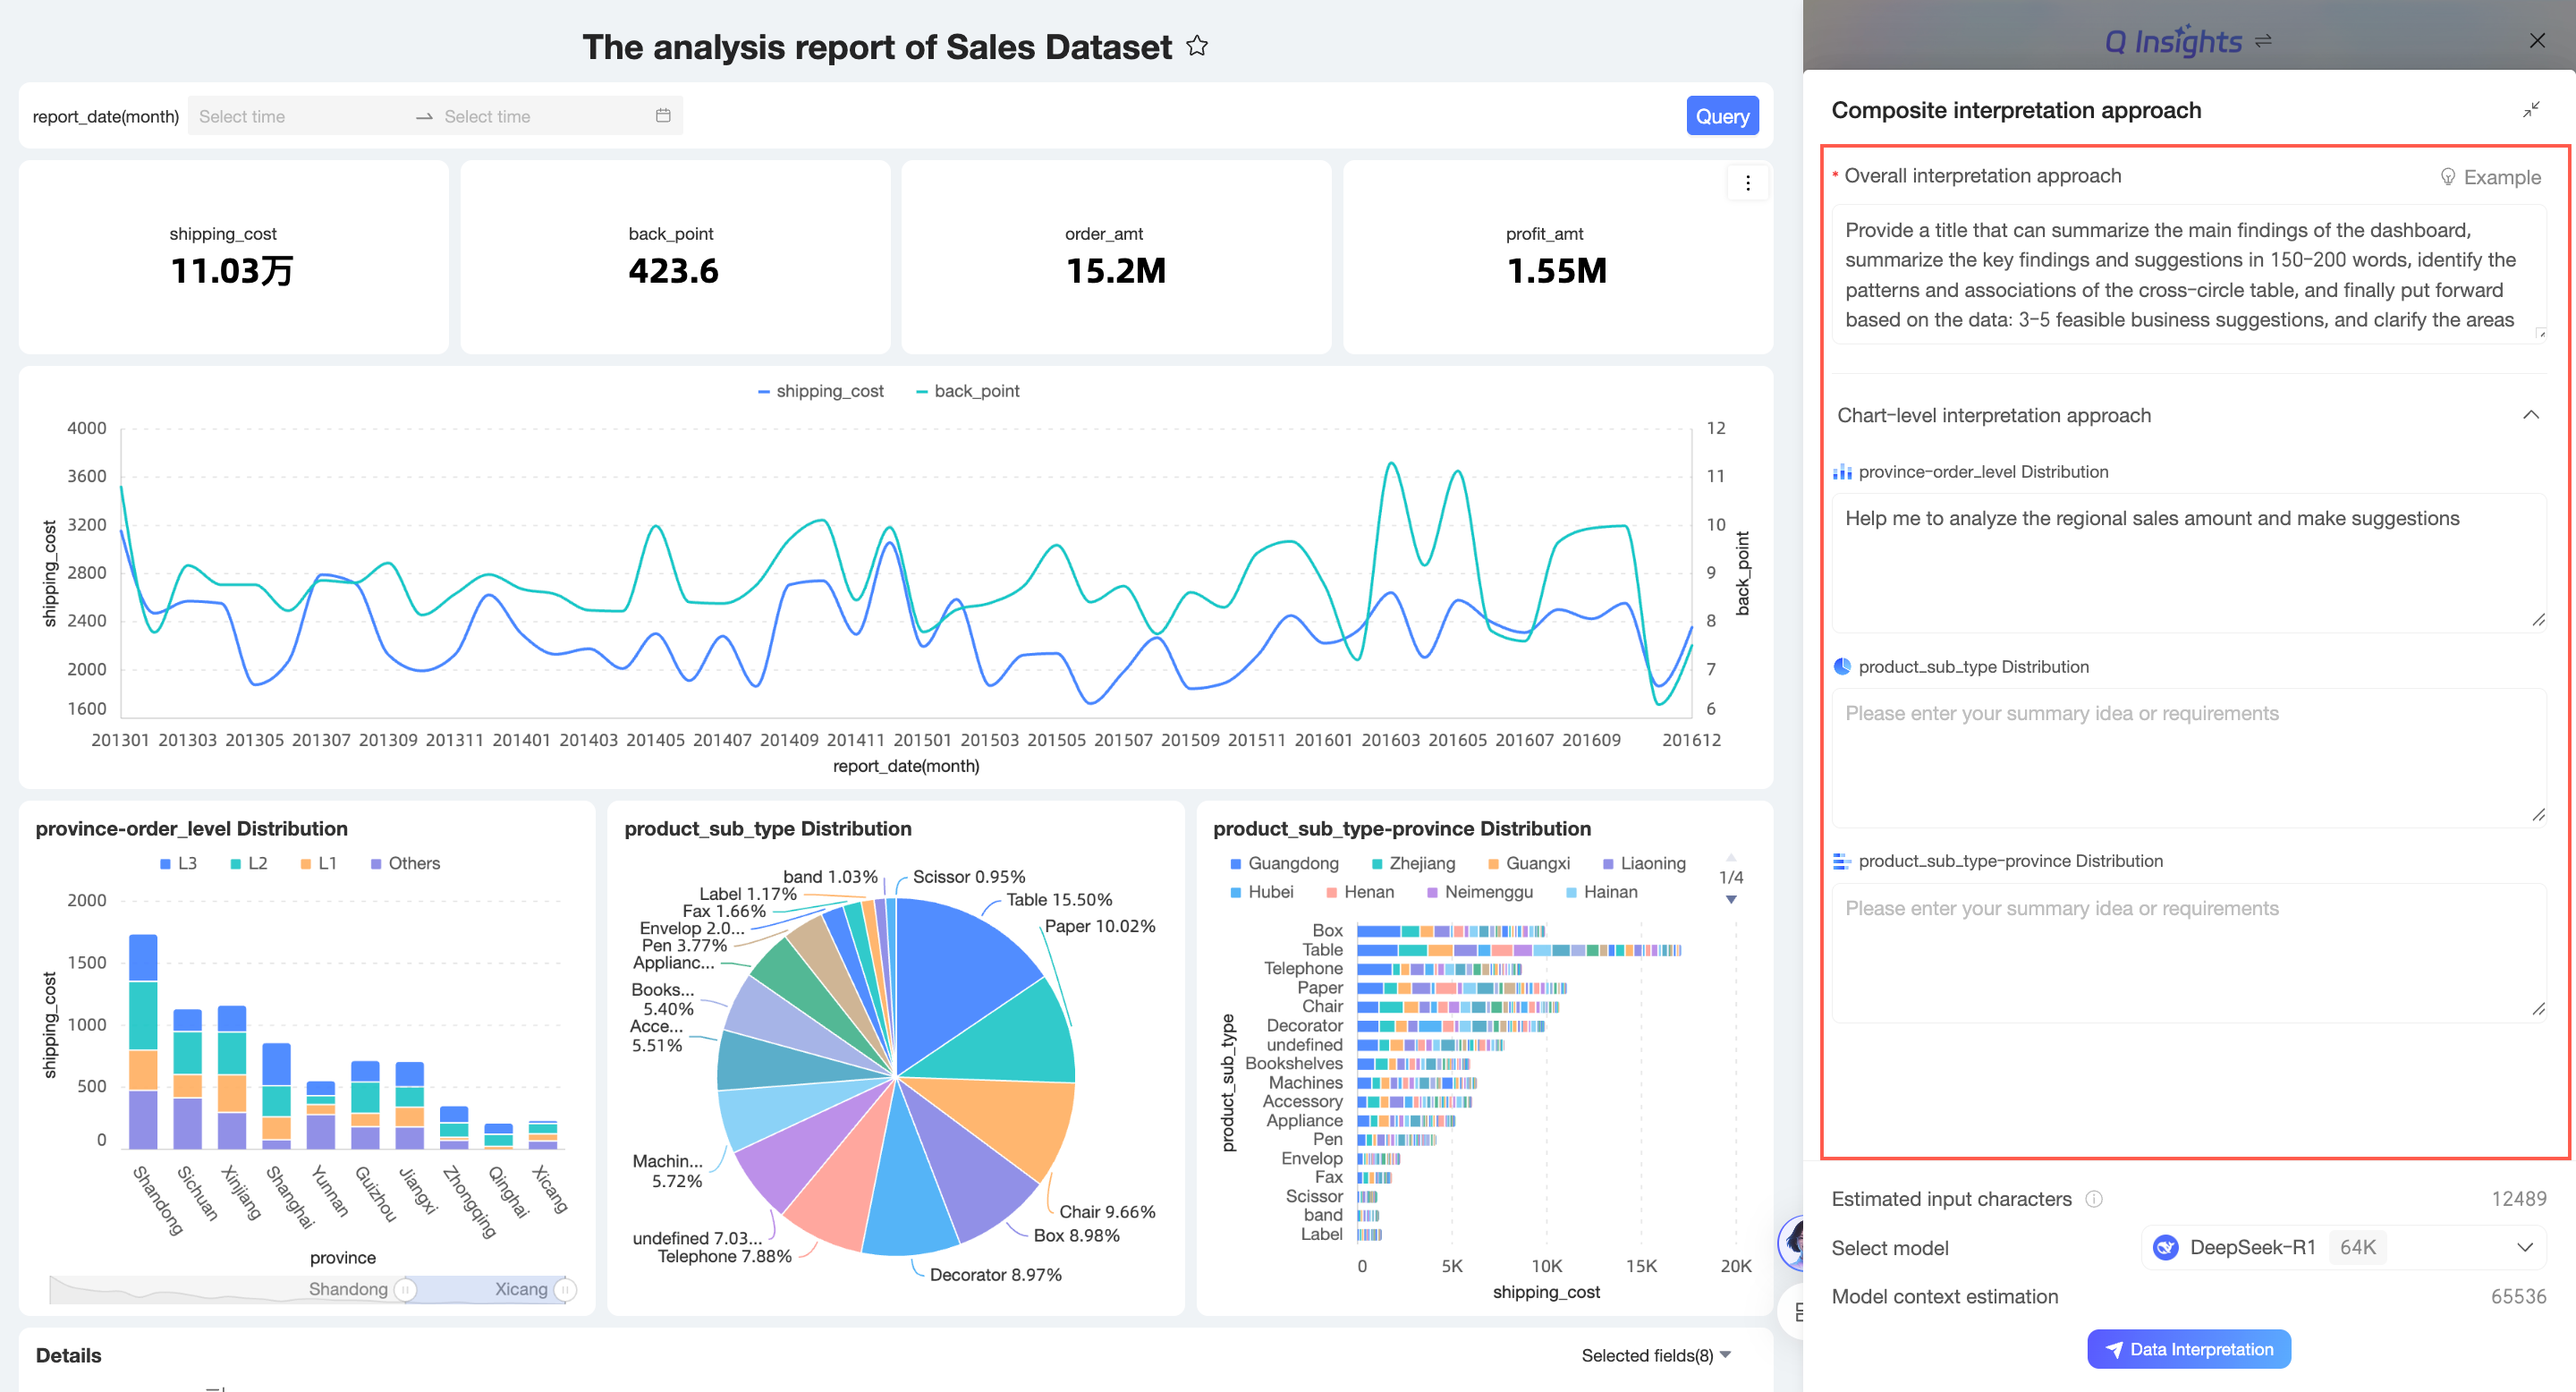
Overall analysis approach
Refer to the Example to enter an overall analysis approach for the dashboard.
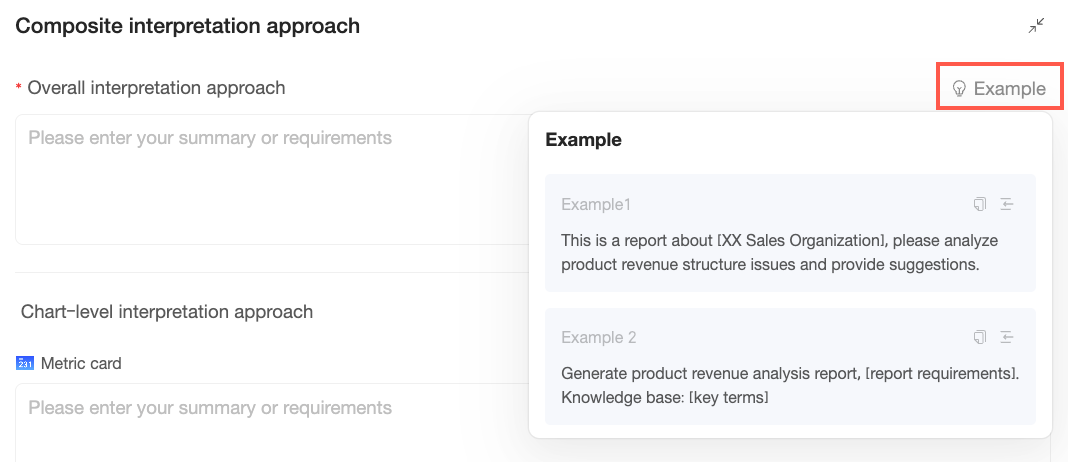
You can Copy (①) or Insert (②) the example analysis approach.
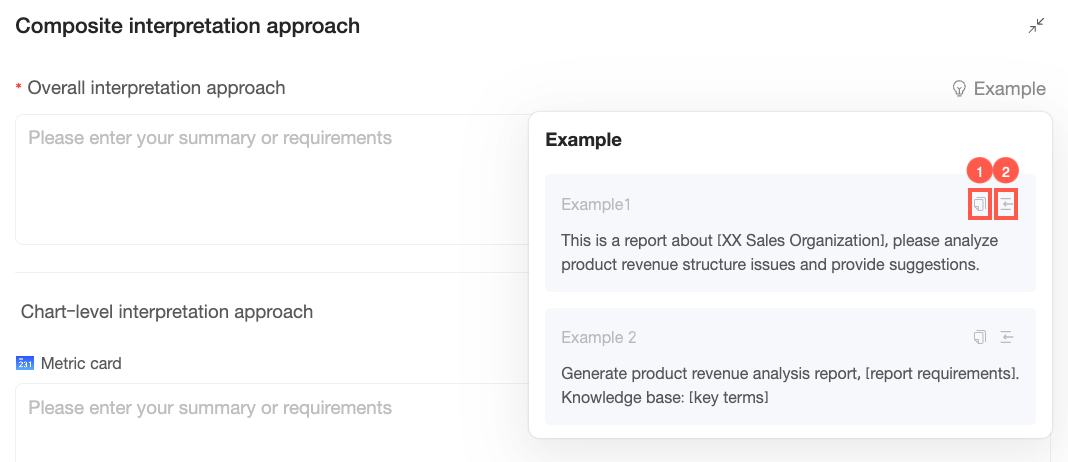
Chart-level analysis approach
The analysis approach set individually for each chart on the dashboard.
Estimated input characters
Displays the character count for the interpretation scope, overall analysis approach, chart-level analysis approach, preset analysis approach, and their total.
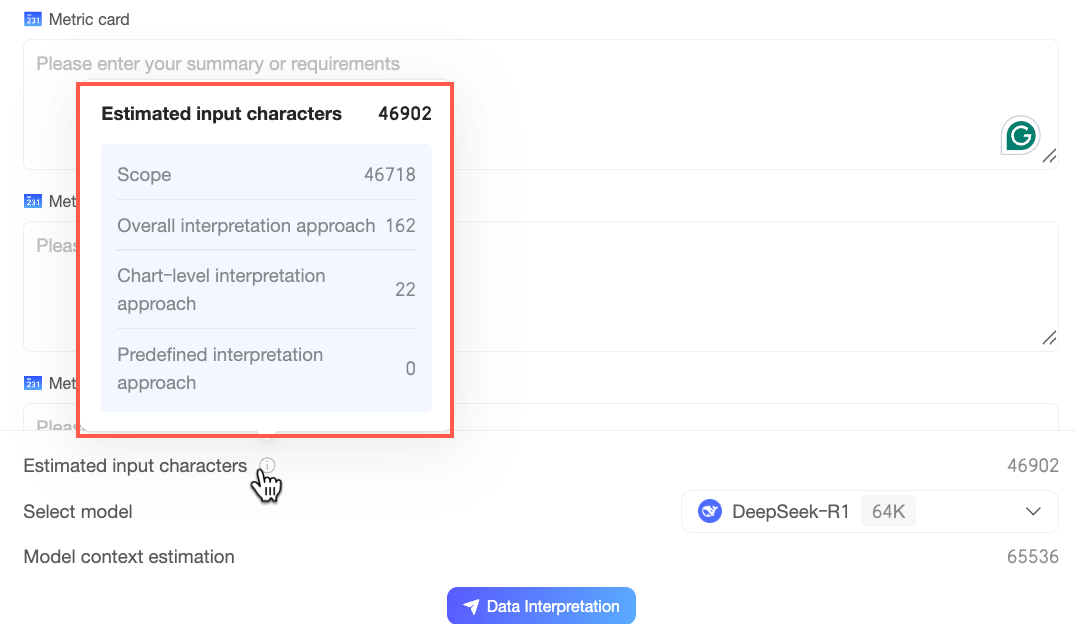
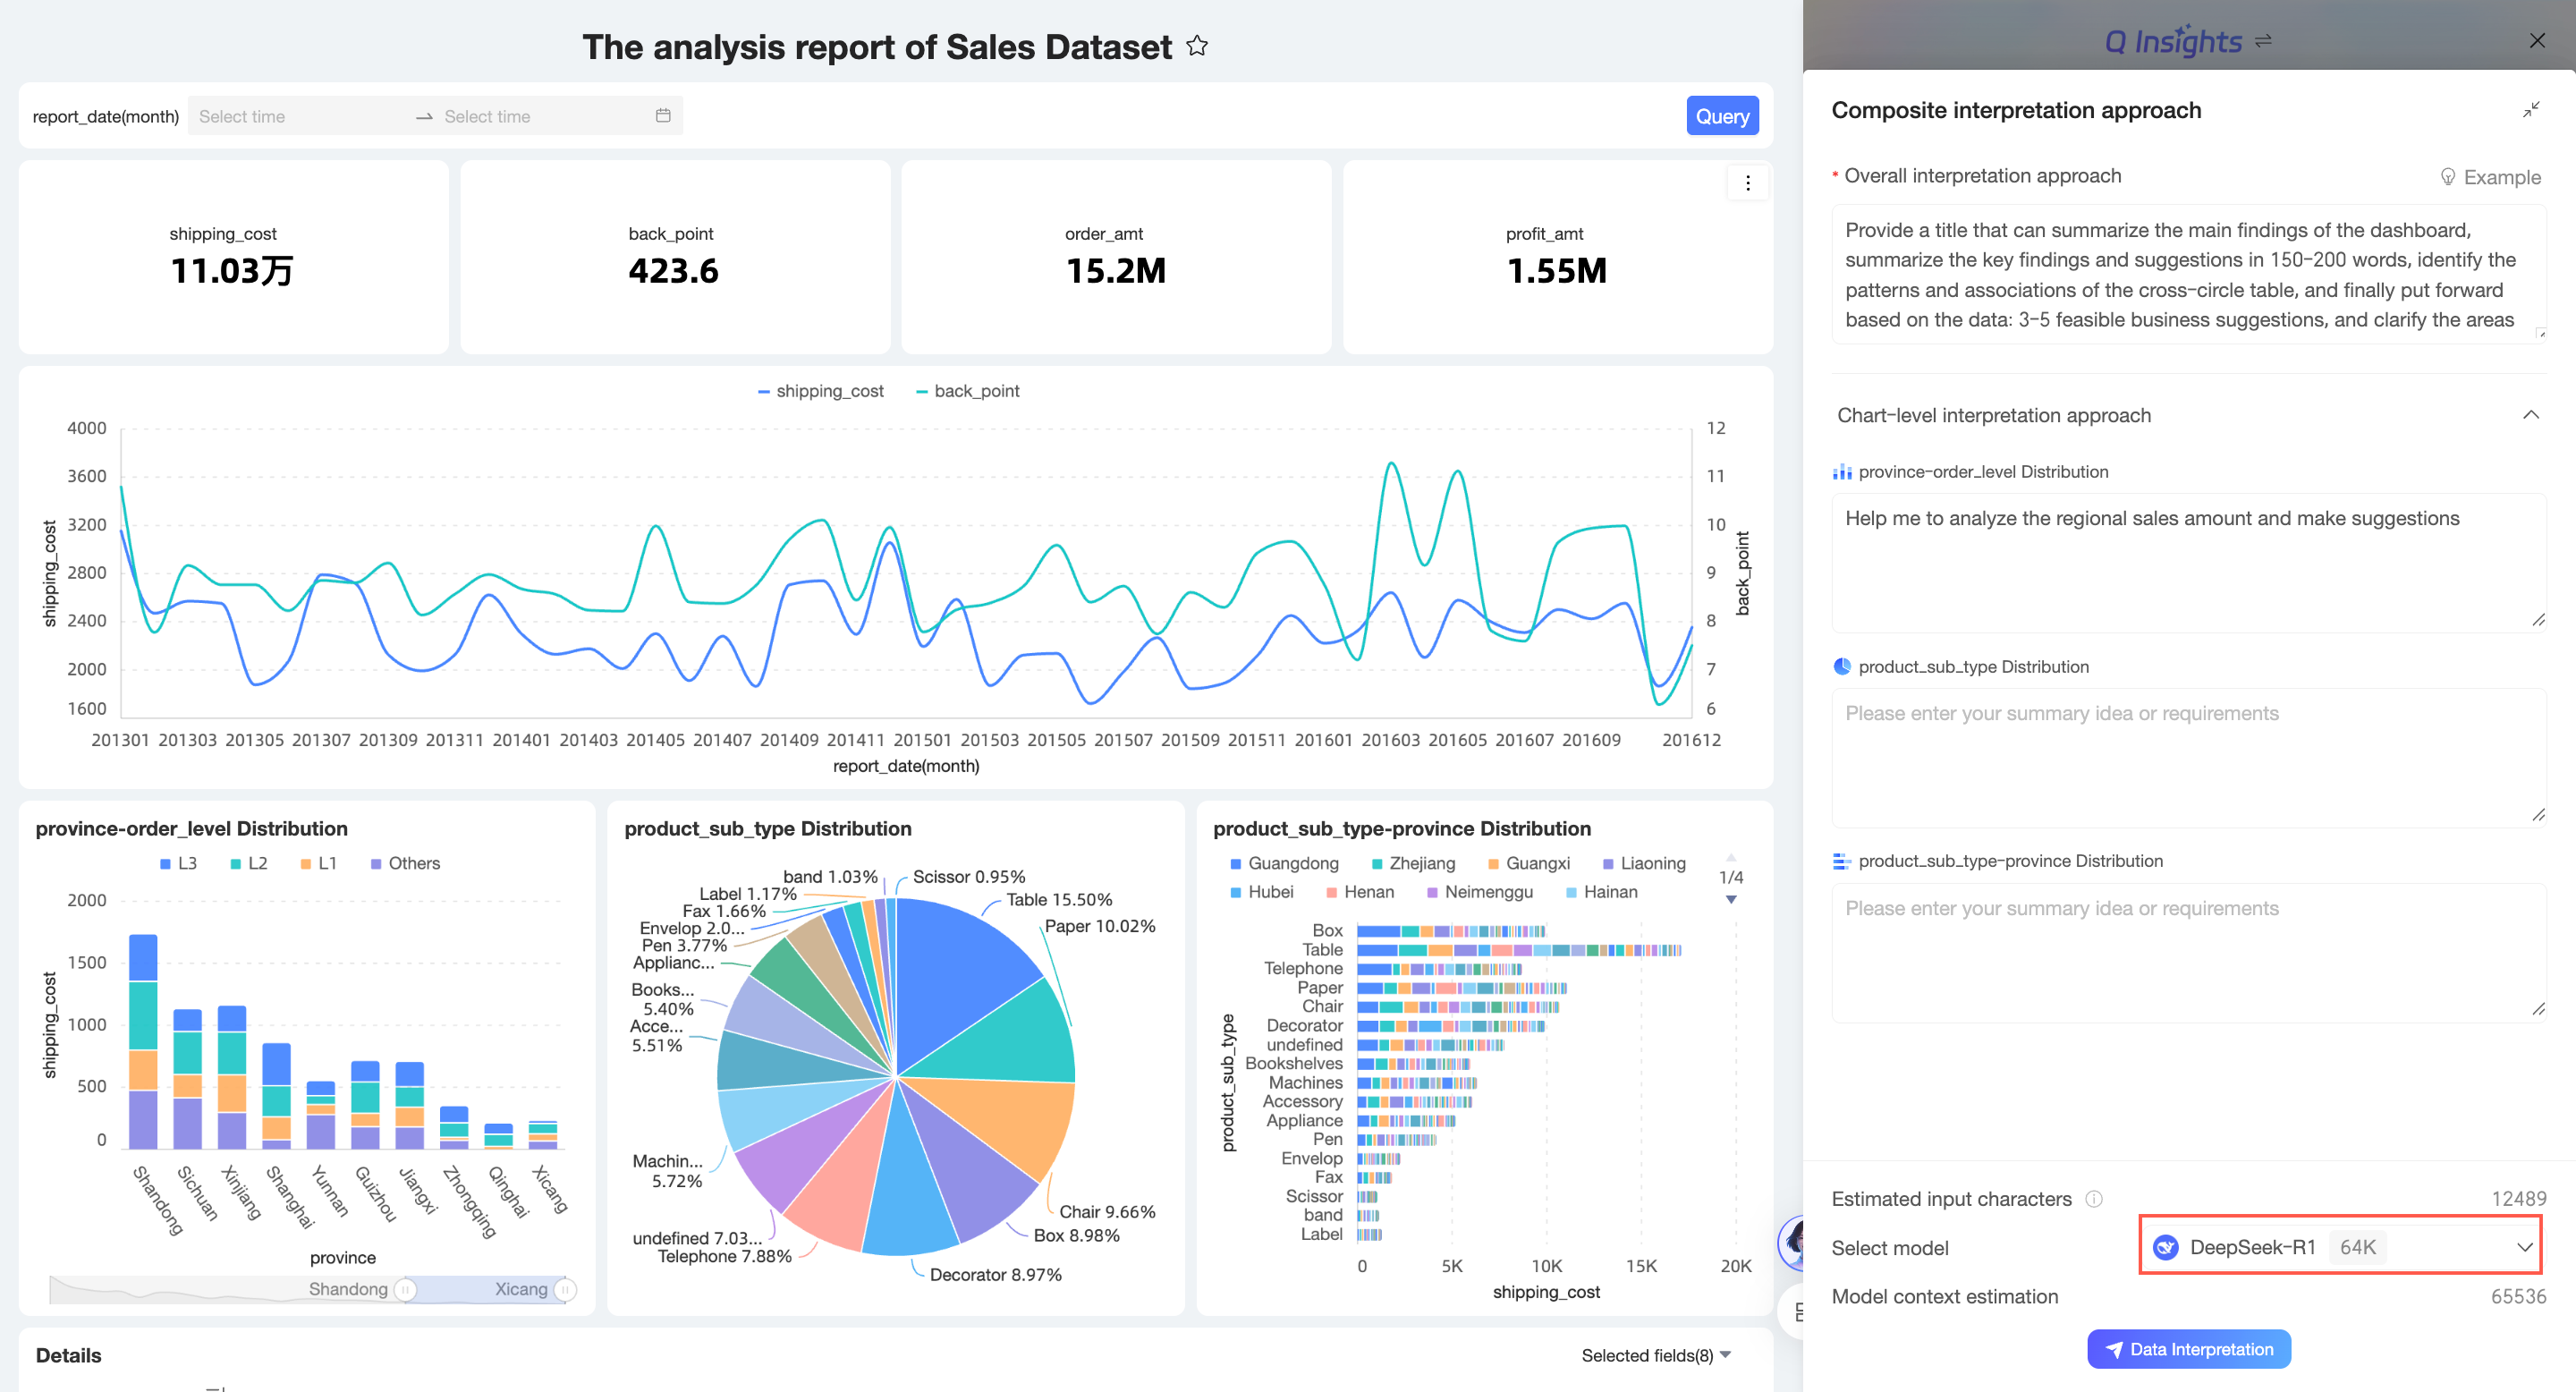
Select model
You can choose between a built-in large language model and a custom large language model.
Estimated model context
Estimated characters for the model's context.
NoteIf the estimated input characters exceed the model's context length, the interpretation may fail. Select a model with a longer context length or proceed with the current selection.
-
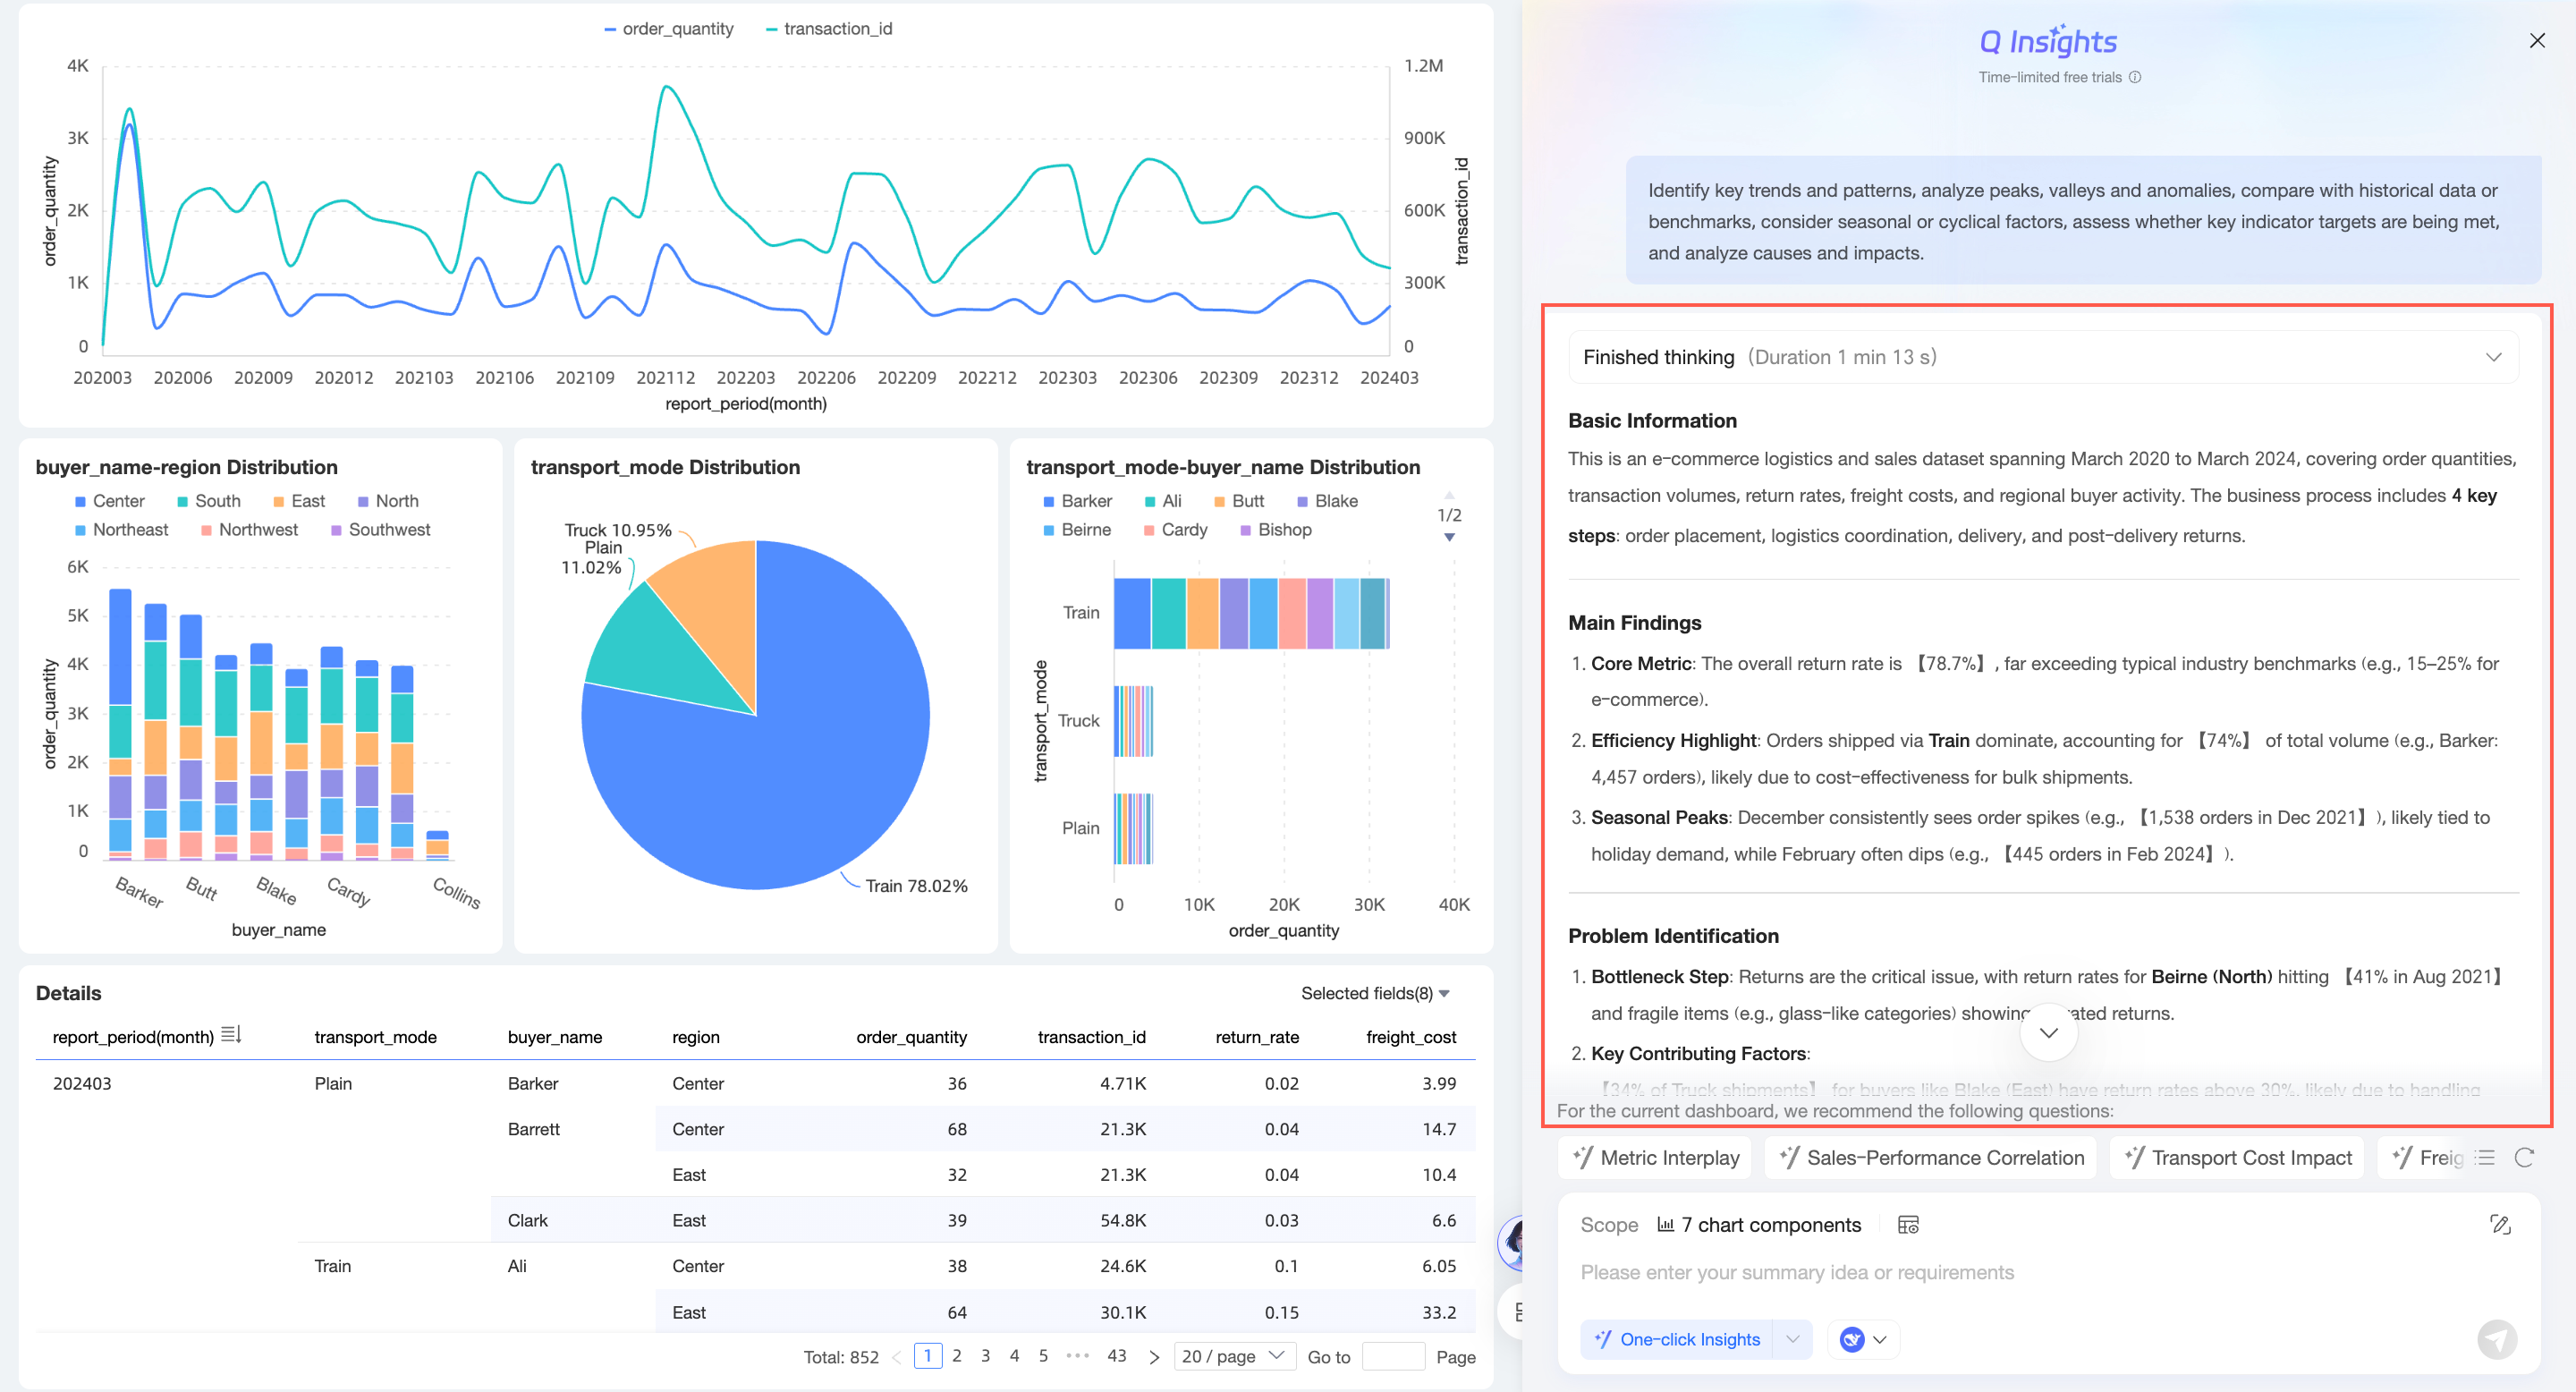
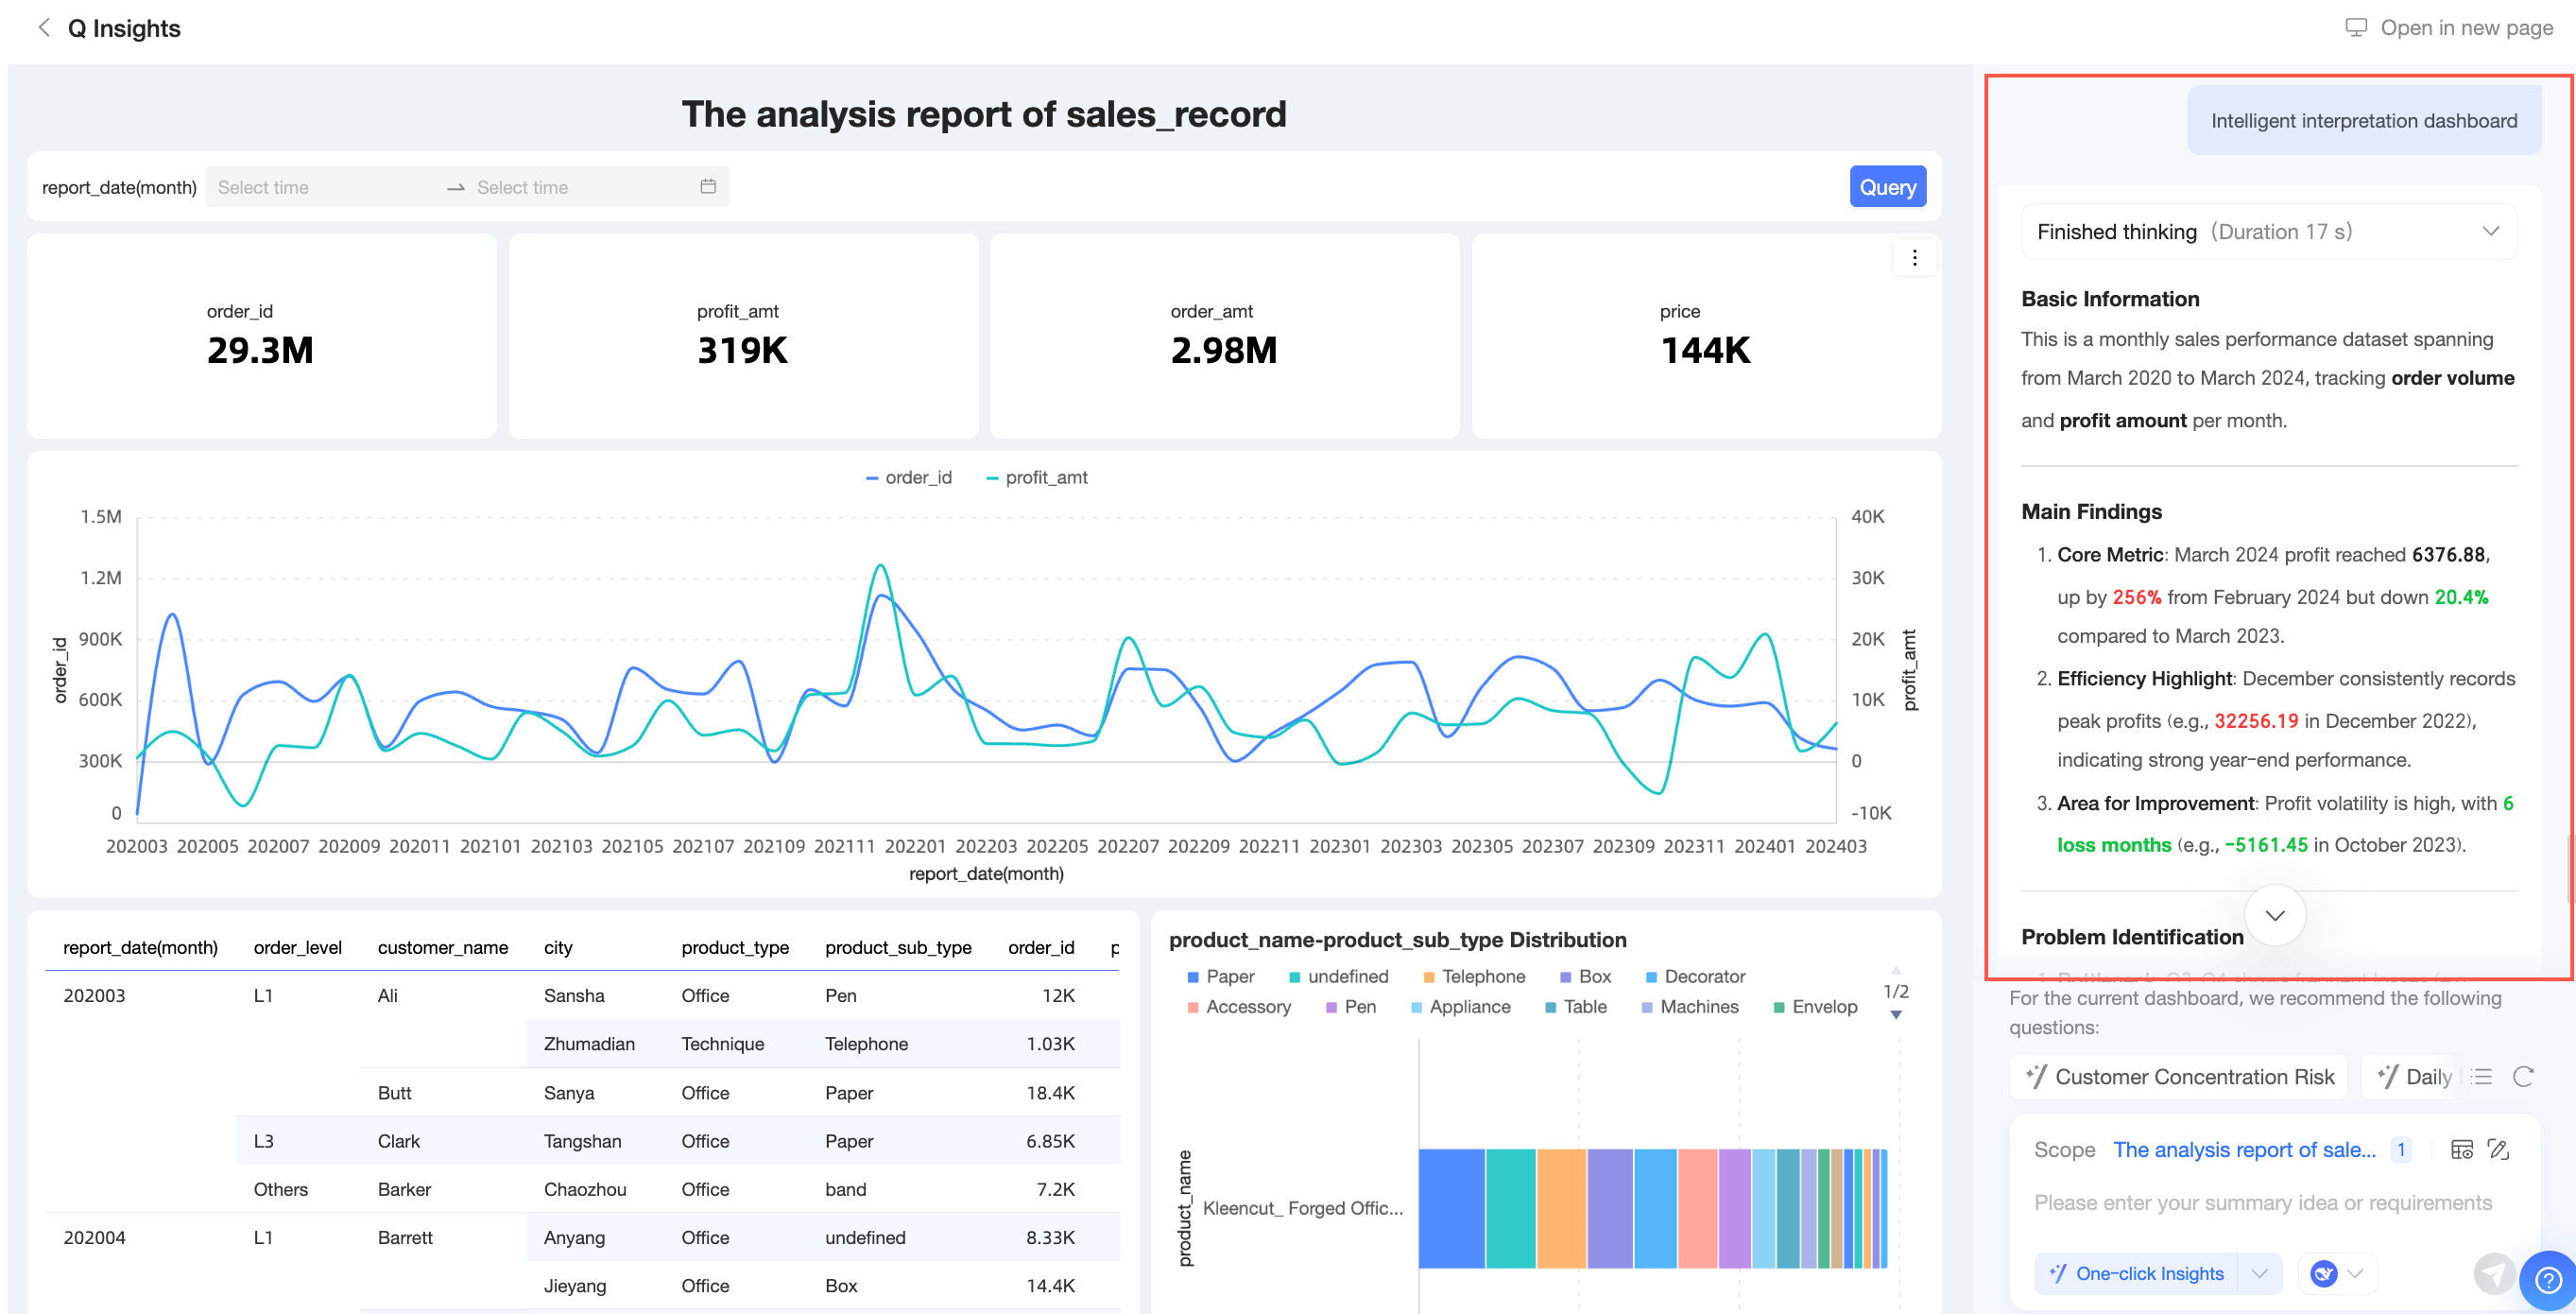
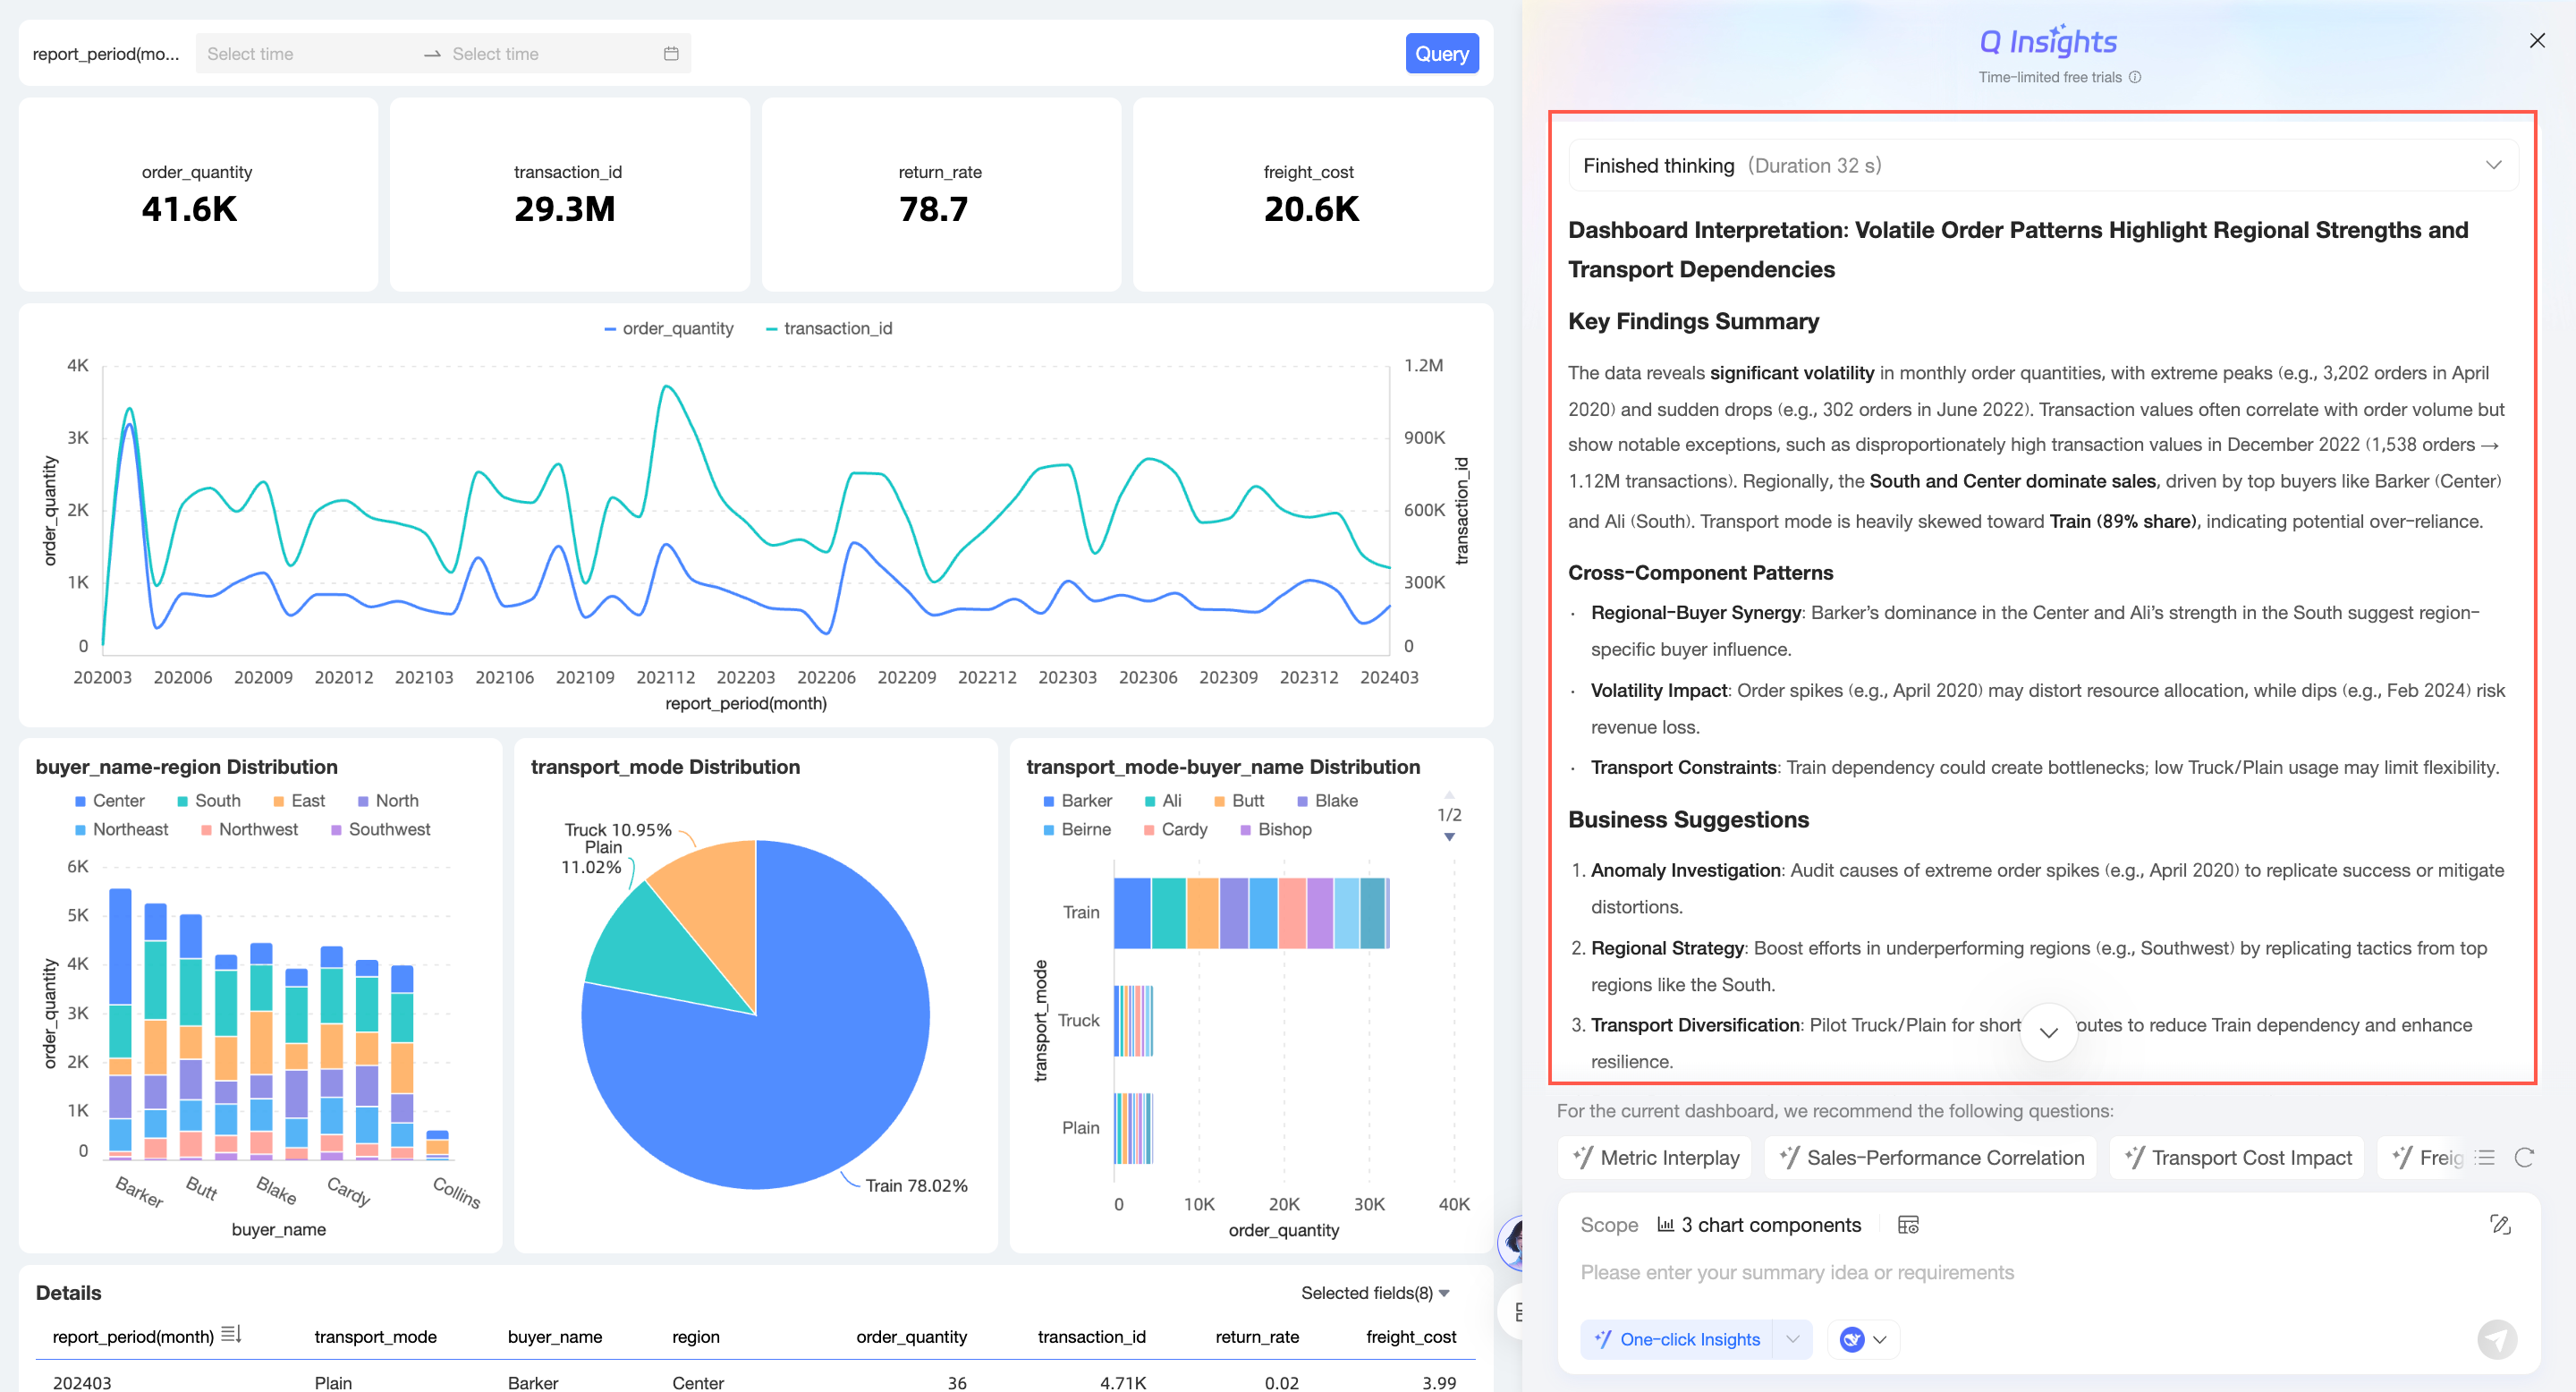
Get interpretation results
The interpretation results vary depending on whether you use Recommended Questions, a simple analysis approach, or a composite analysis approach. For details, see Usage examples.
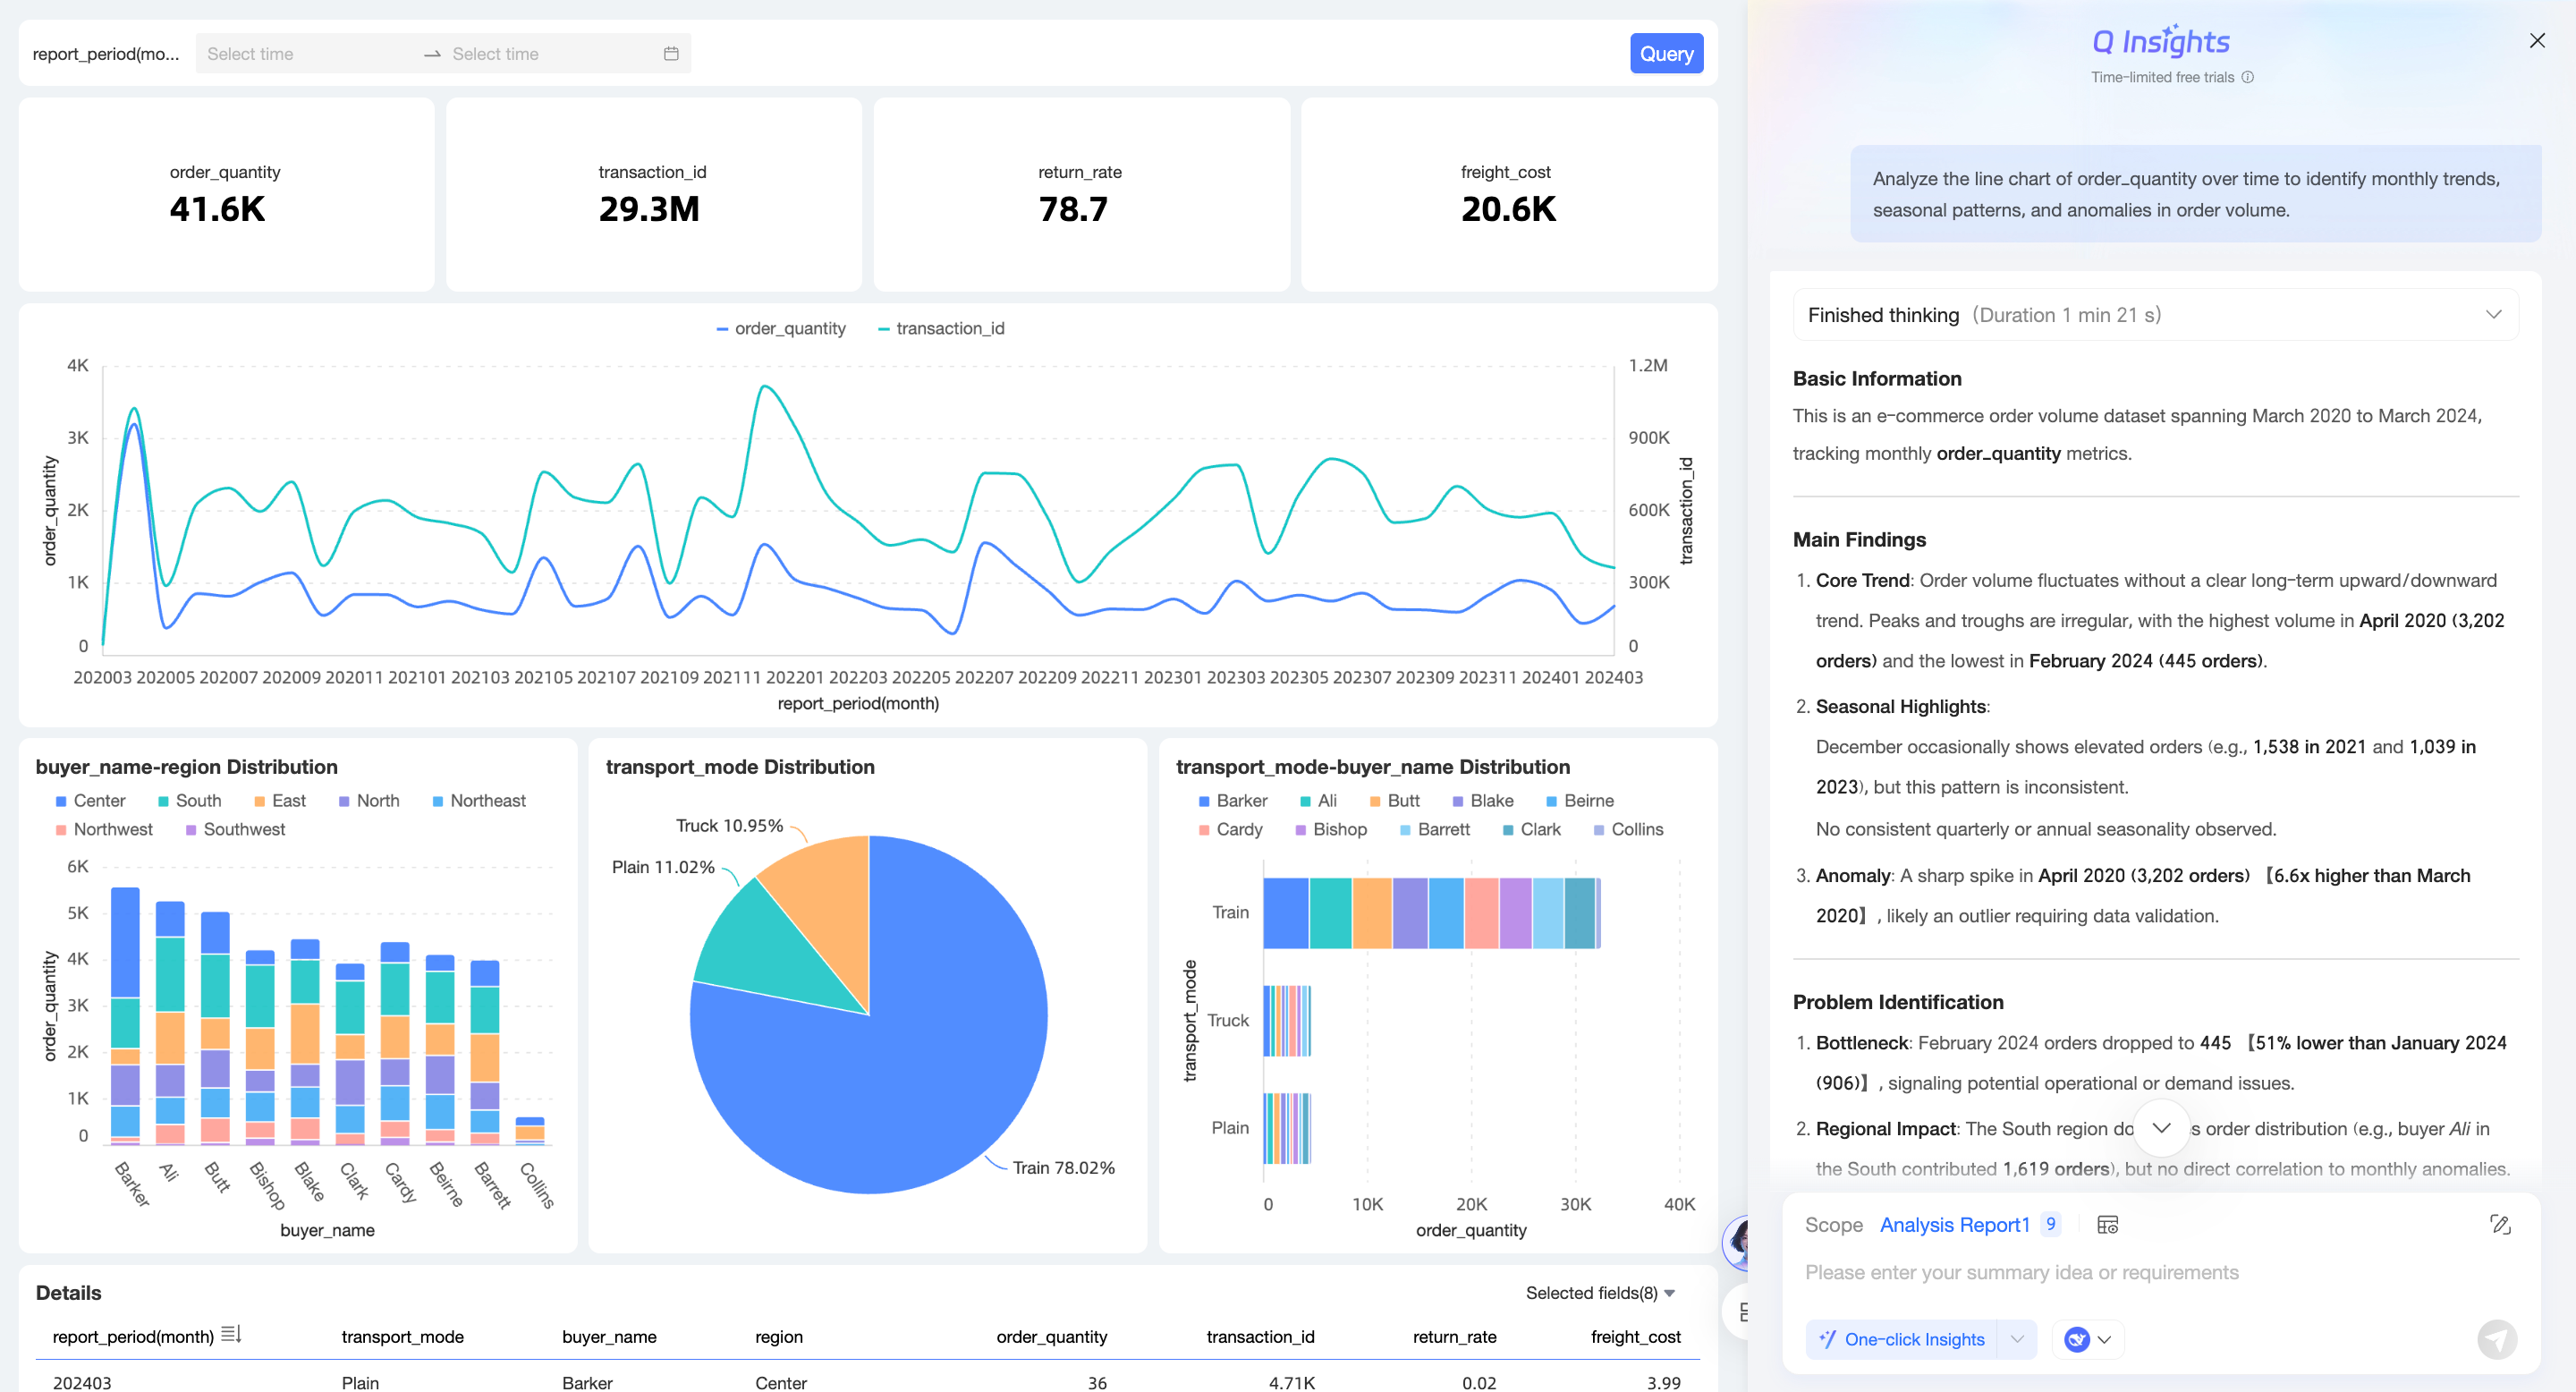
The following example shows the results from a recommended question.
-
Select one of the recommended questions to ask.
-
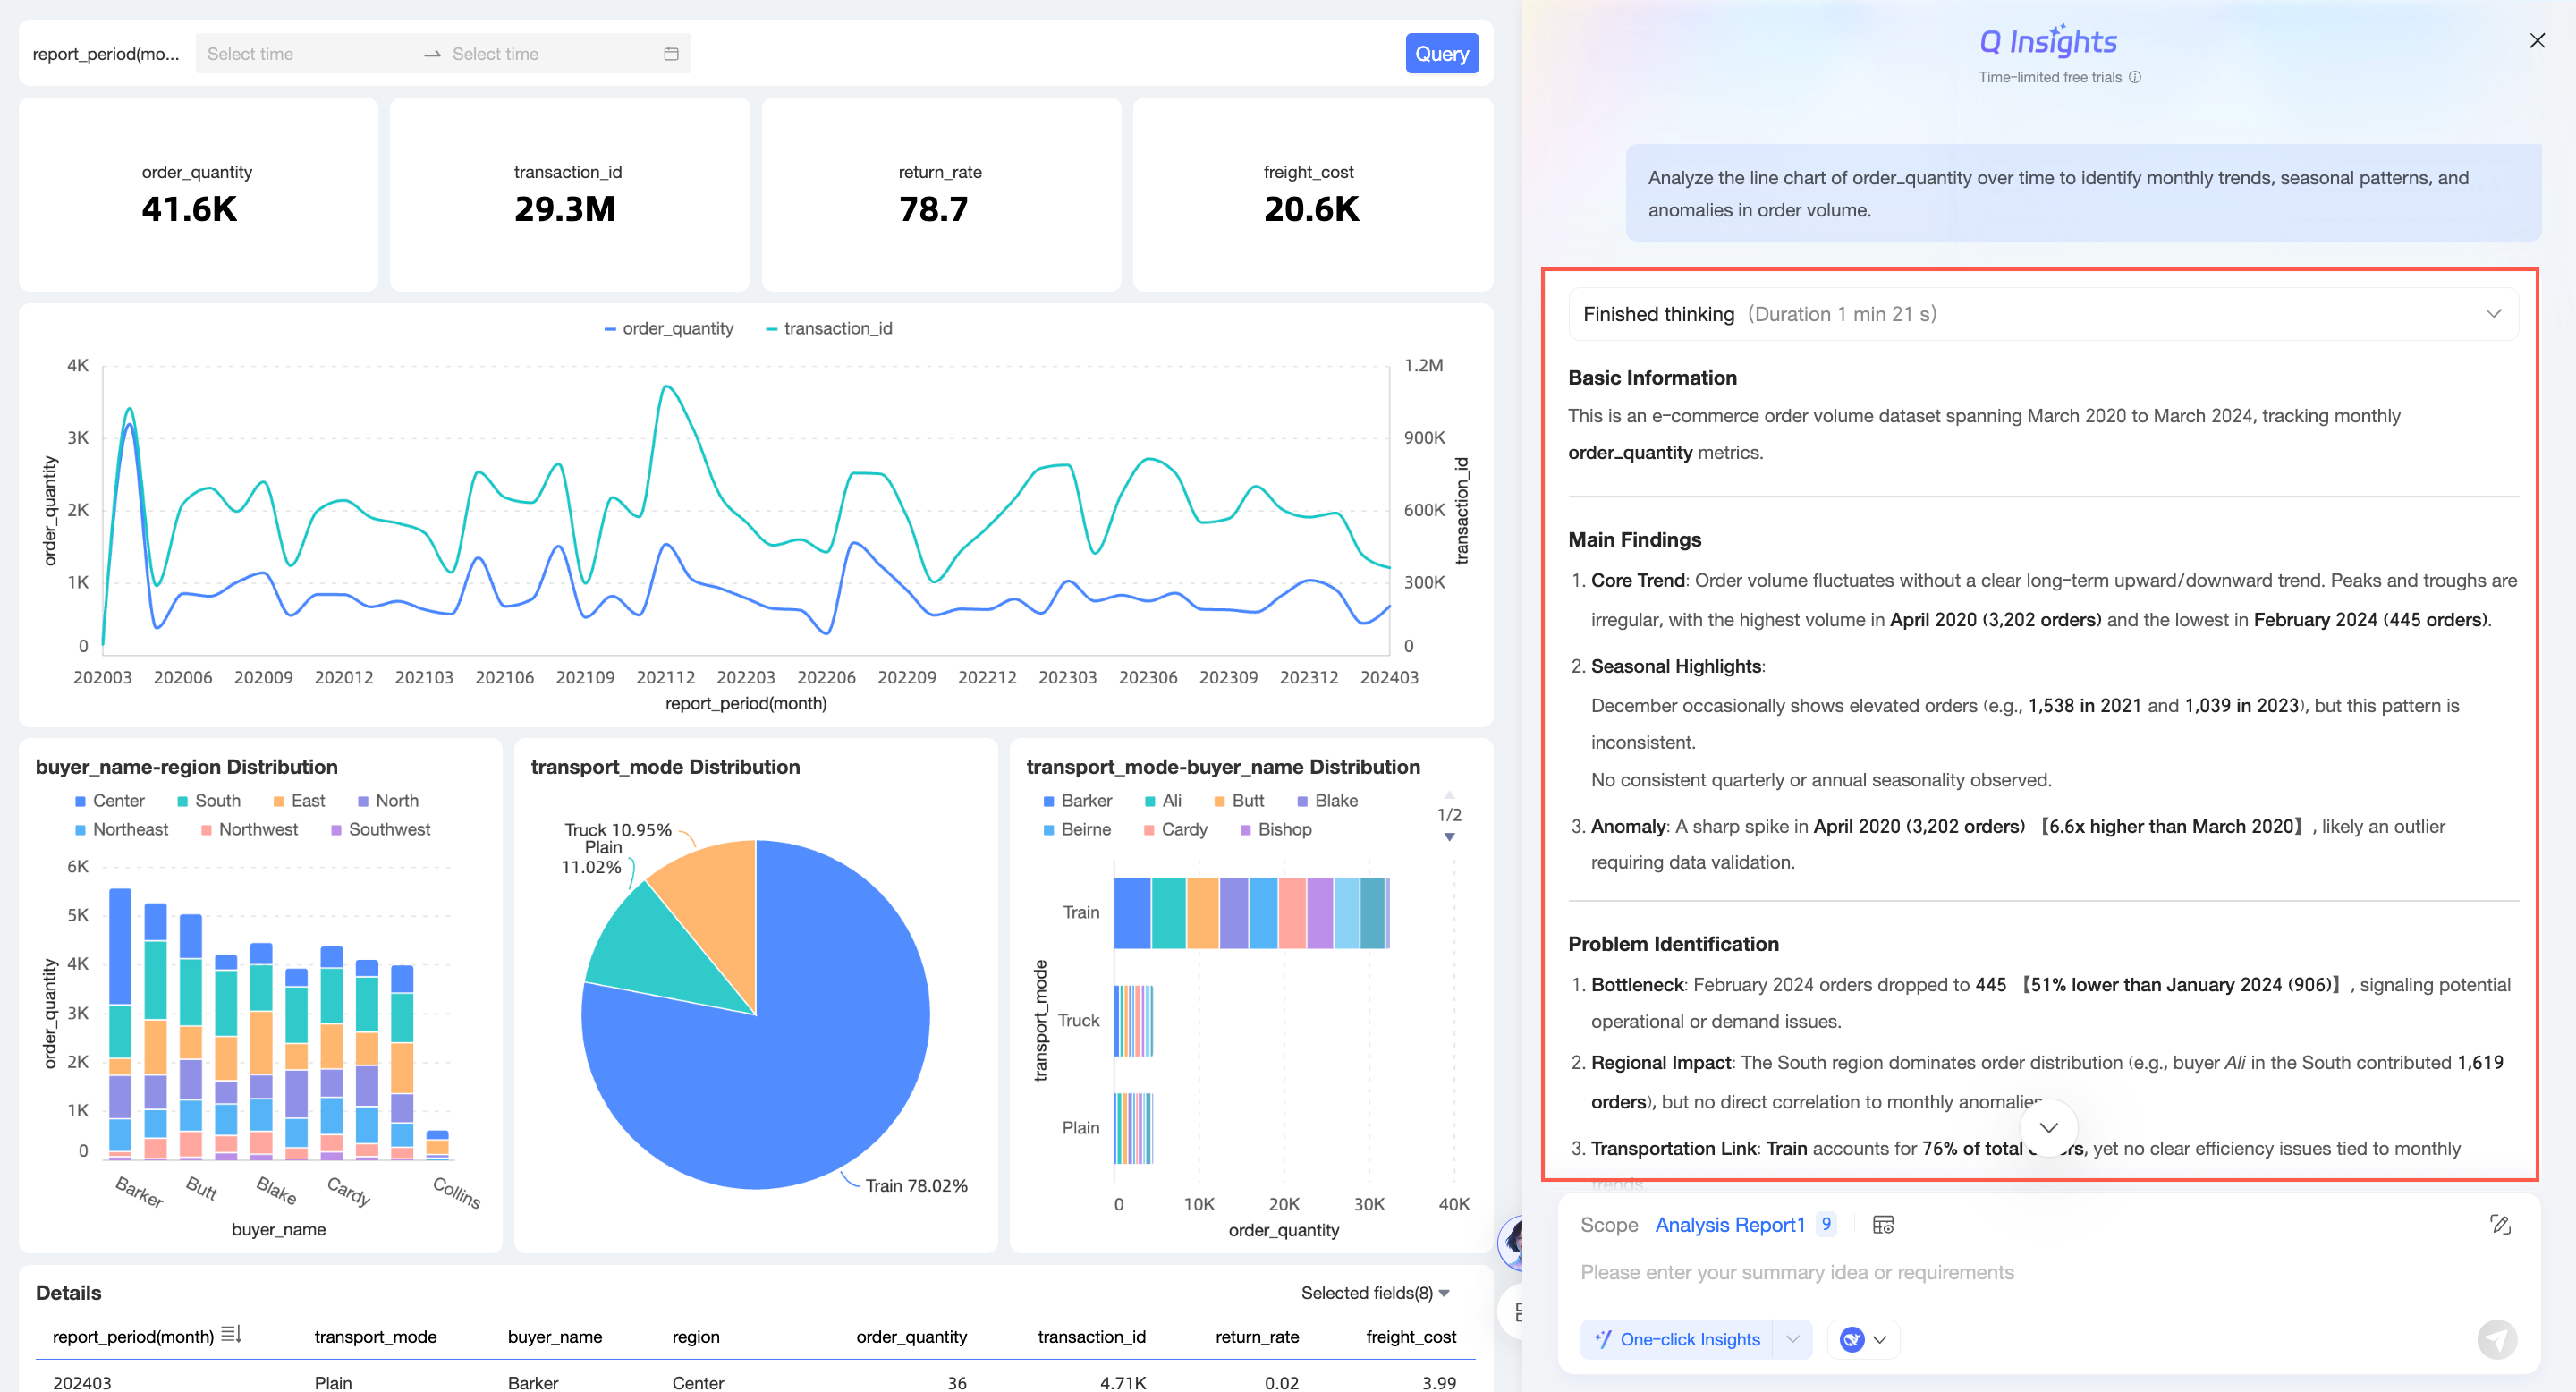
After you click the question, the system returns the interpretation results.
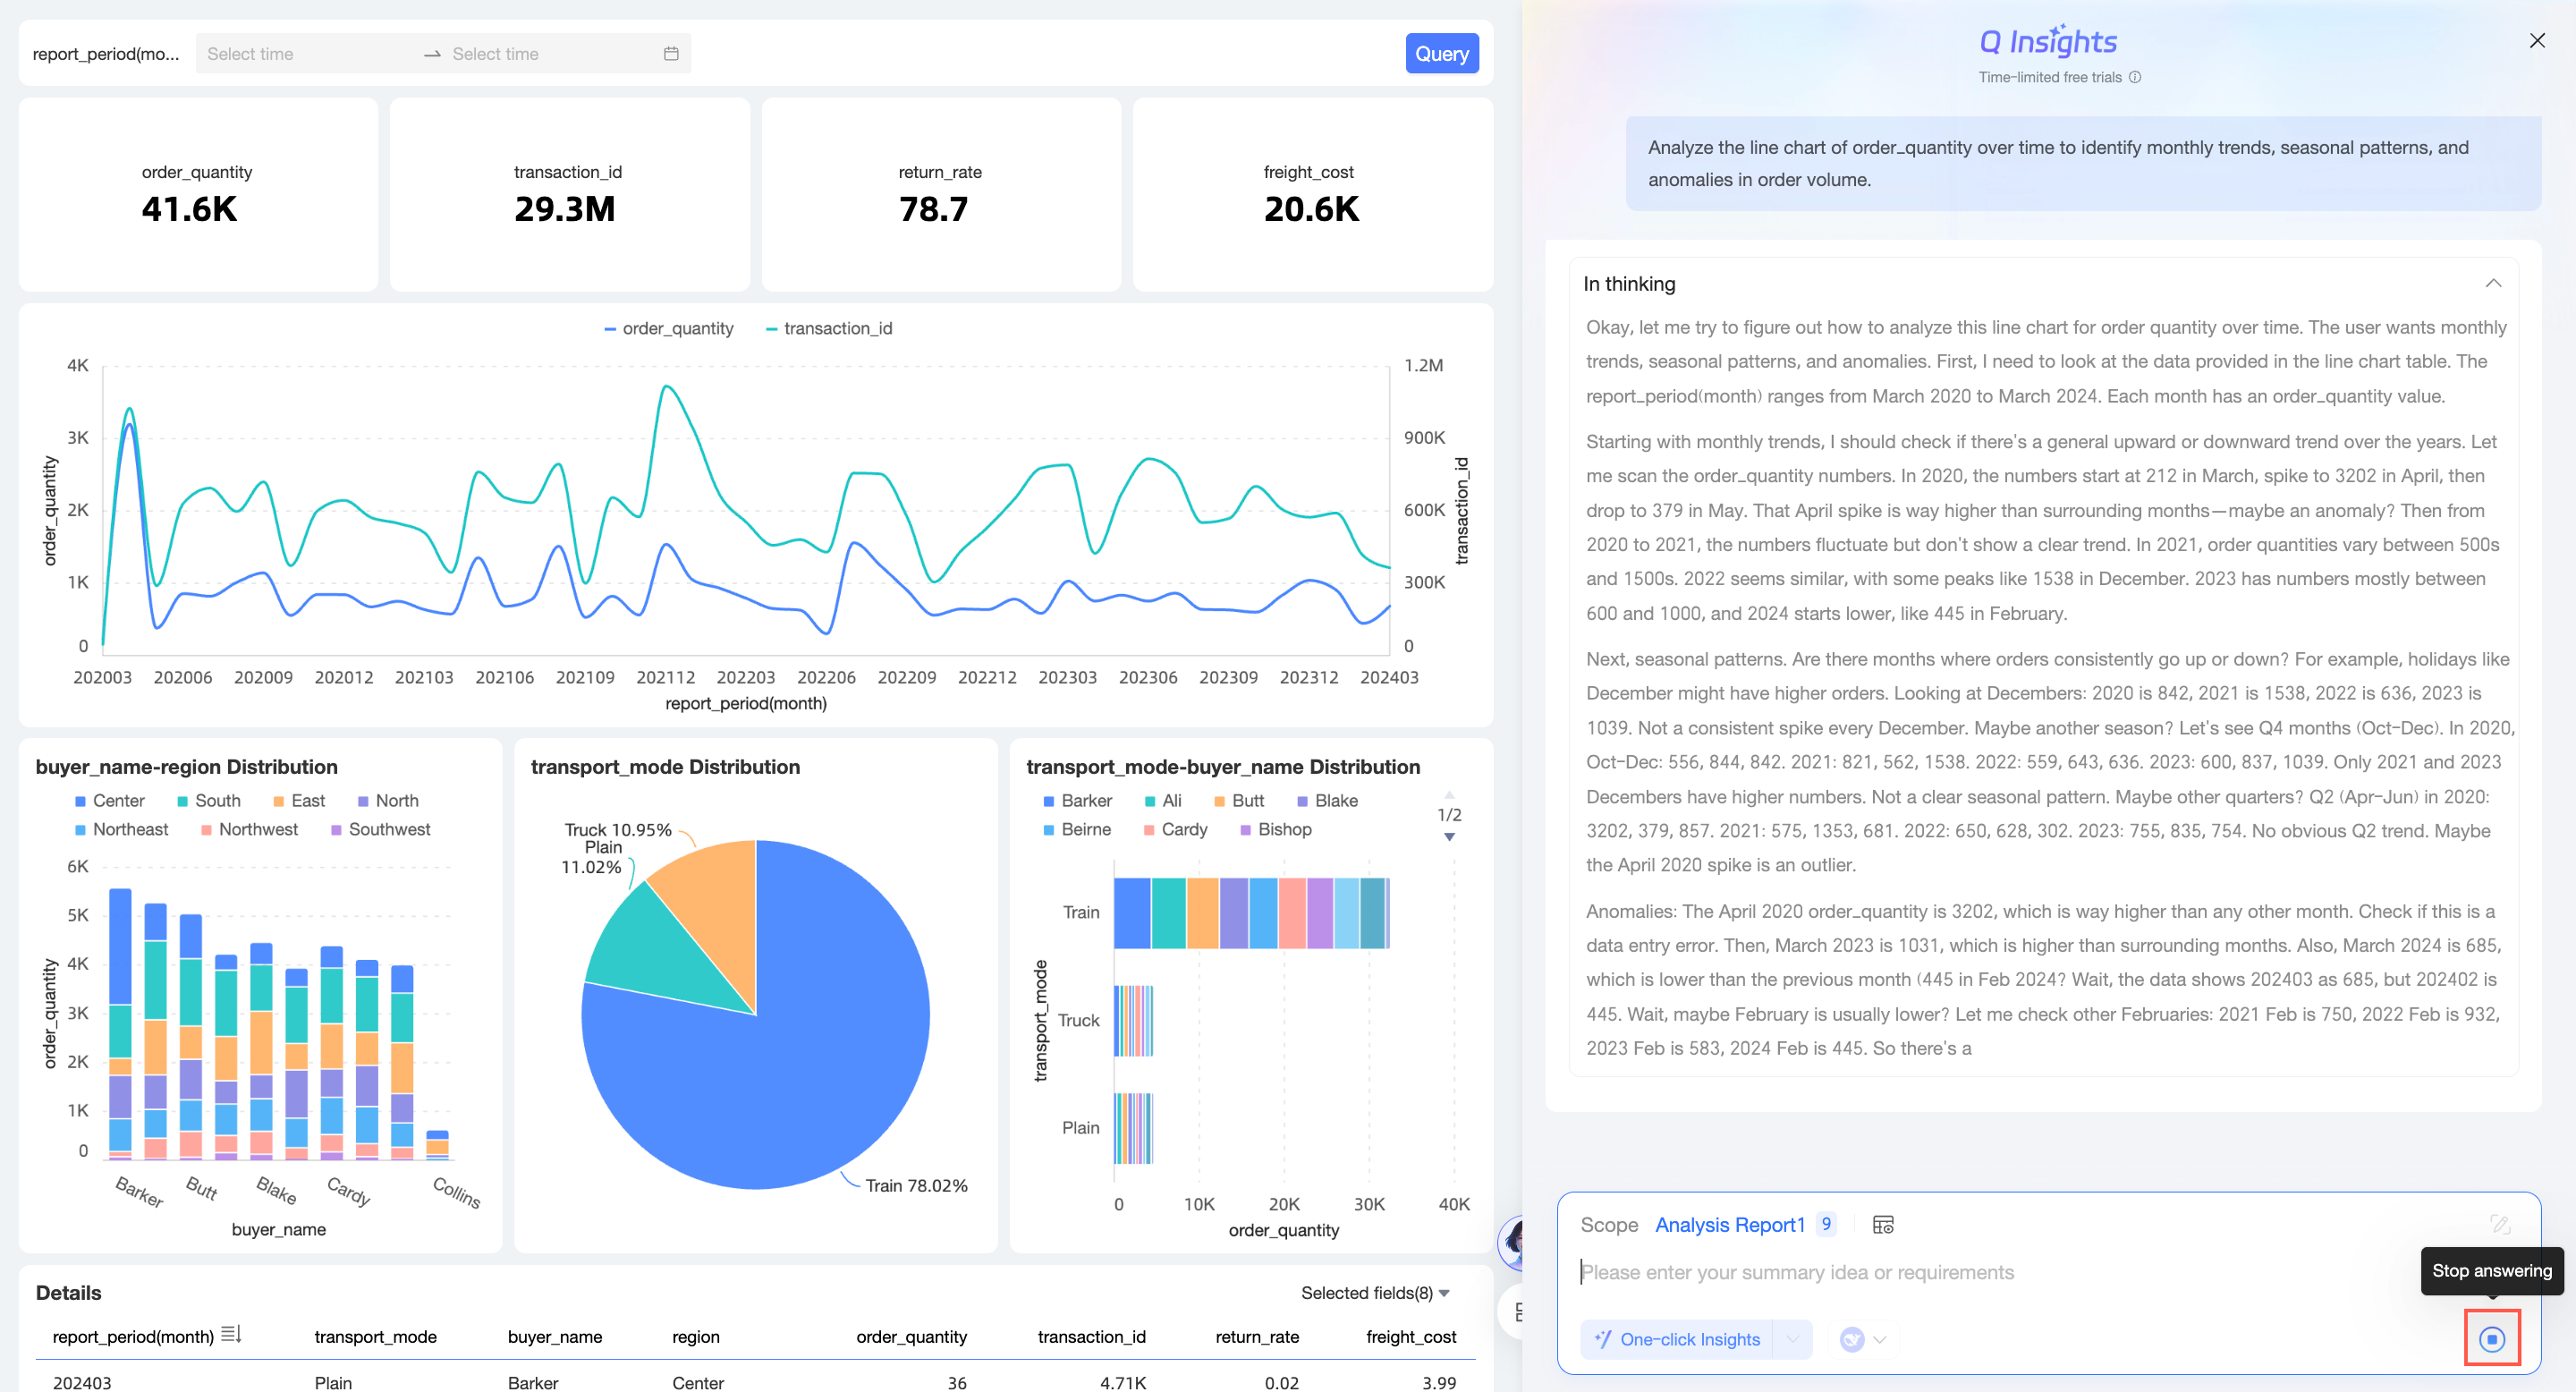
You can click Stop generating while the results are being generated.
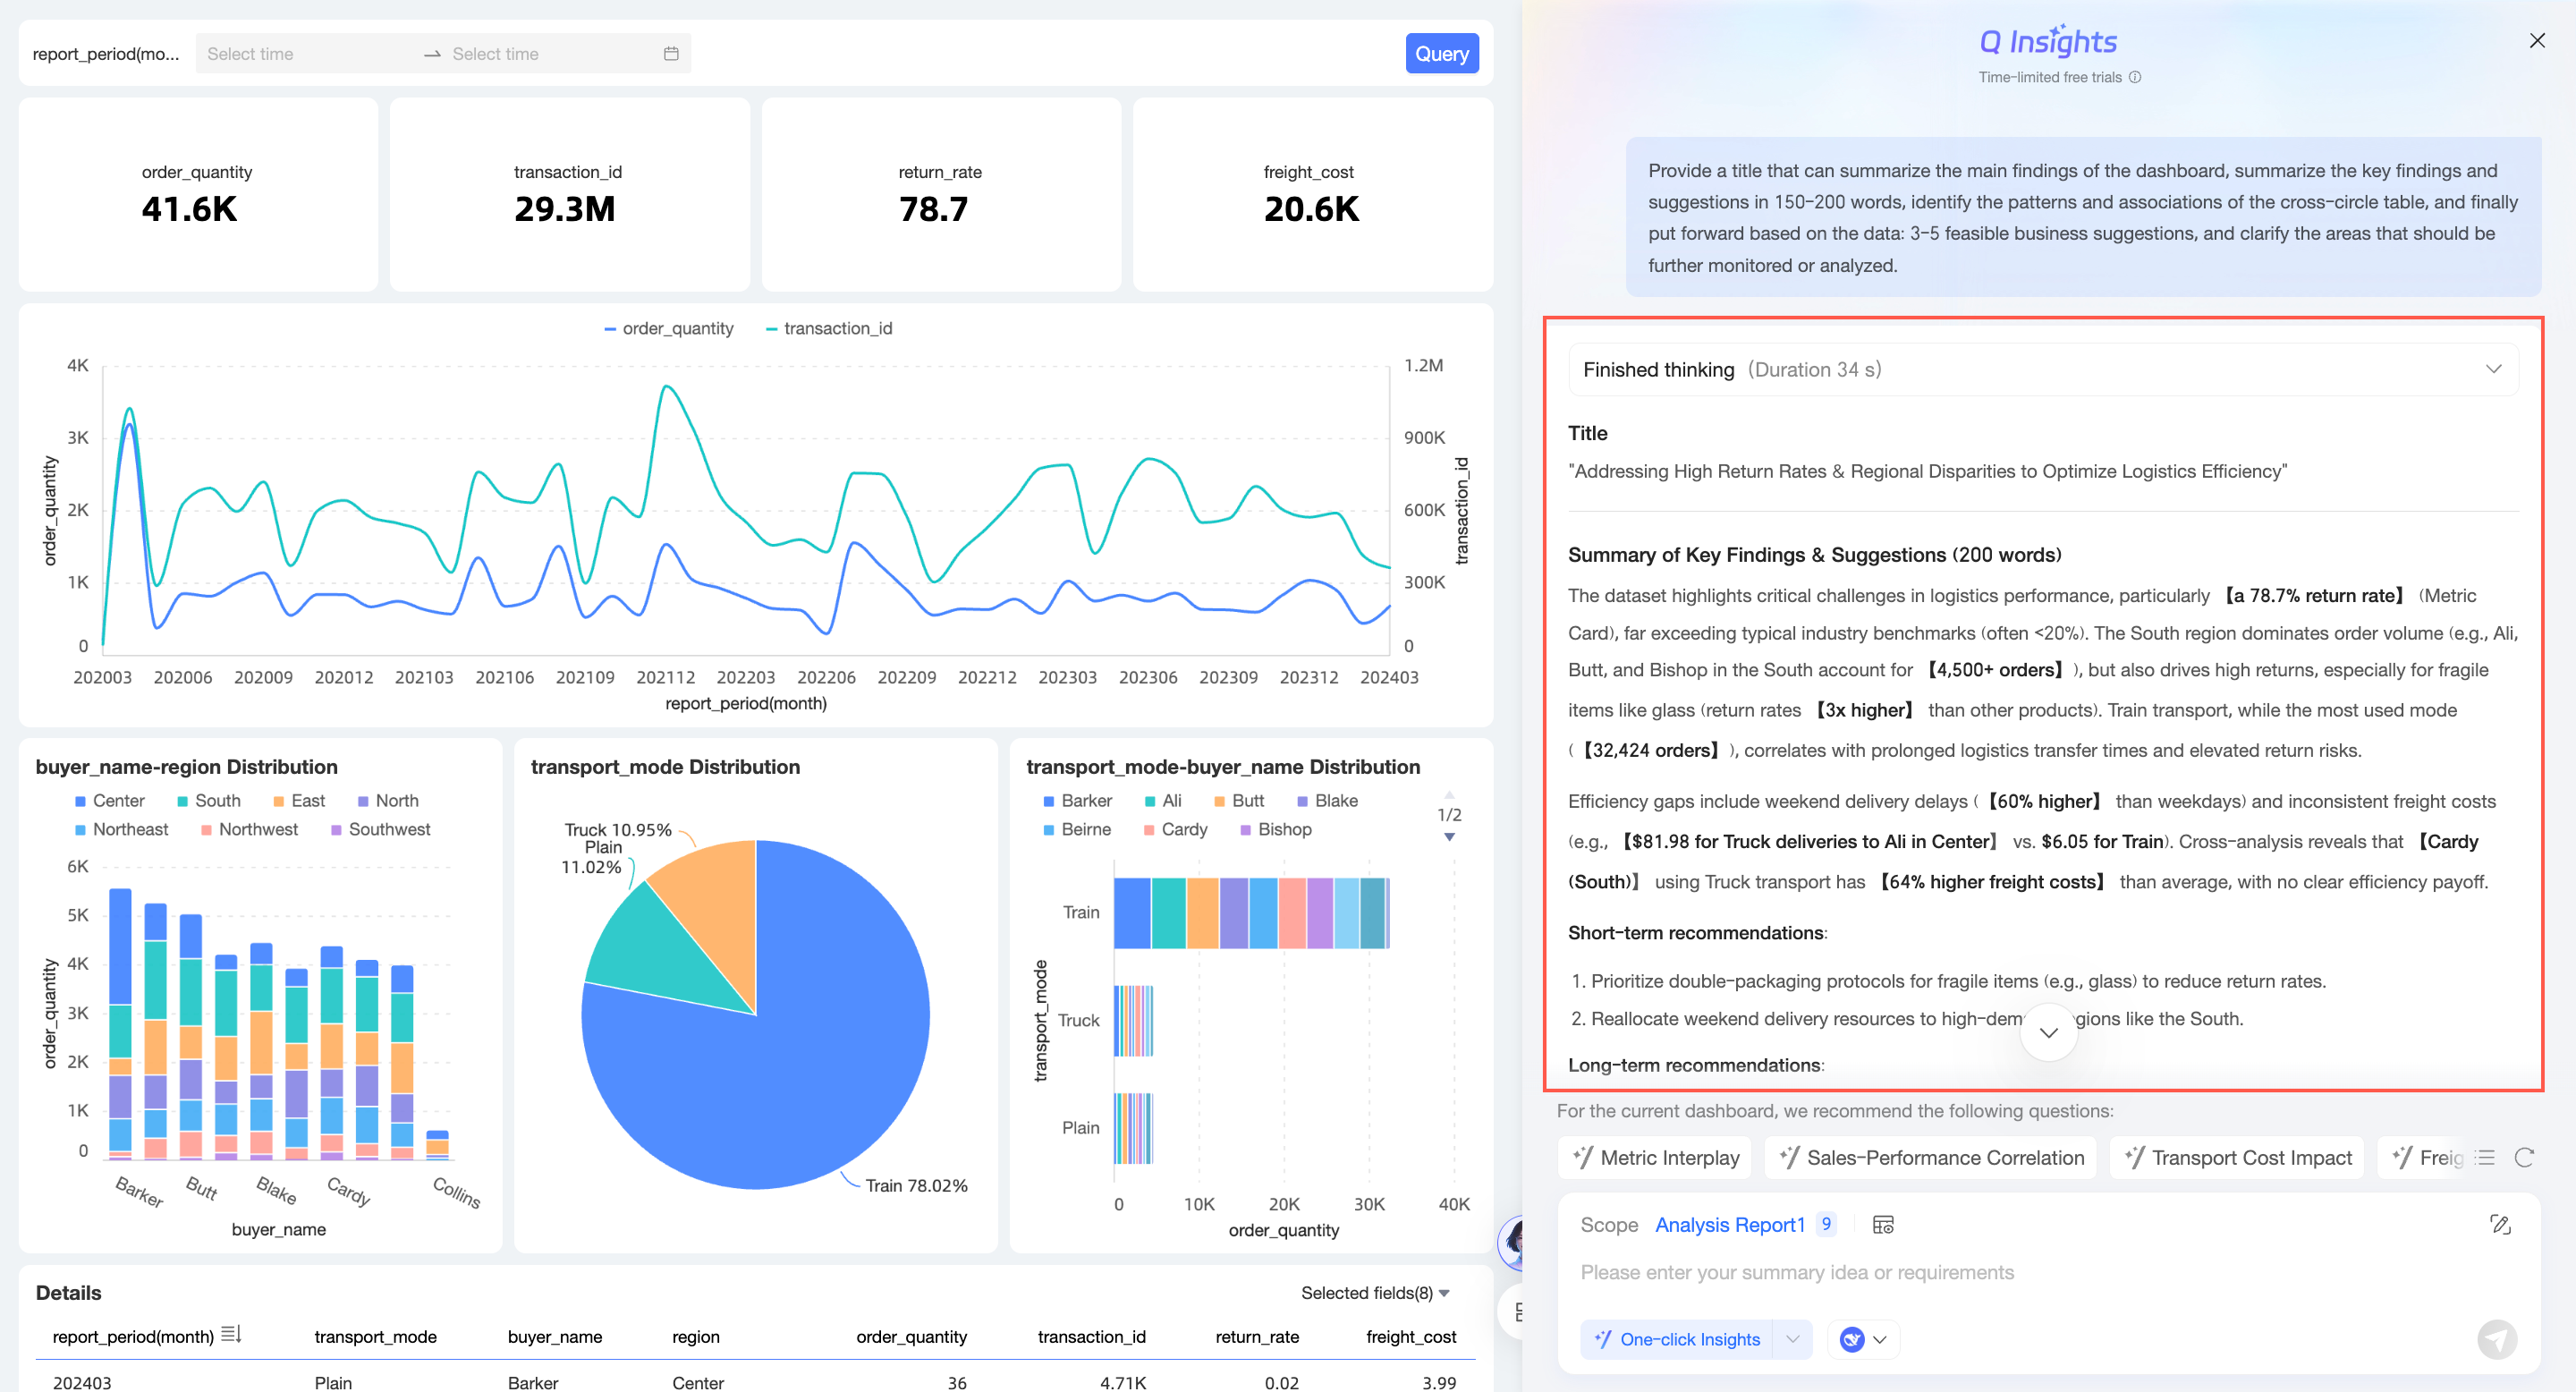
-
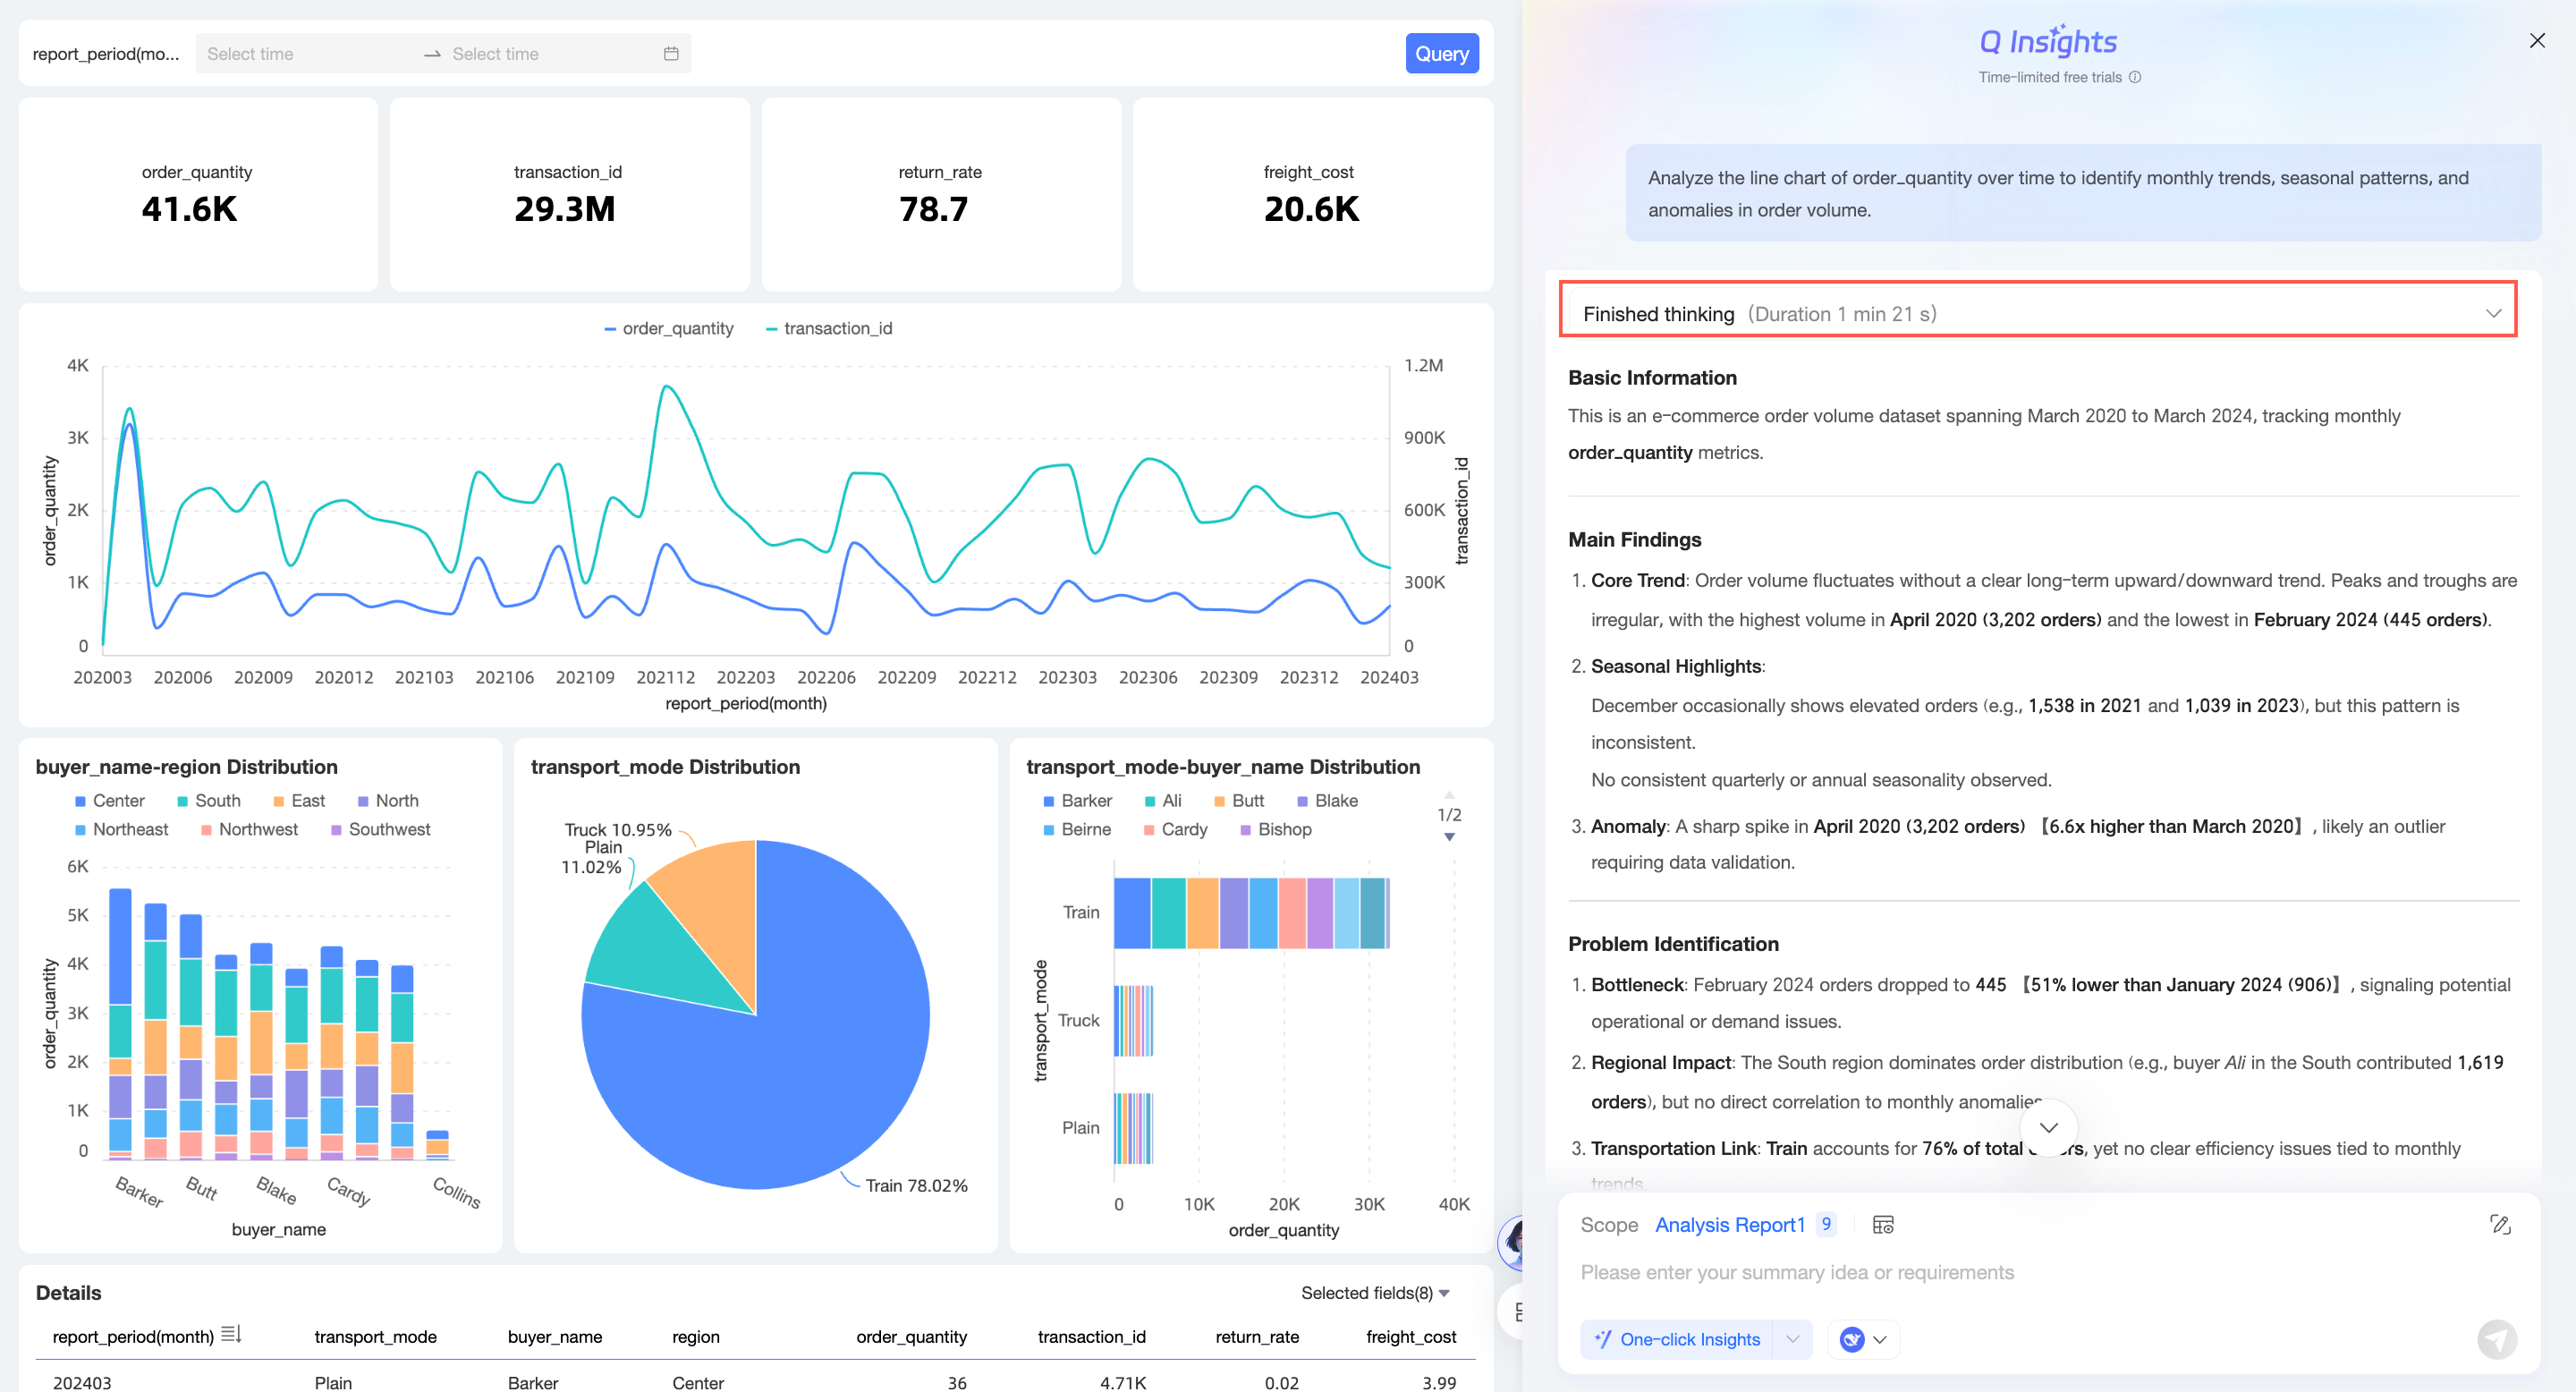
After the model finishes, its reasoning steps are automatically collapsed. You can expand it manually.
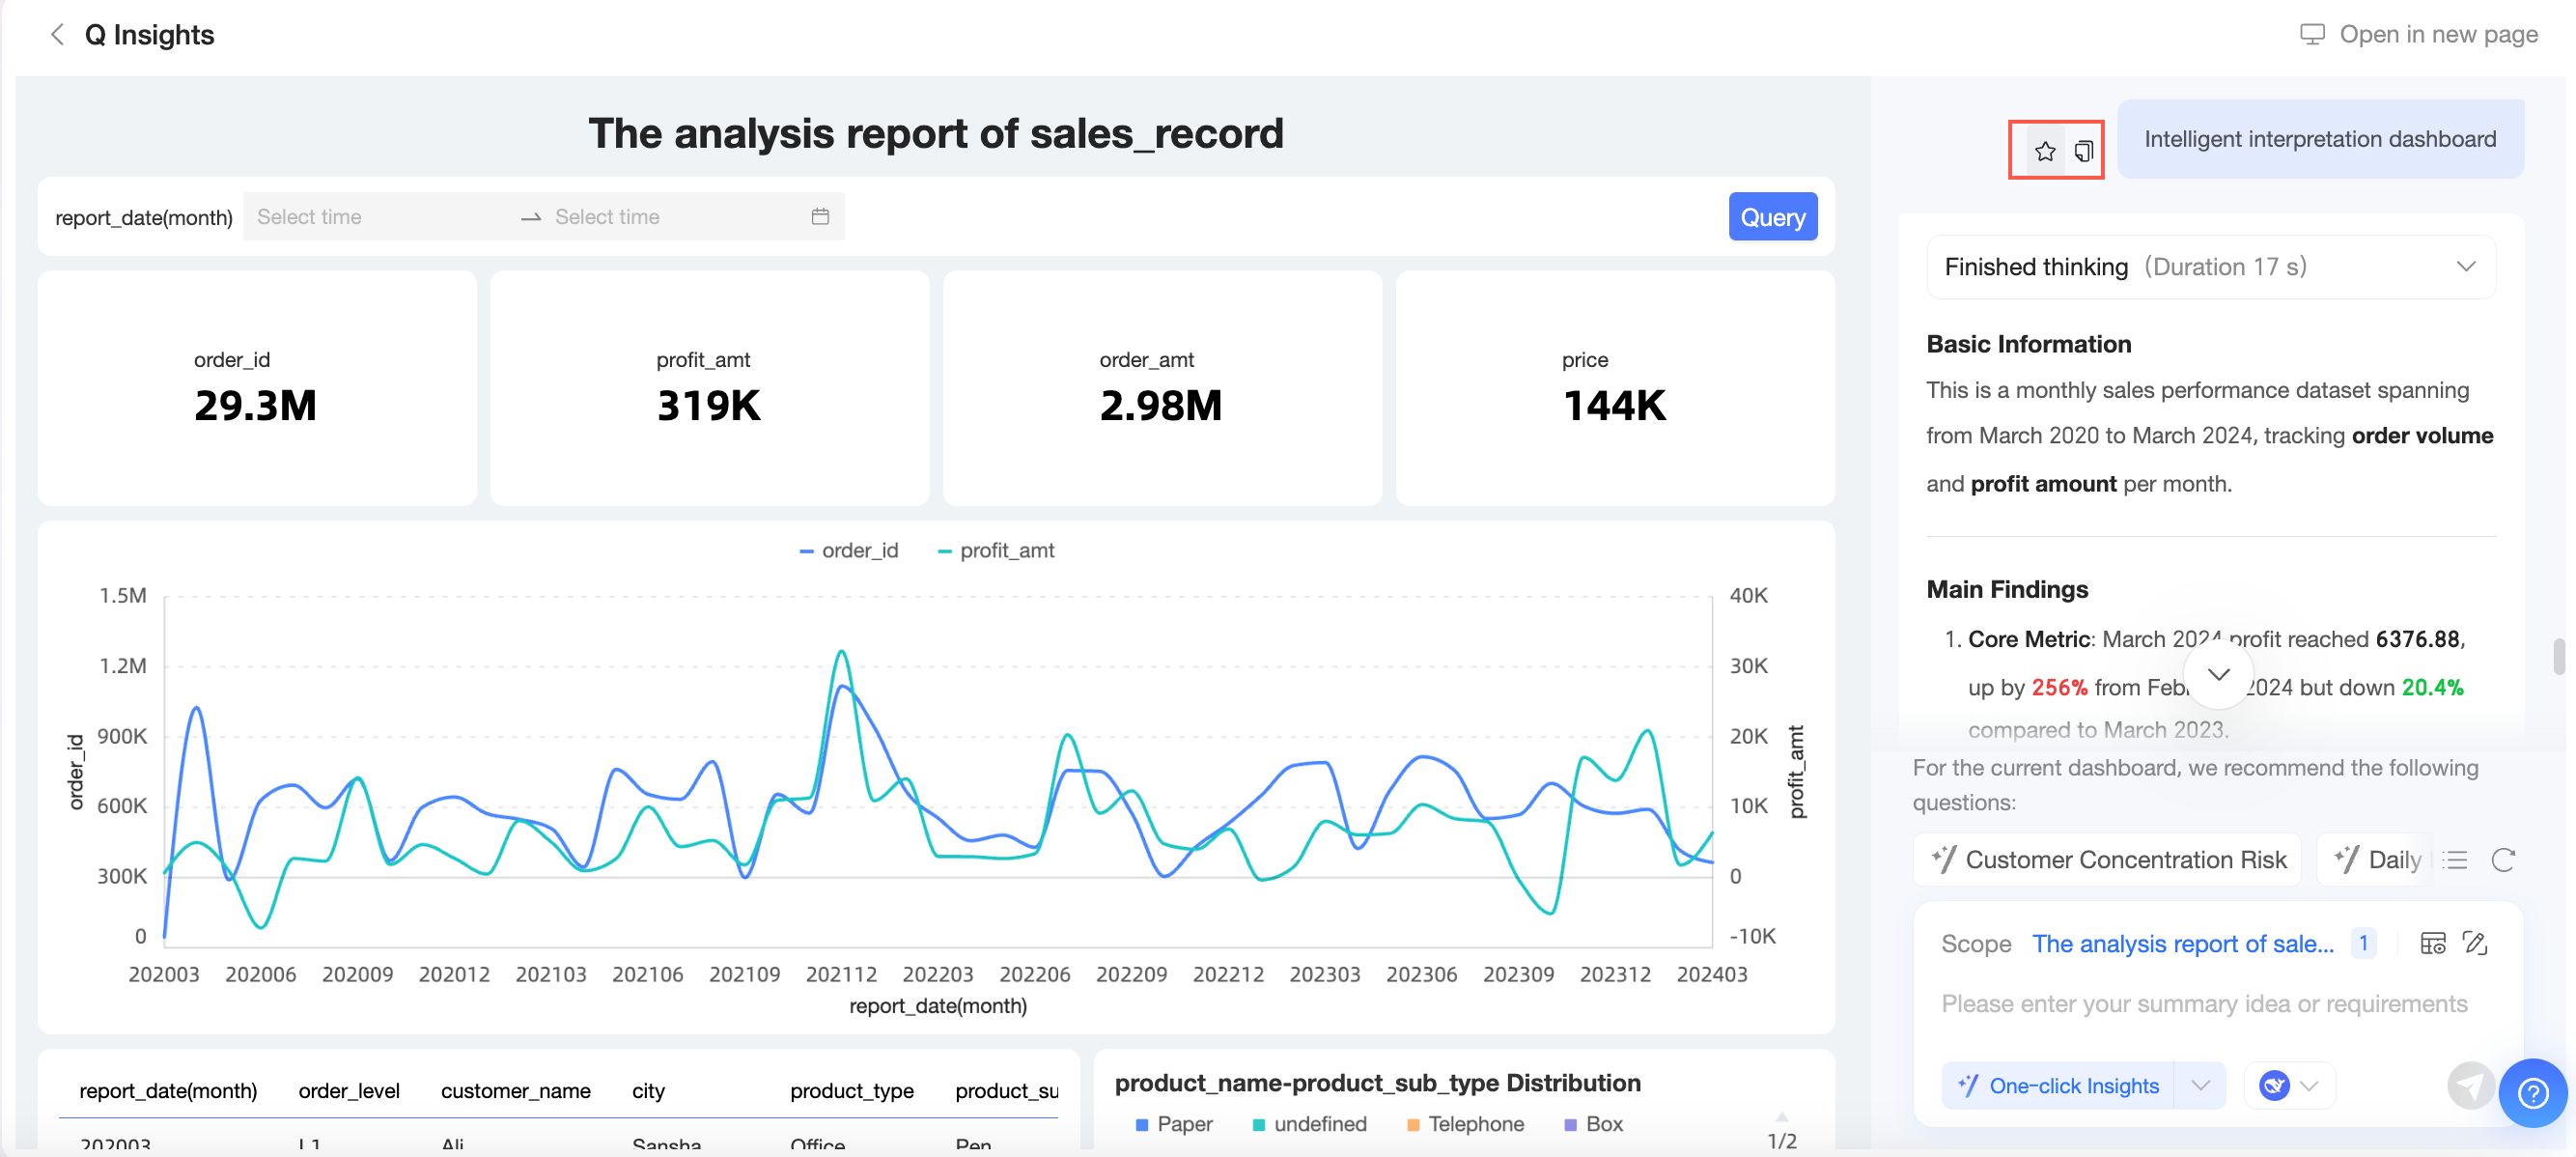
Favorite and copy questions
-
Favorite a question
NoteYou can favorite a maximum of 10 questions.
-
Click the
 icon to the left of a question to favorite the analysis approach.
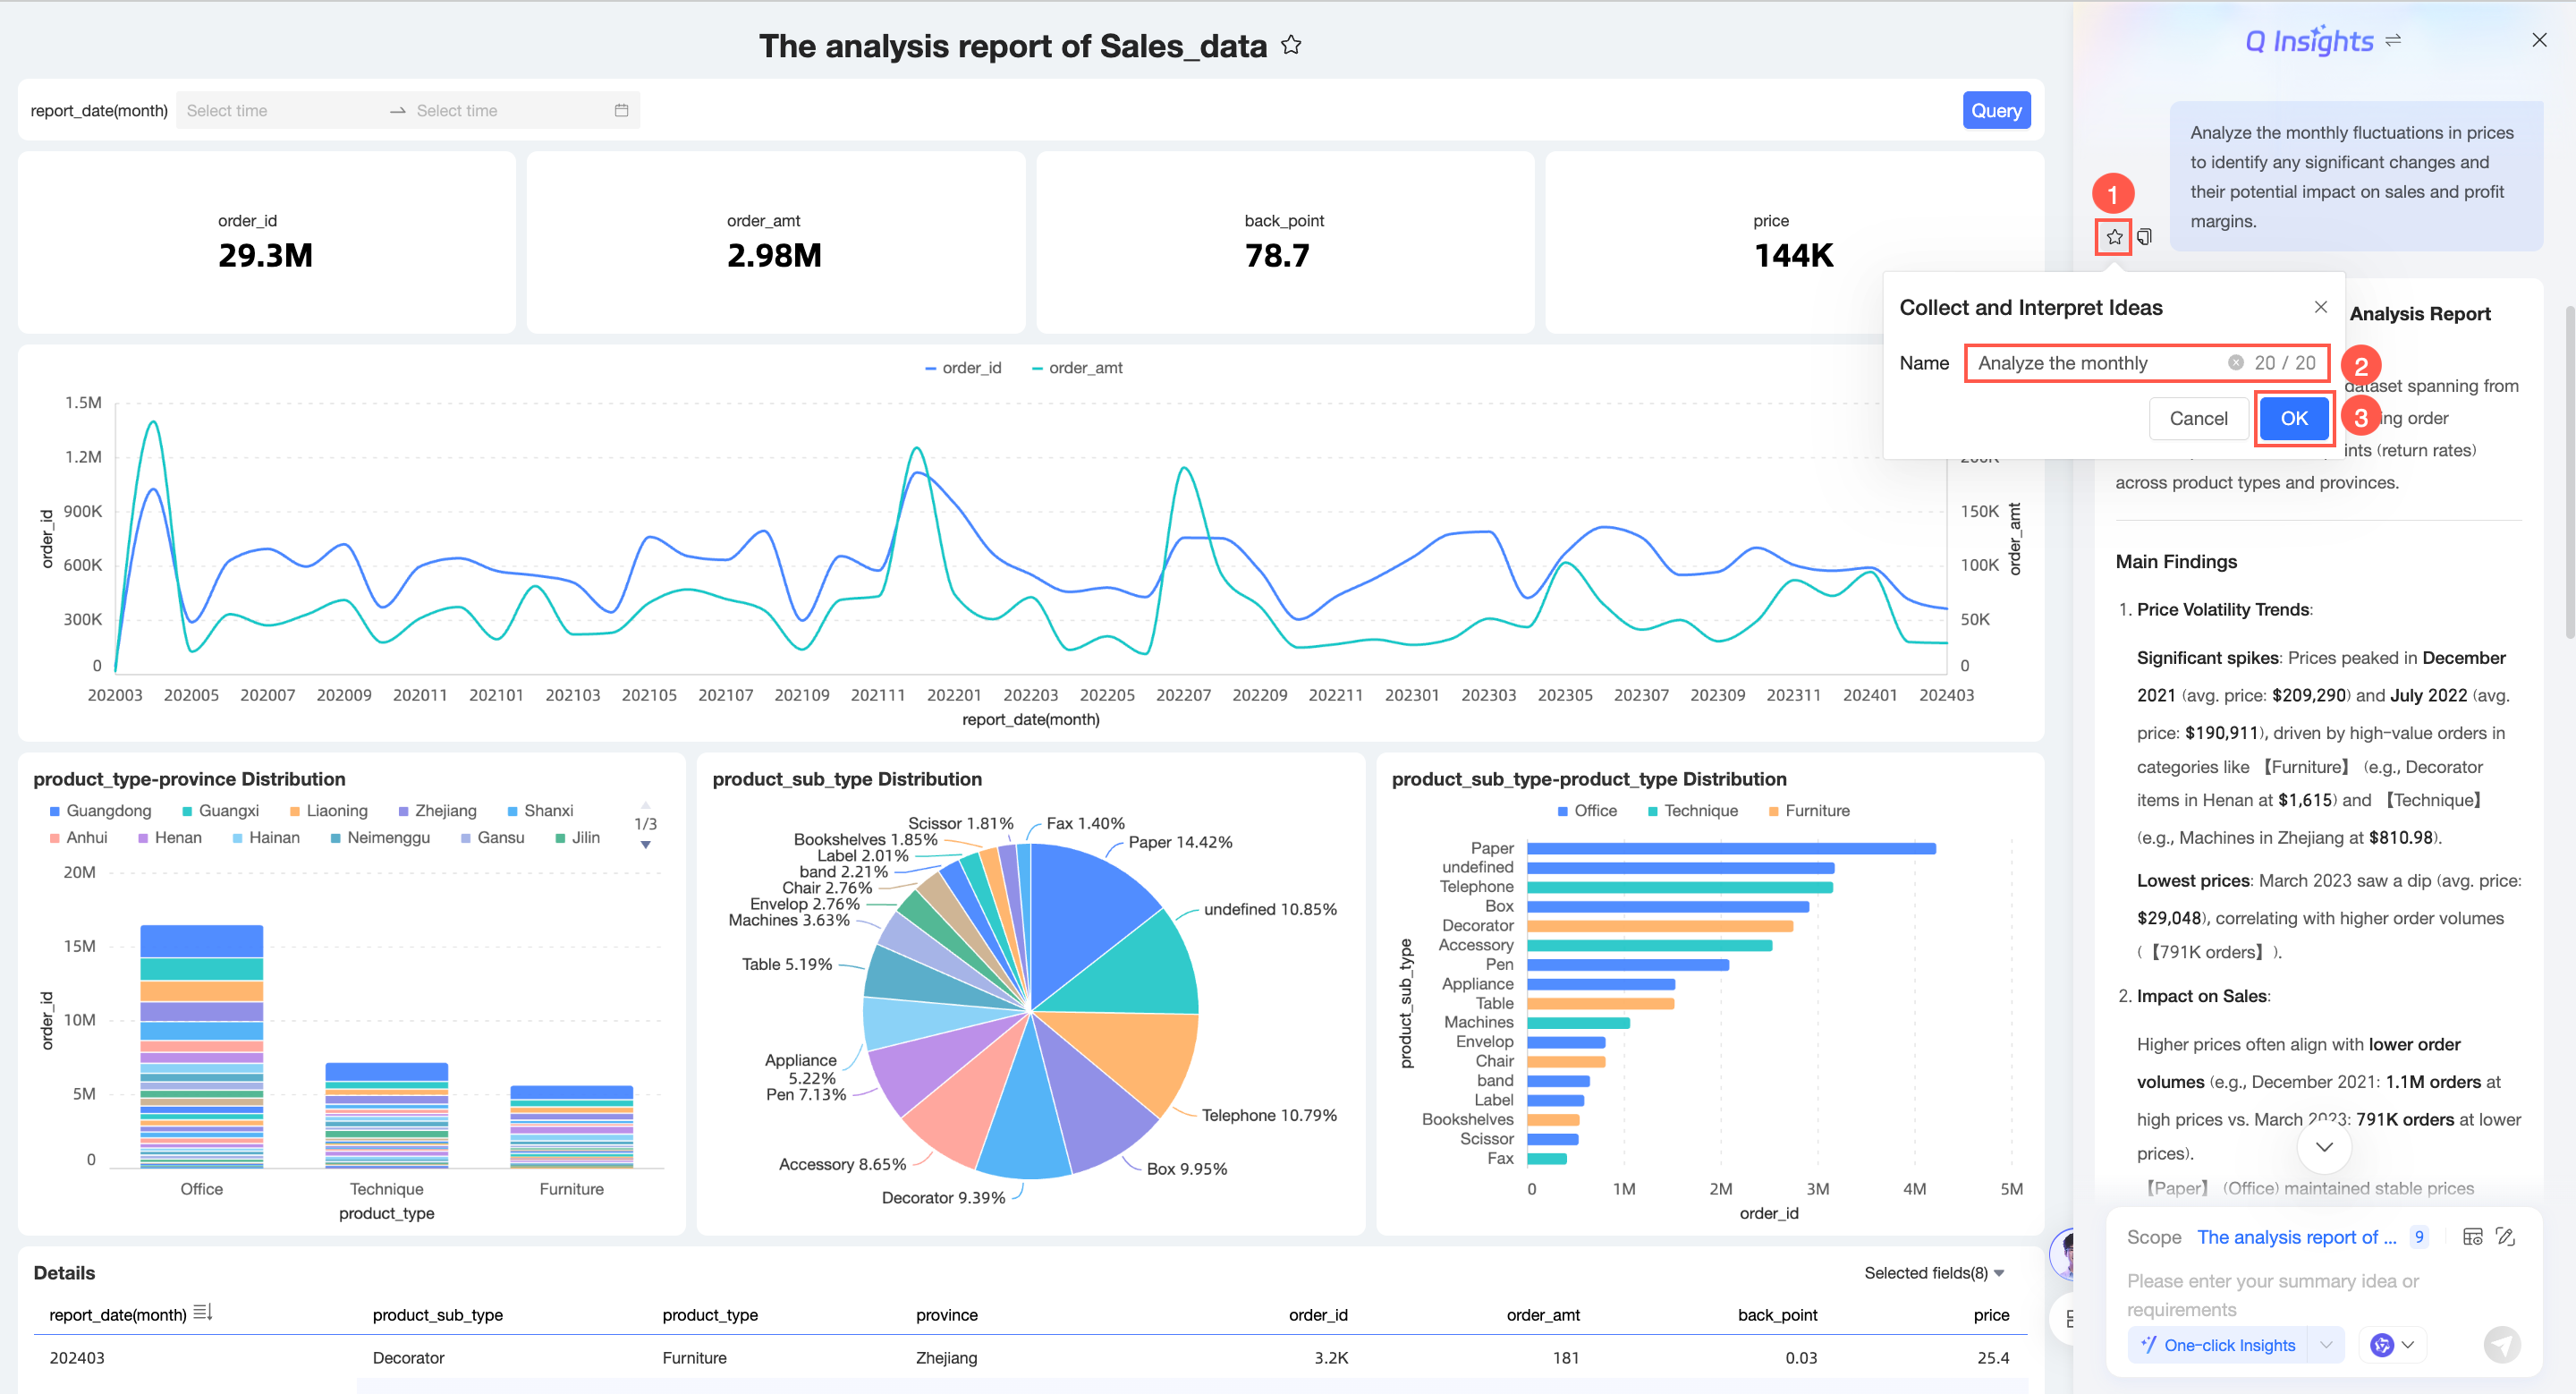
-
After you favorite a question, you can access it from Quick Questions.
-
Click the
 icon again to unfavorite the question.
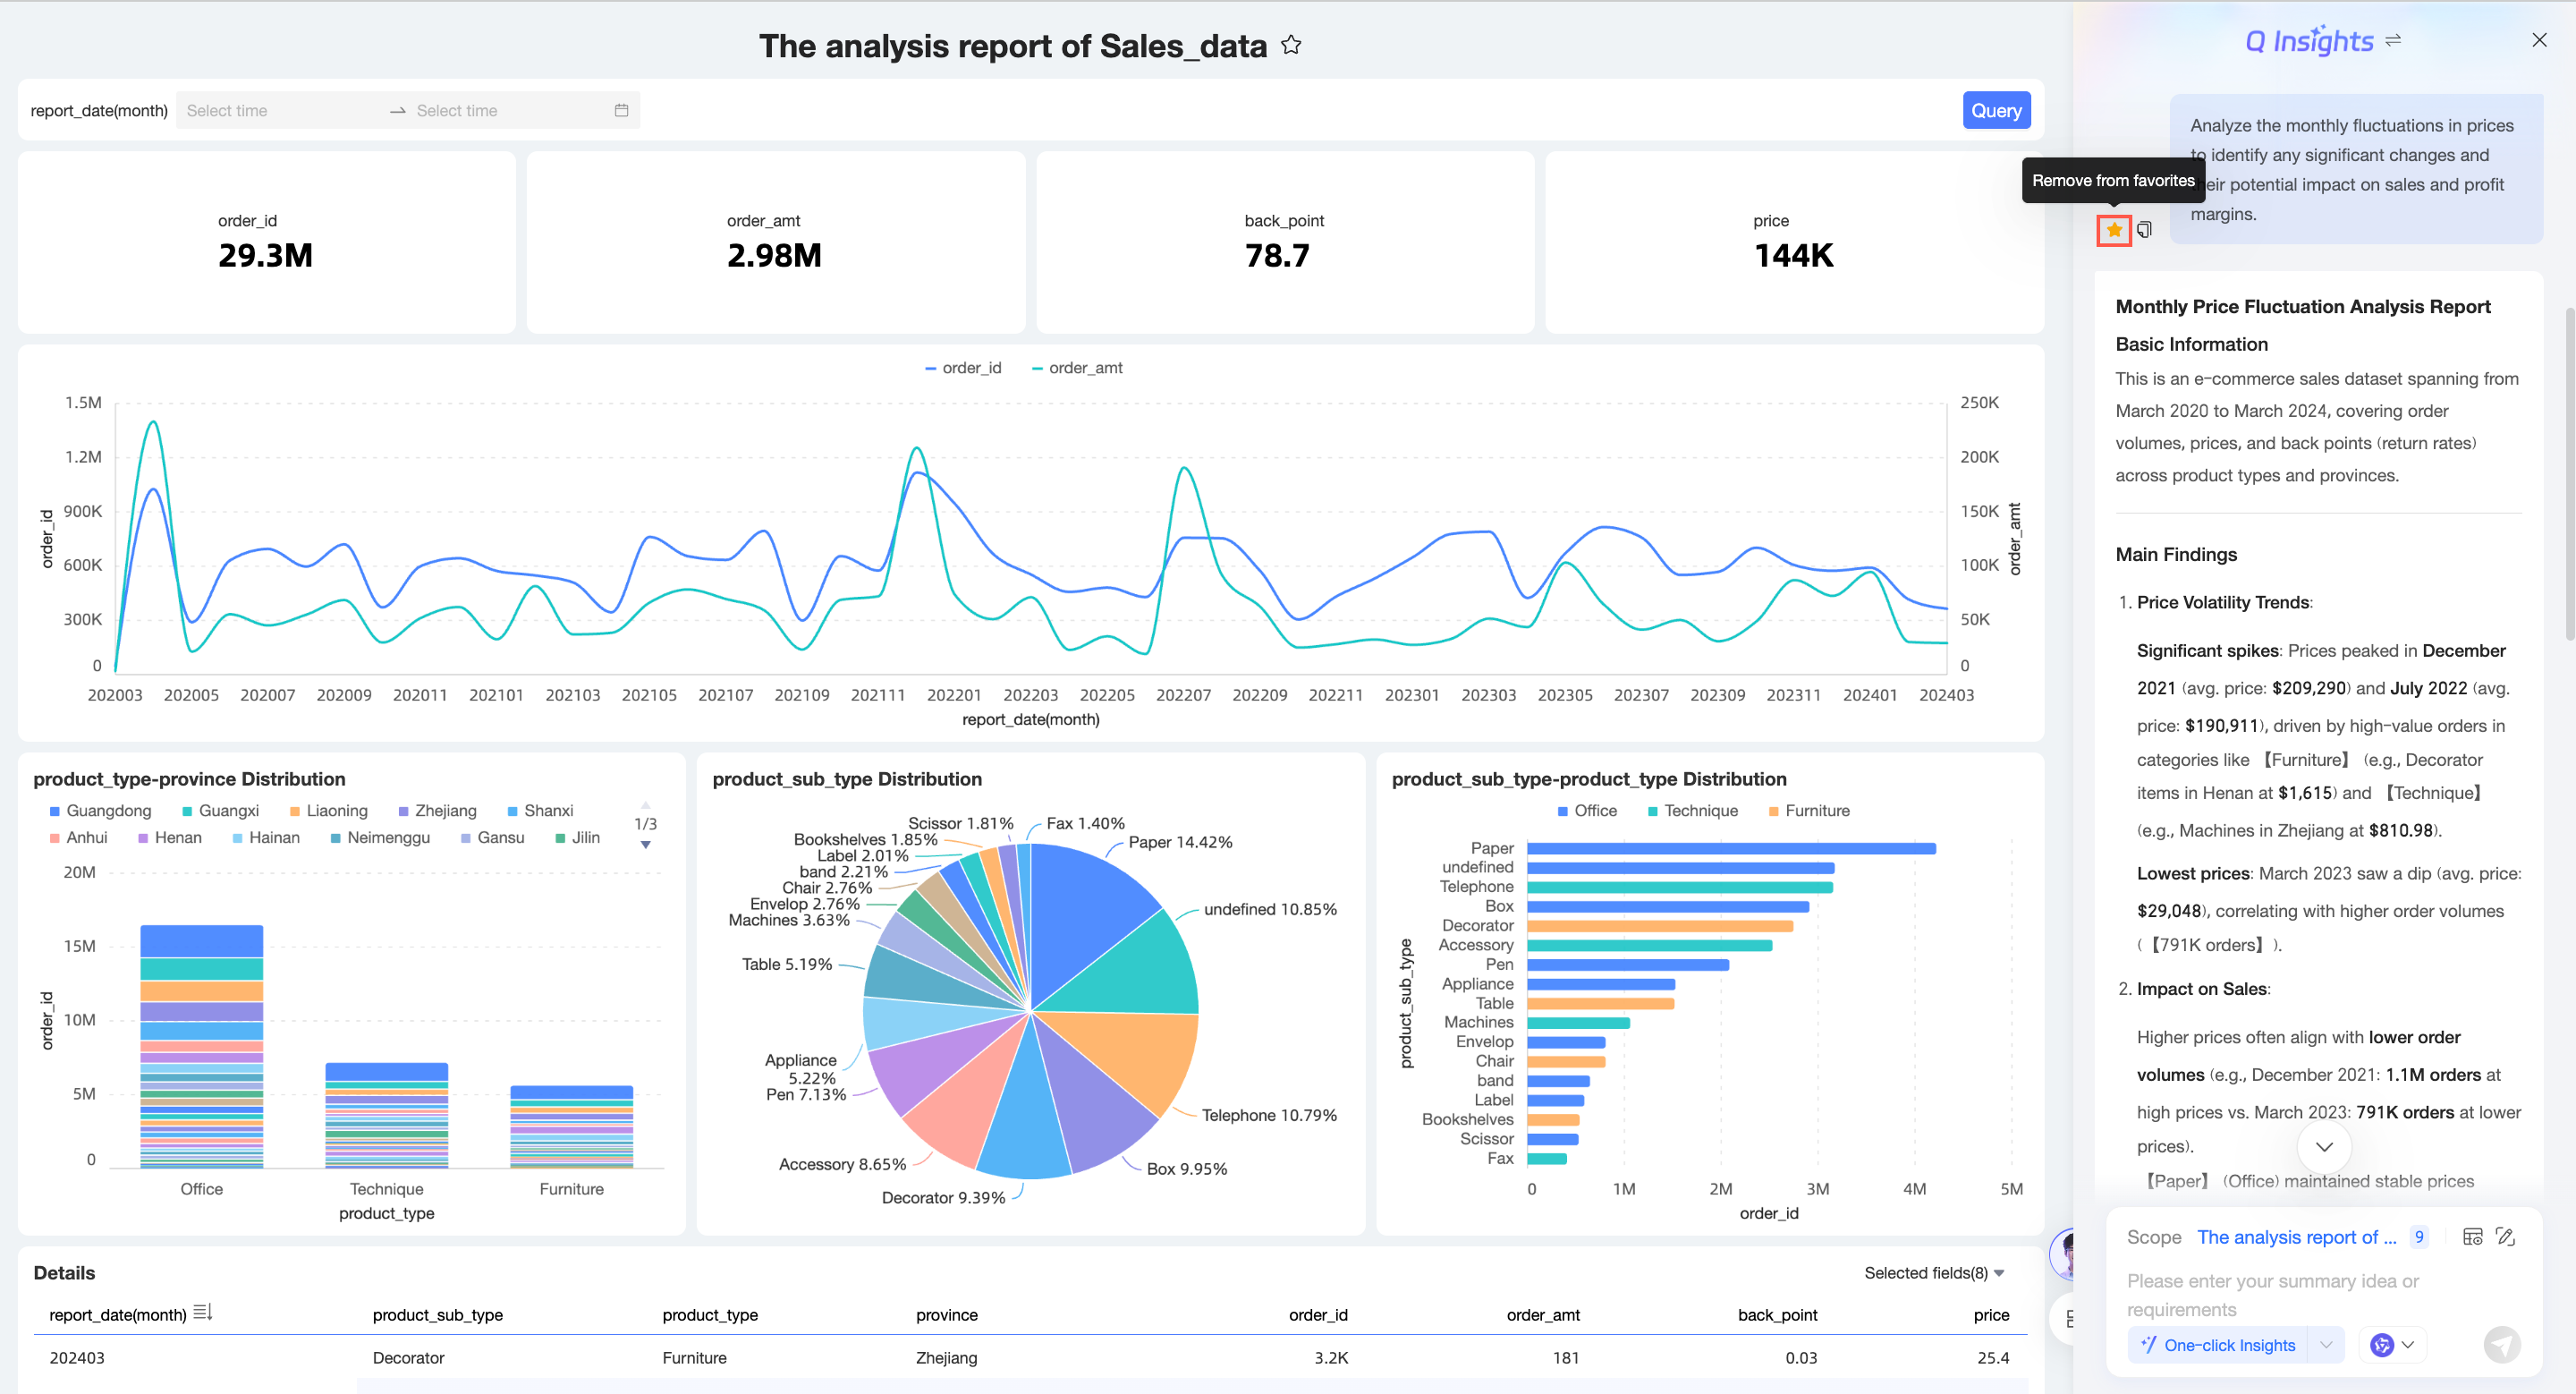
-
-
Copy a question
Click the
 icon to the left of a question to copy the question.
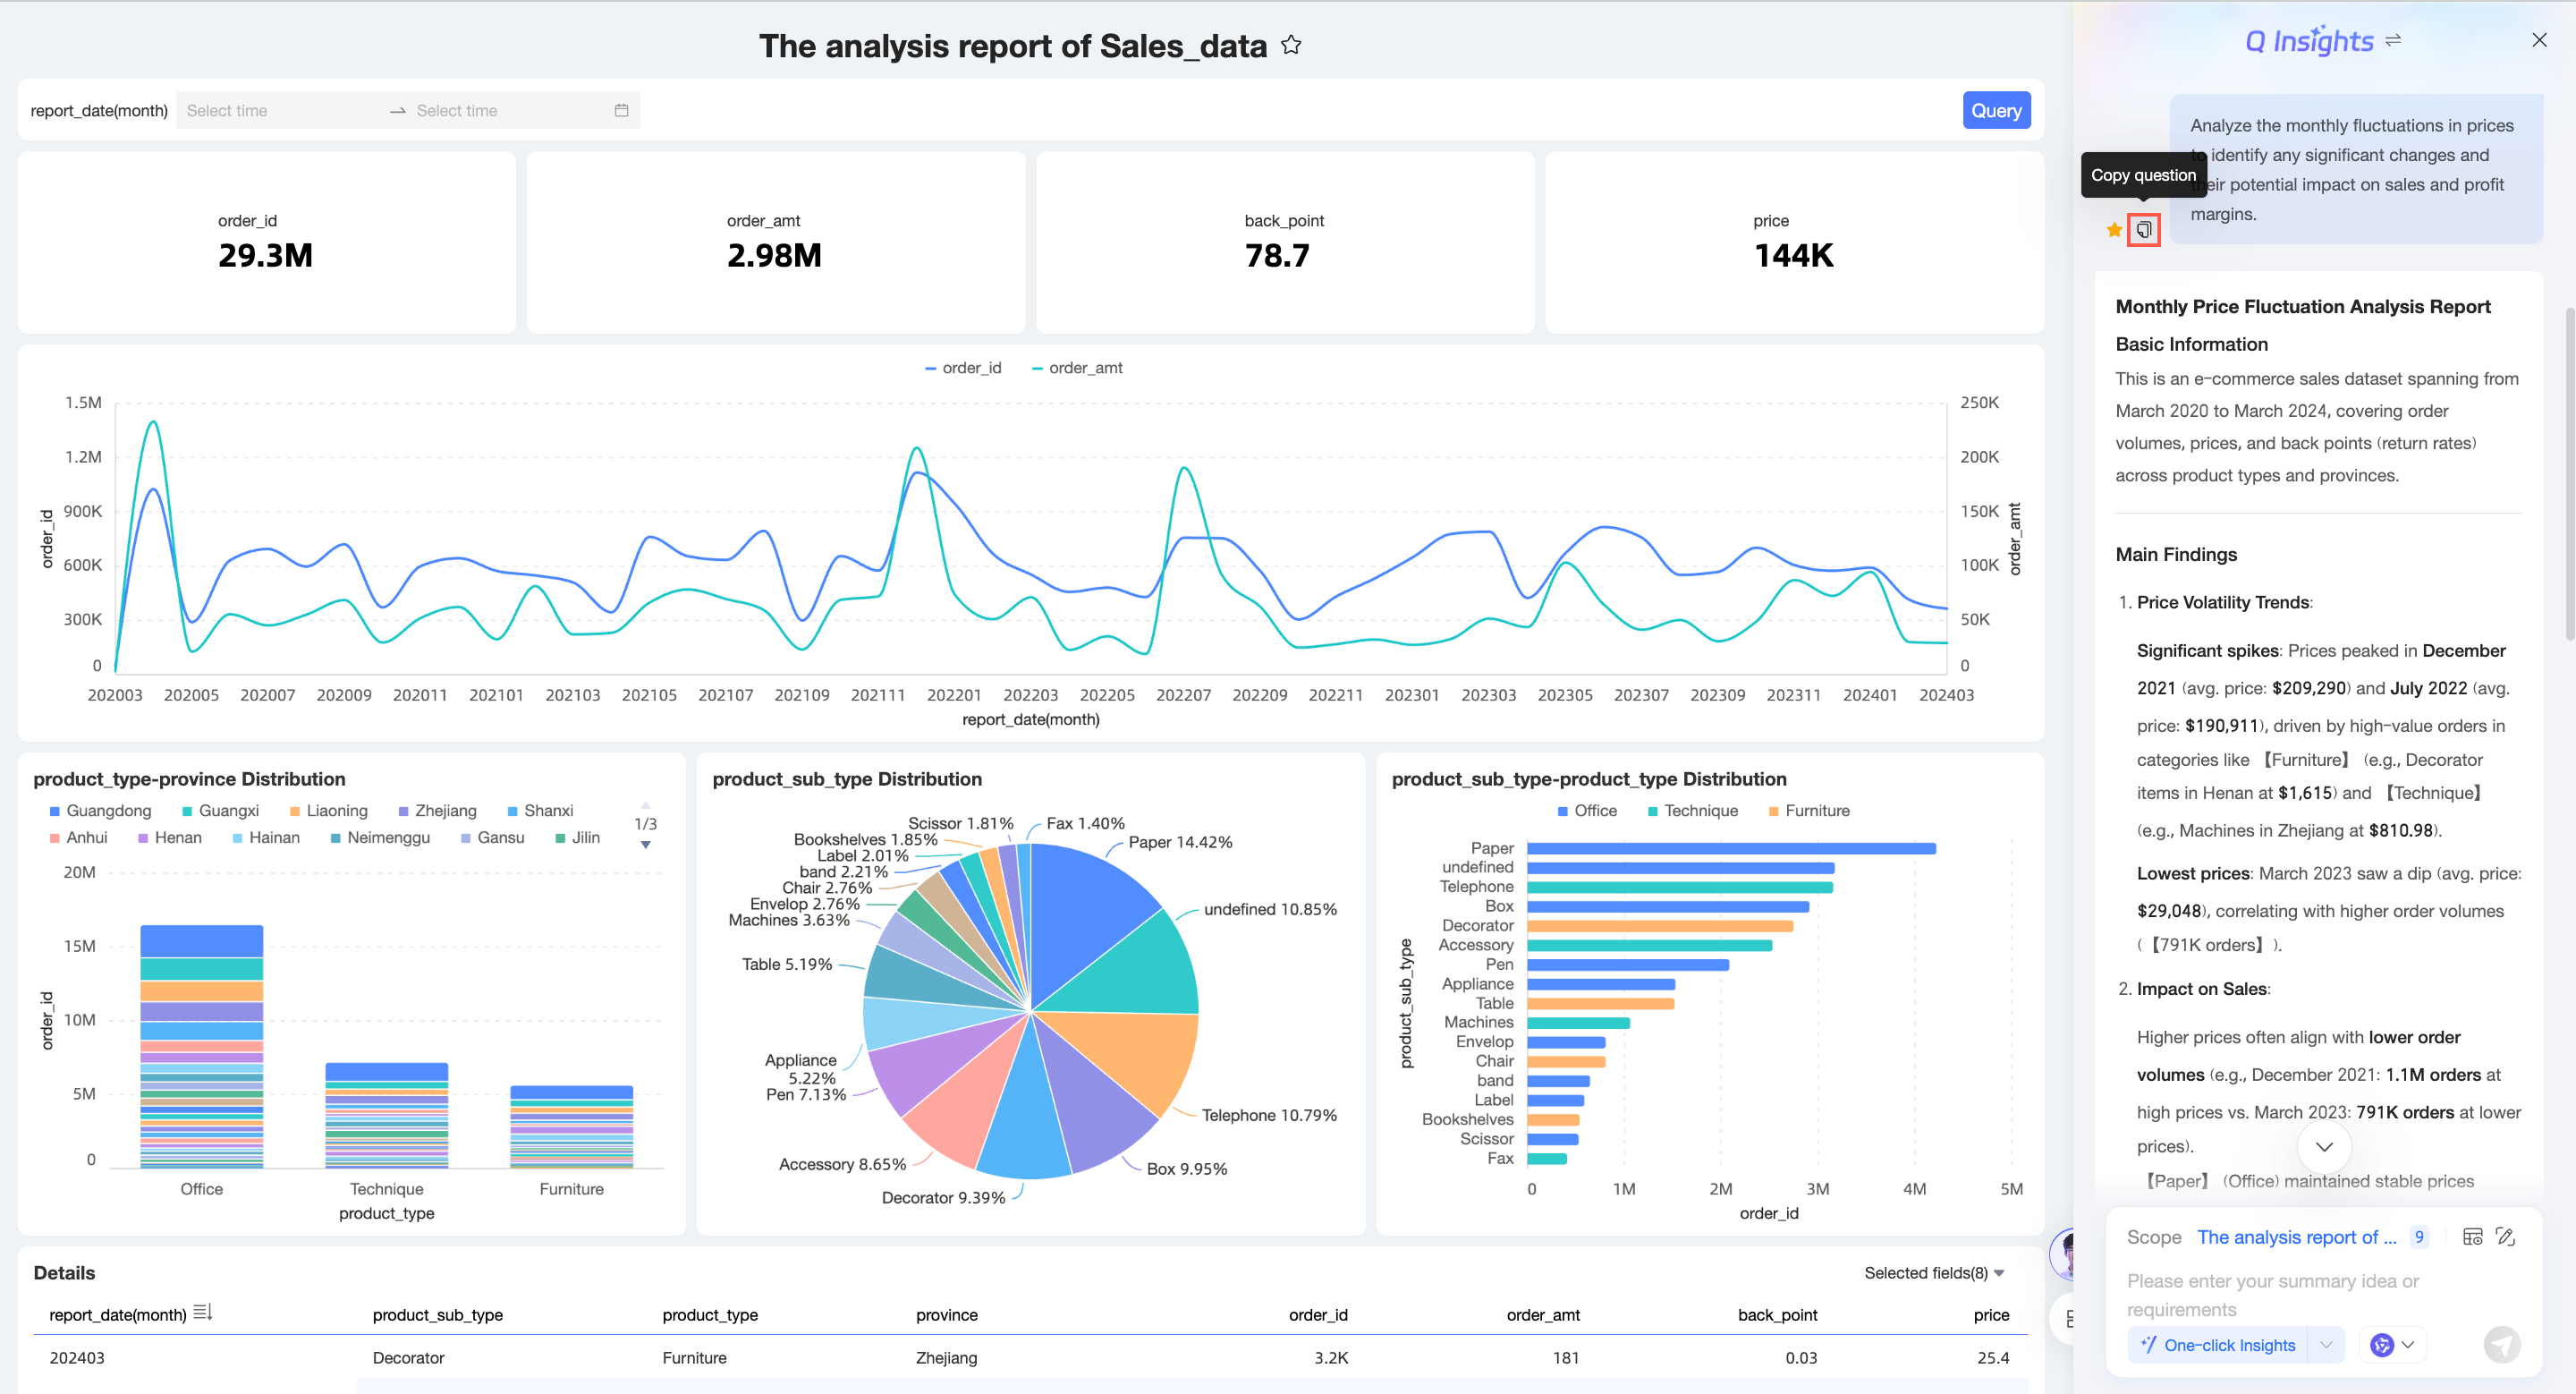
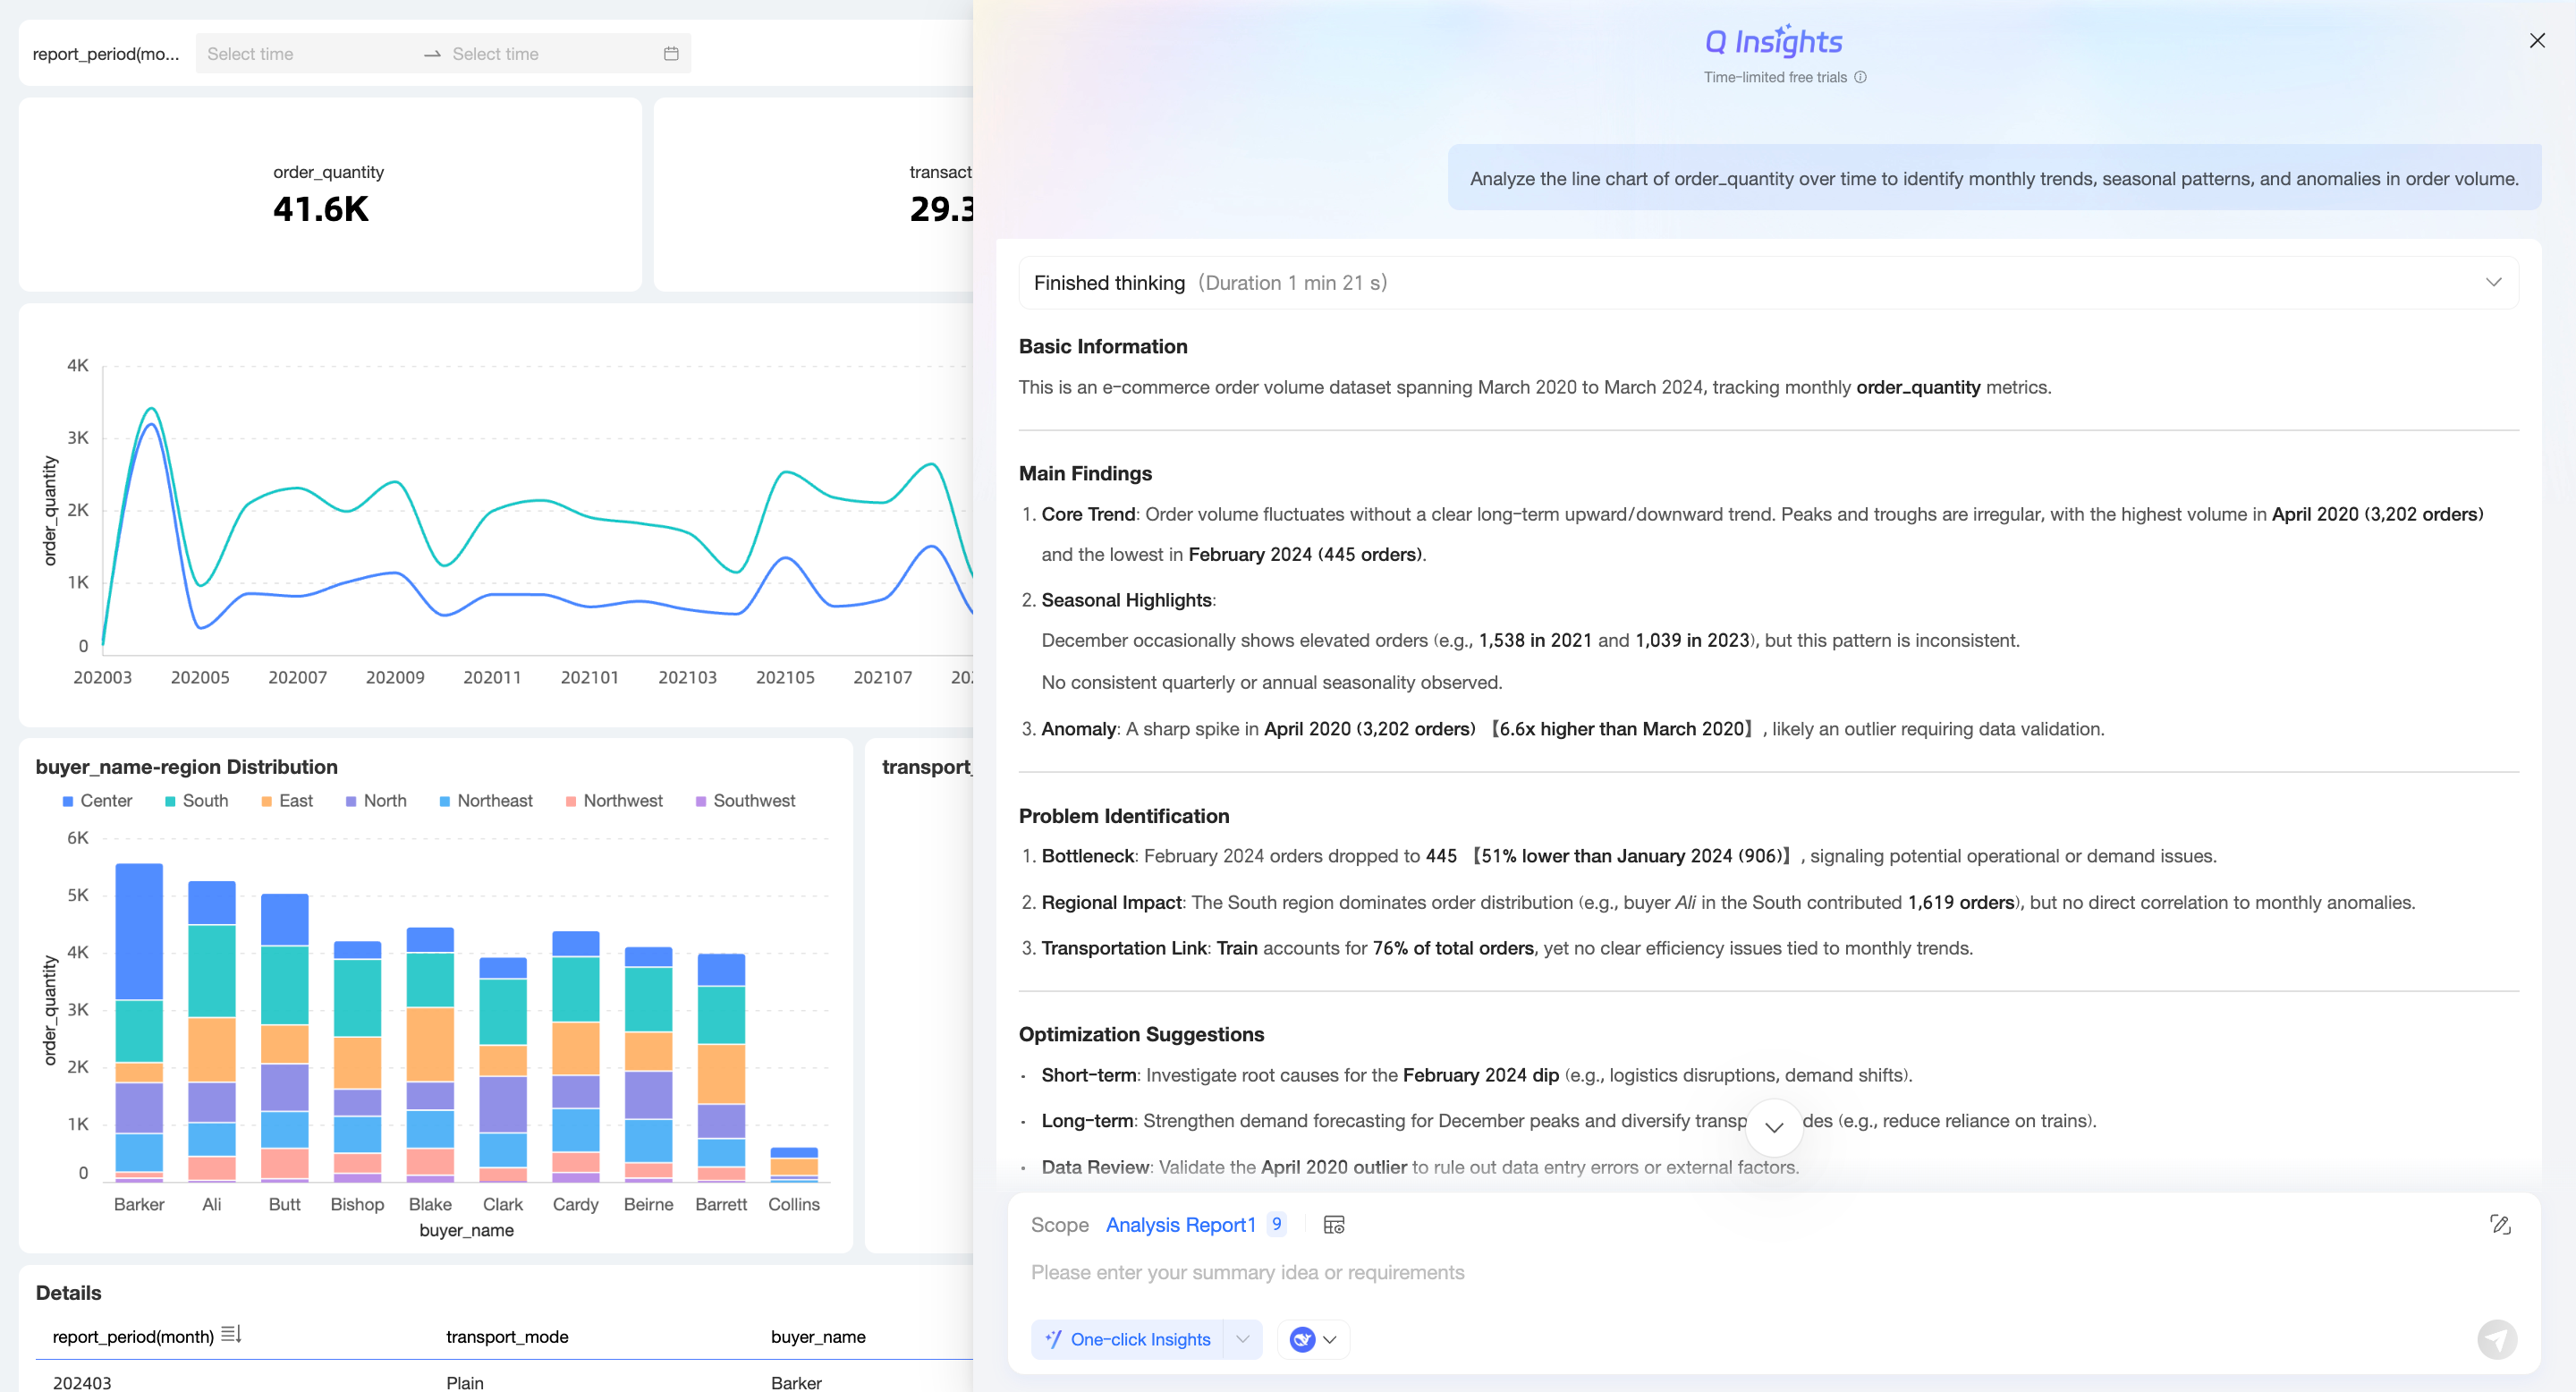
Responsive panel layout
On the Q Insights panel, drag the border to change the width, and the layout adjusts accordingly.
-
When the width of the interpretation panel is less than the threshold, the page appears as follows:
-
When the width of the interpretation panel exceeds the threshold, the panel overlays the report, and the page appears as follows:
 Note
NoteThe maximum width of the interpretation panel is 90% of the page width.
Usage examples
Dashboard-level Q Insights
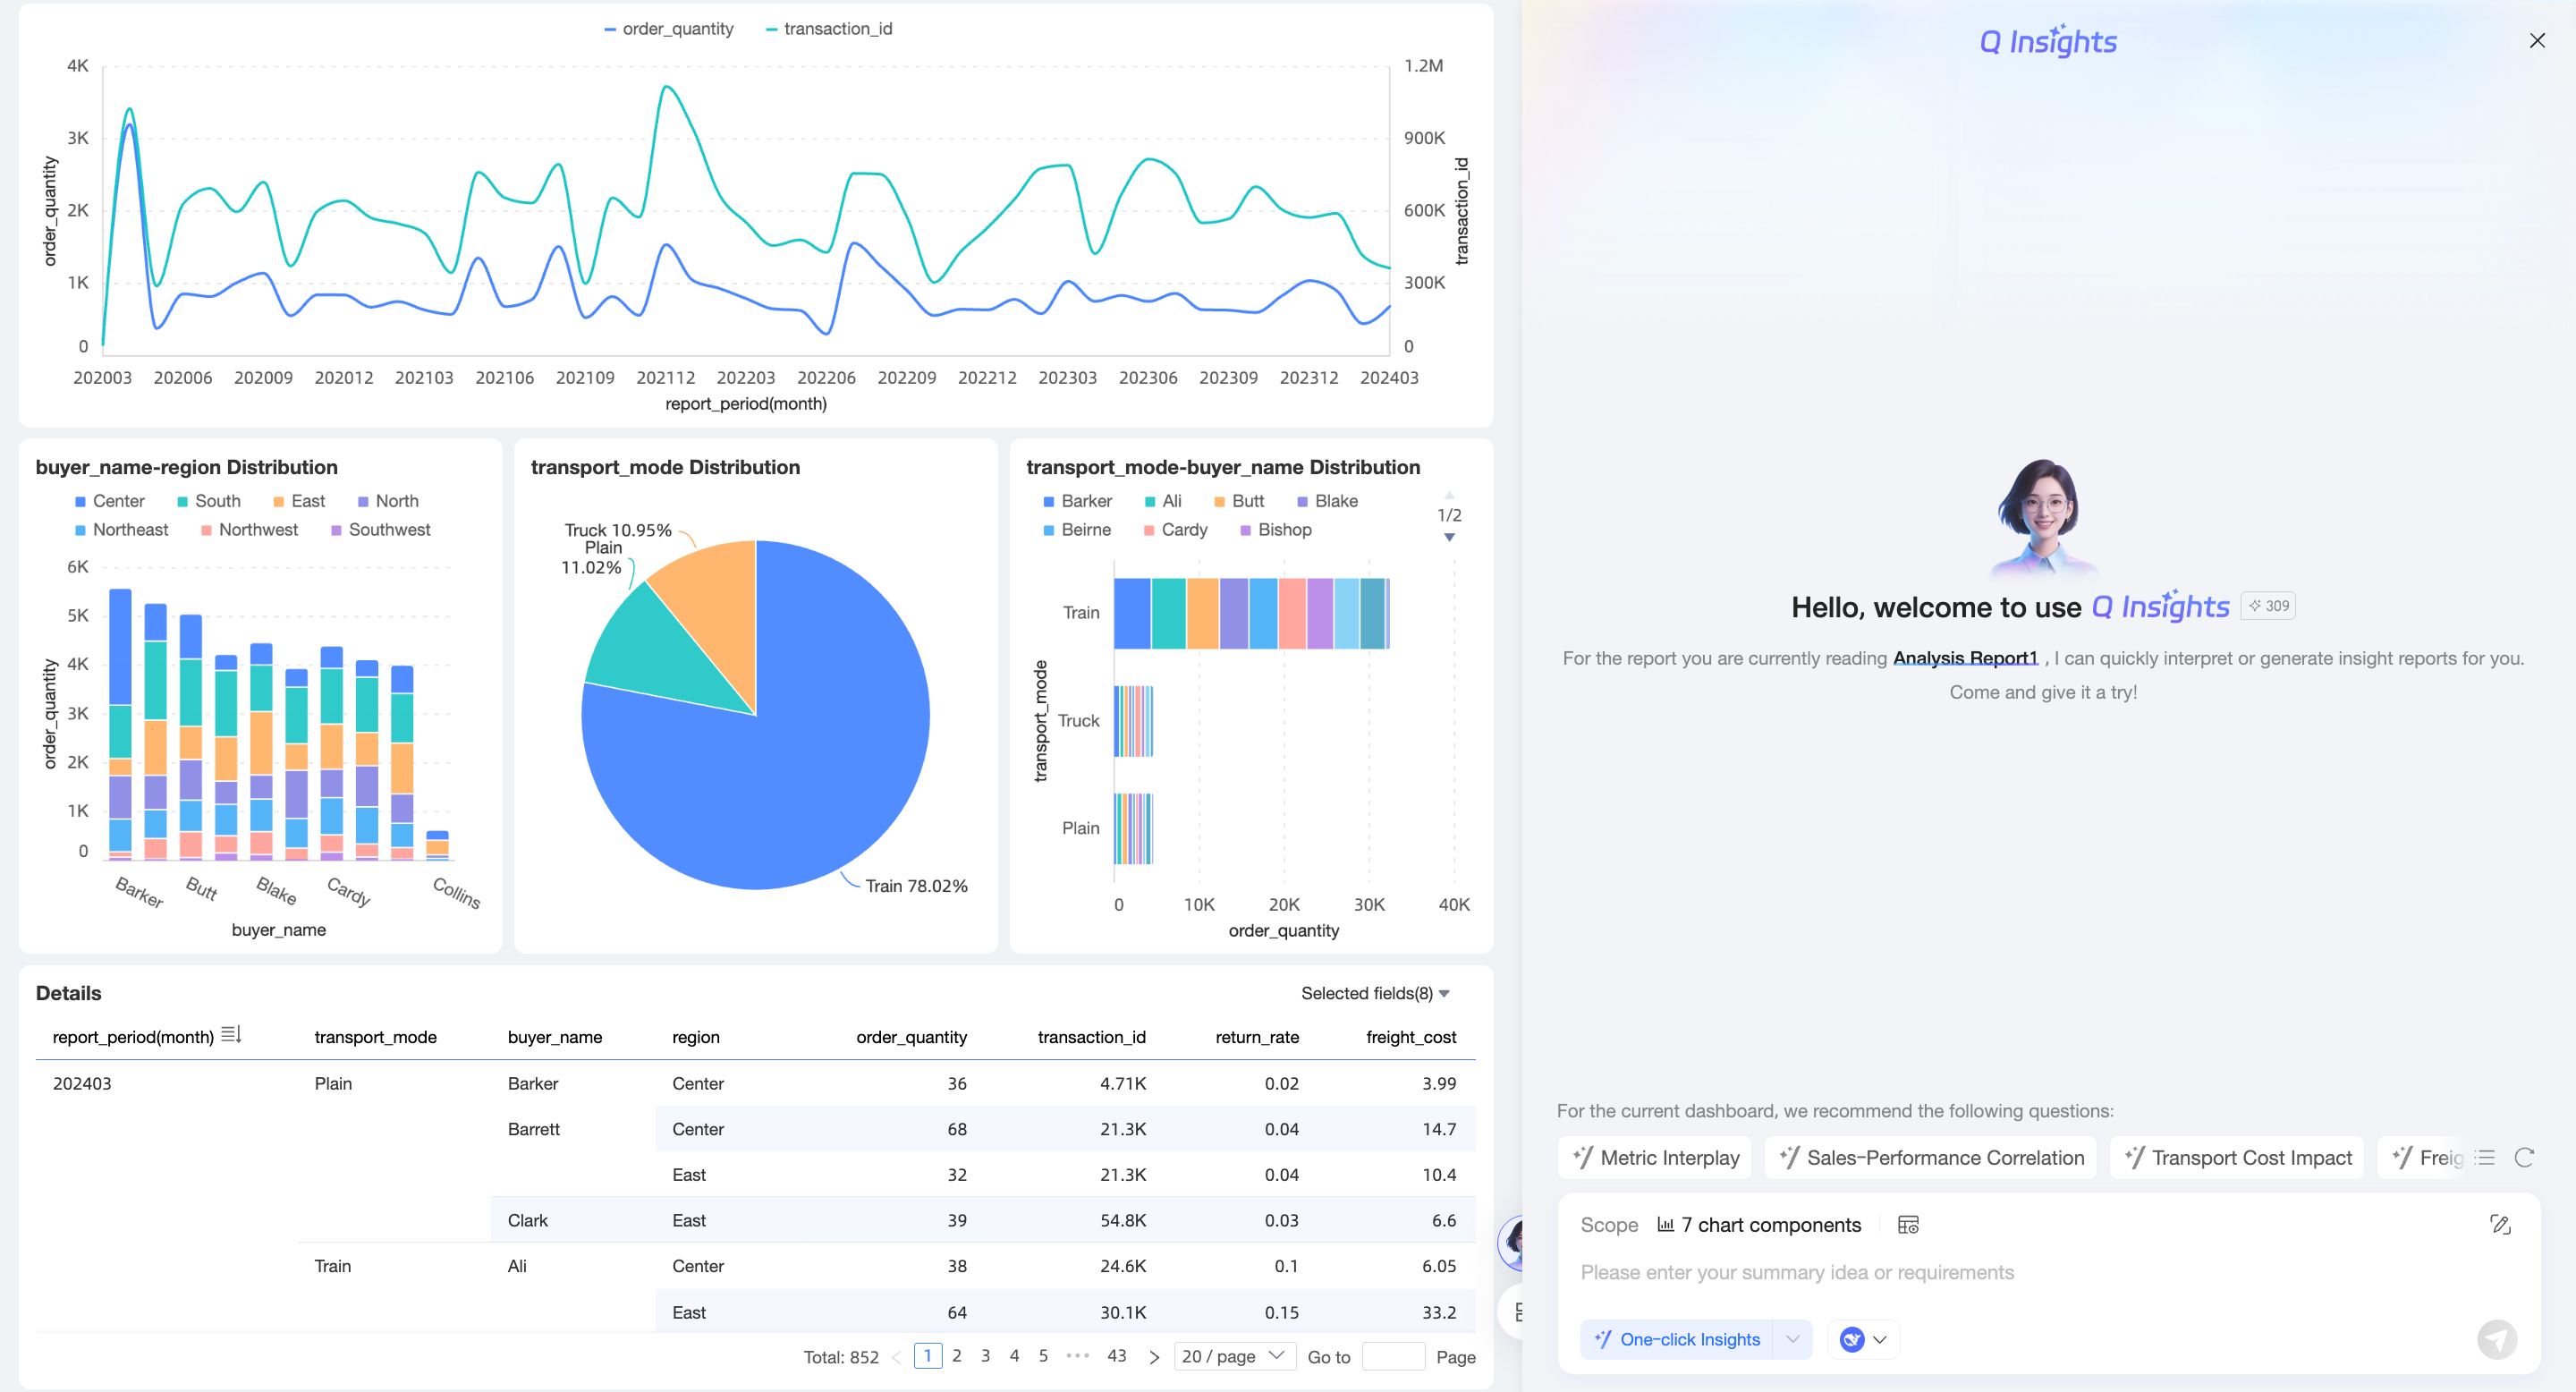
Suppose you are a data analyst in a sales department and need to analyze this year's overall sales data. You can use Recommended Questions for a Q Insights.
-
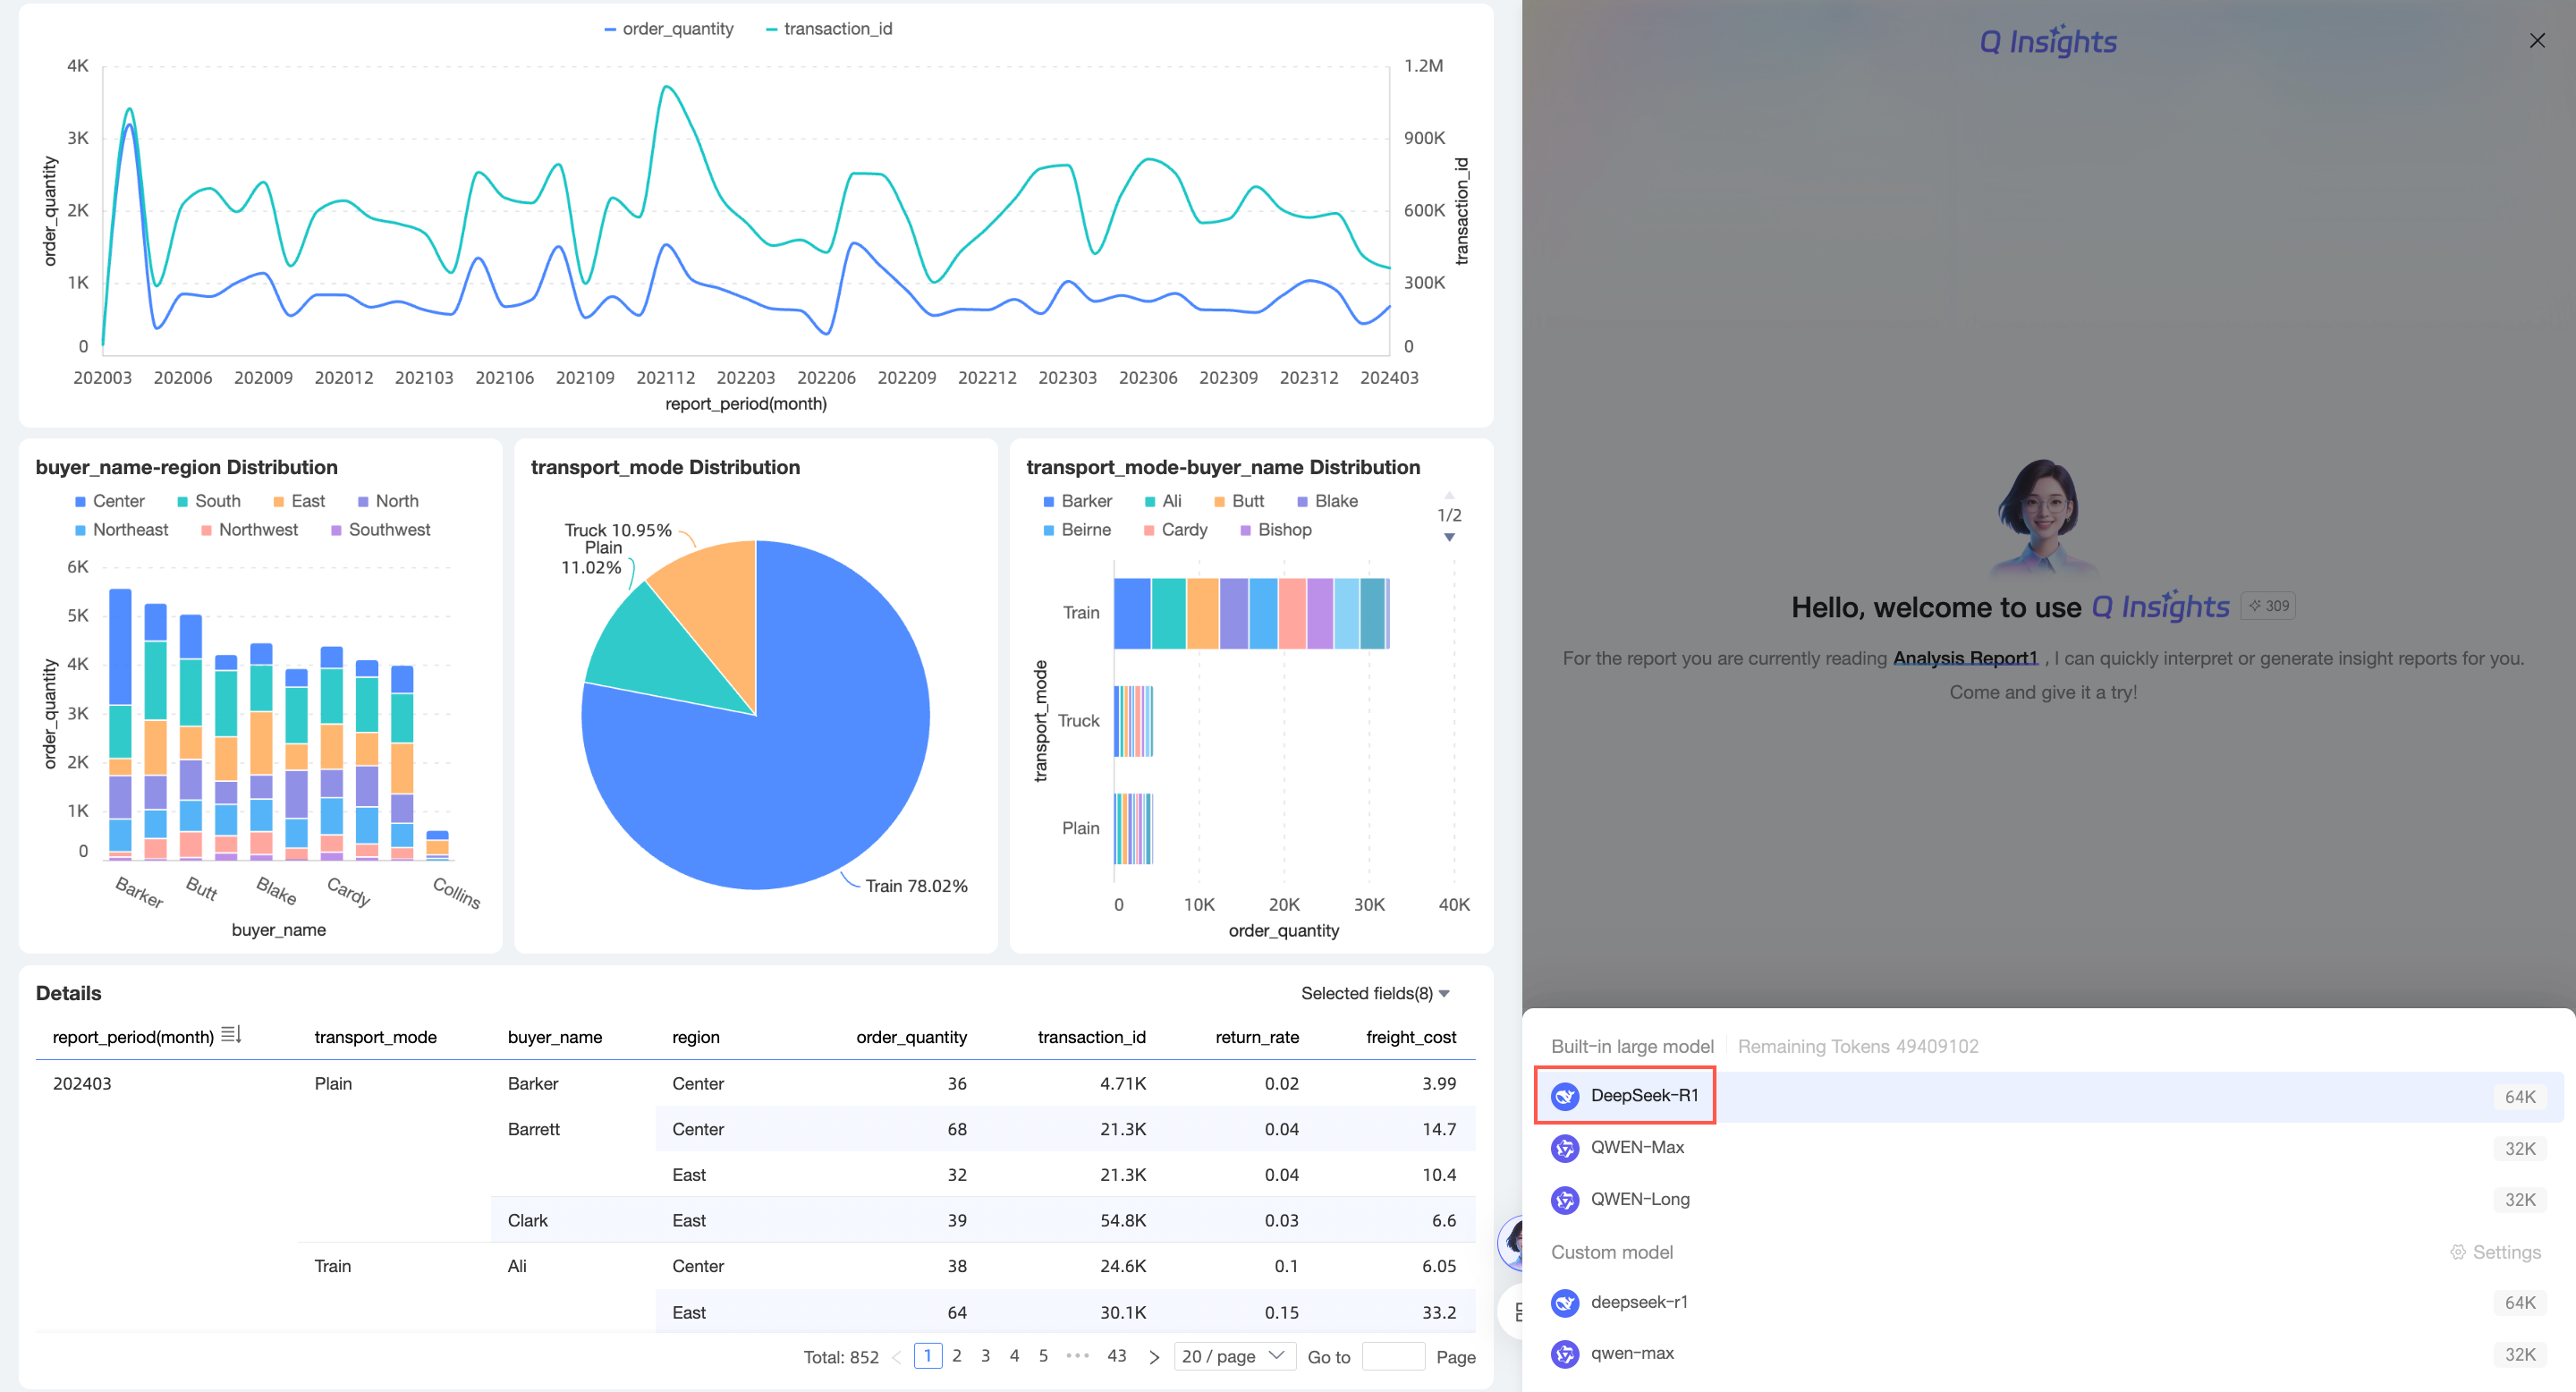
Select a model. In this example, the built-in DeepSeek large language model is selected.
-
Select one of the recommended questions to ask.
-
After you click it, the system returns the interpretation results.
Simple input query
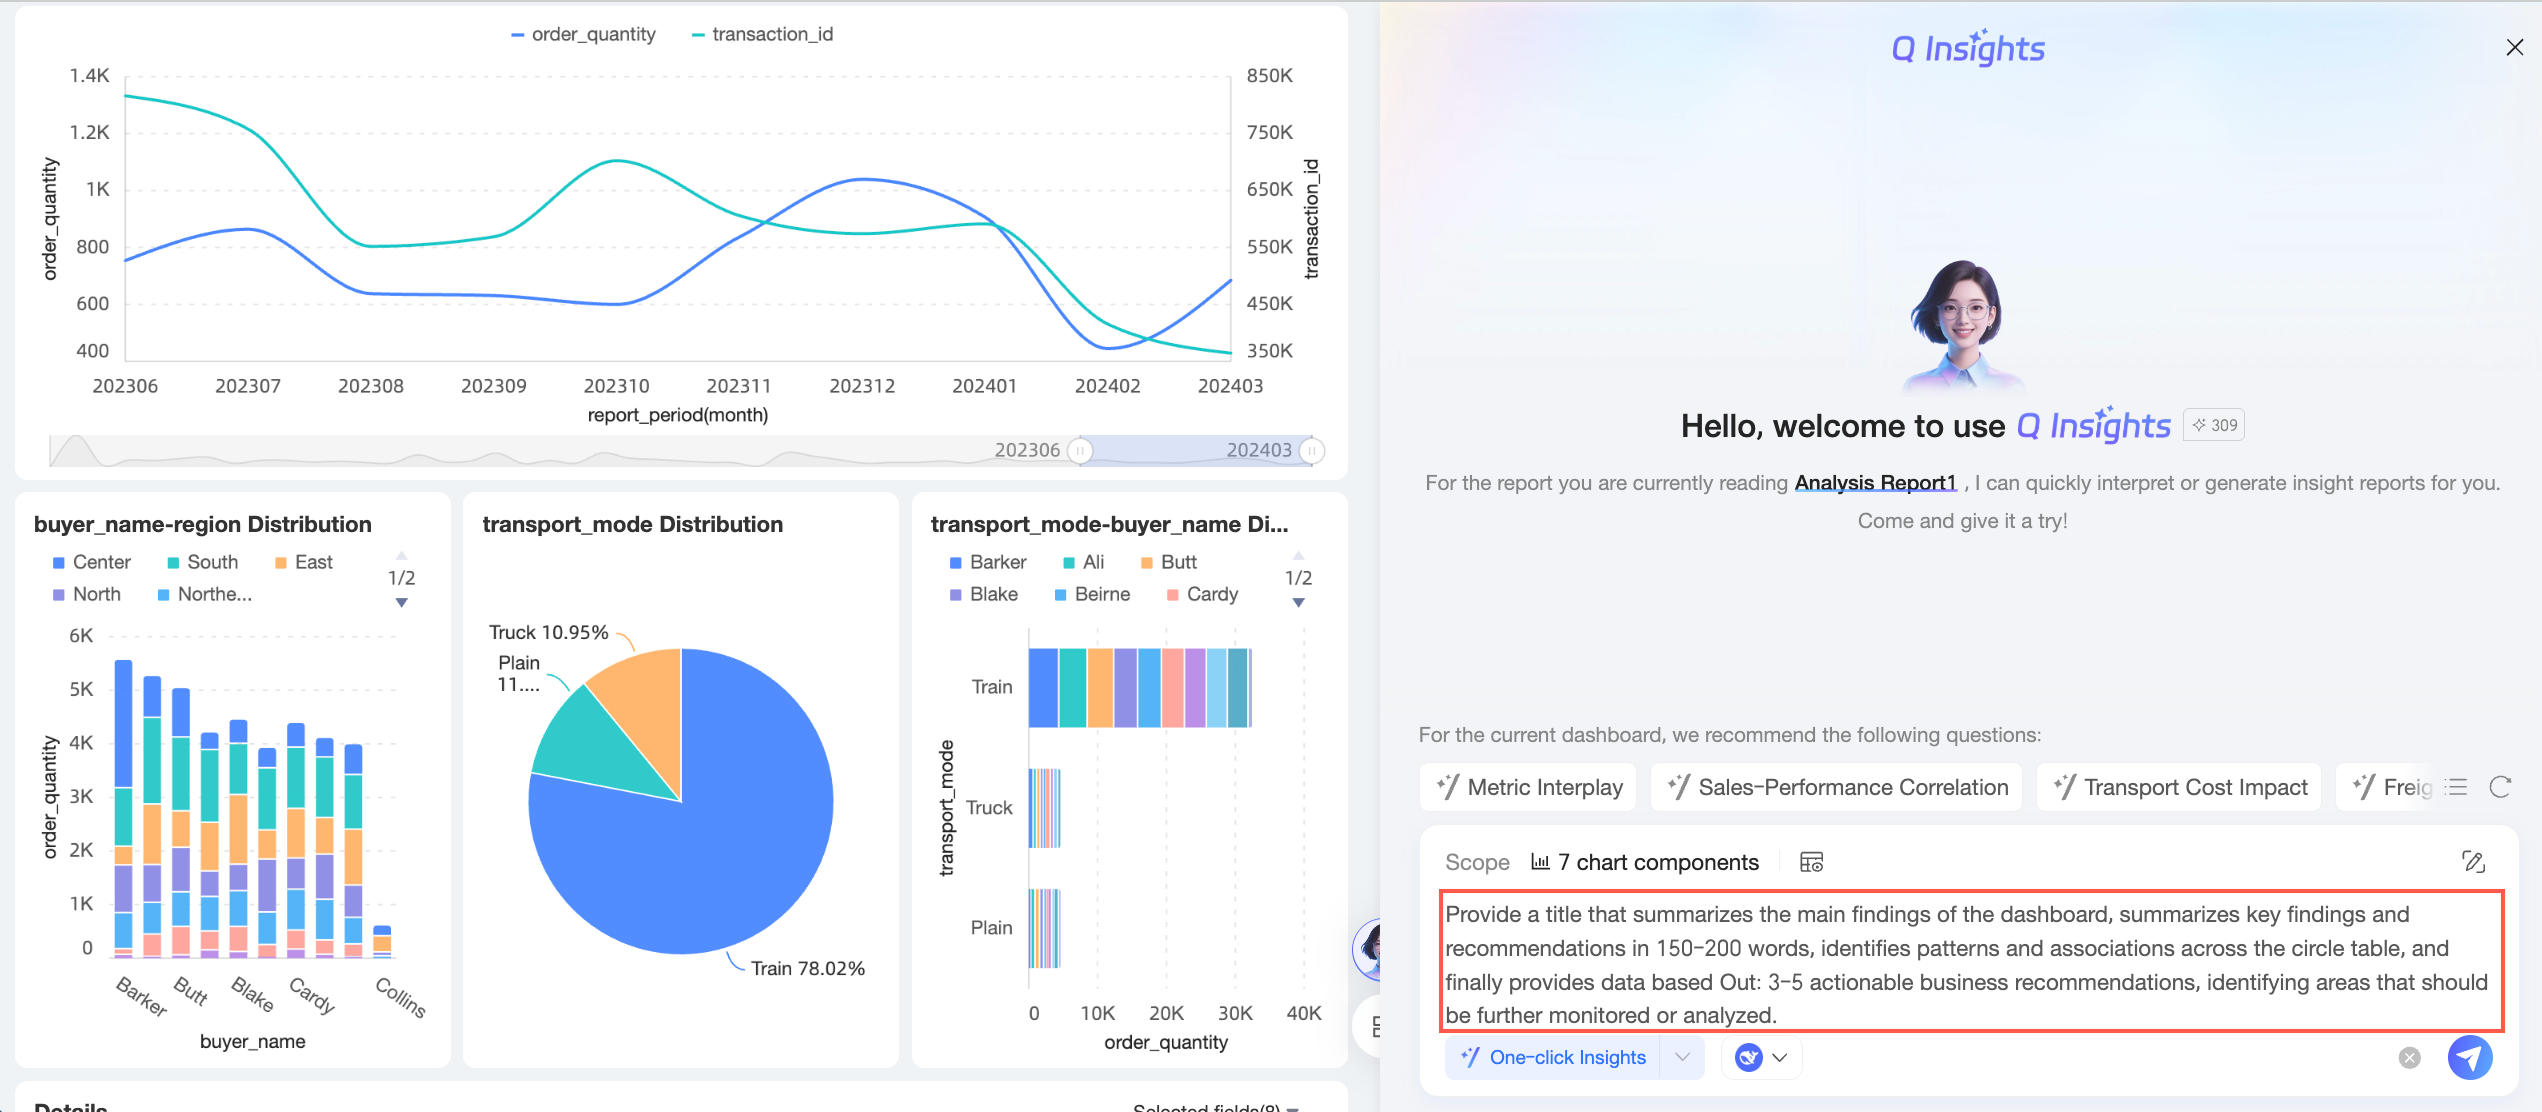
Suppose you are a data analyst in a sales department. To answer several key questions from your manager, you need to analyze the dashboard data. You can enter a specific analysis approach to perform a Q Insights on the dashboard or multiple key charts.
-
Select a model. In this example, the built-in DeepSeek large language model is selected.
-
Enter your question.
-
Click the
 icon in the lower-right corner or press Enter.
 -
The data interpretation results are returned.
Composite analysis approach
Suppose you are a data analyst in a sales department. Beyond a comprehensive analysis of this year's sales data, you also need deeper insights into various metrics. You can run a more detailed Q Insights on multiple charts.
-
Select a model. In this example, the built-in DeepSeek large language model is selected.
-
Select the interpretation scope and click OK.
-
Click the
icon to configure the composite analysis approach.
-
On the Composite analysis approach configuration page, configure the analysis approach.
-
Select a model (Optional).
If you need to change the model you selected in Step 1, you can switch to a different model here.
-
Click Interpret Data at the bottom.
-
The data interpretation results are returned.
Single-chart Q Insights
Suppose you are a data analyst in a sales department and notice that a specific chart shows unusual data or requires in-depth analysis. You can select that chart directly for Q Insights.
-
Hover over the target chart, click the
icon in the upper-right corner, and select Q Insights. -
The Q Insights panel opens.
-
Select a model. In this example, the built-in DeepSeek-R1 large language model is selected.
-
Enter your analysis approach, and then click the
icon in the lower-right corner or press Enter.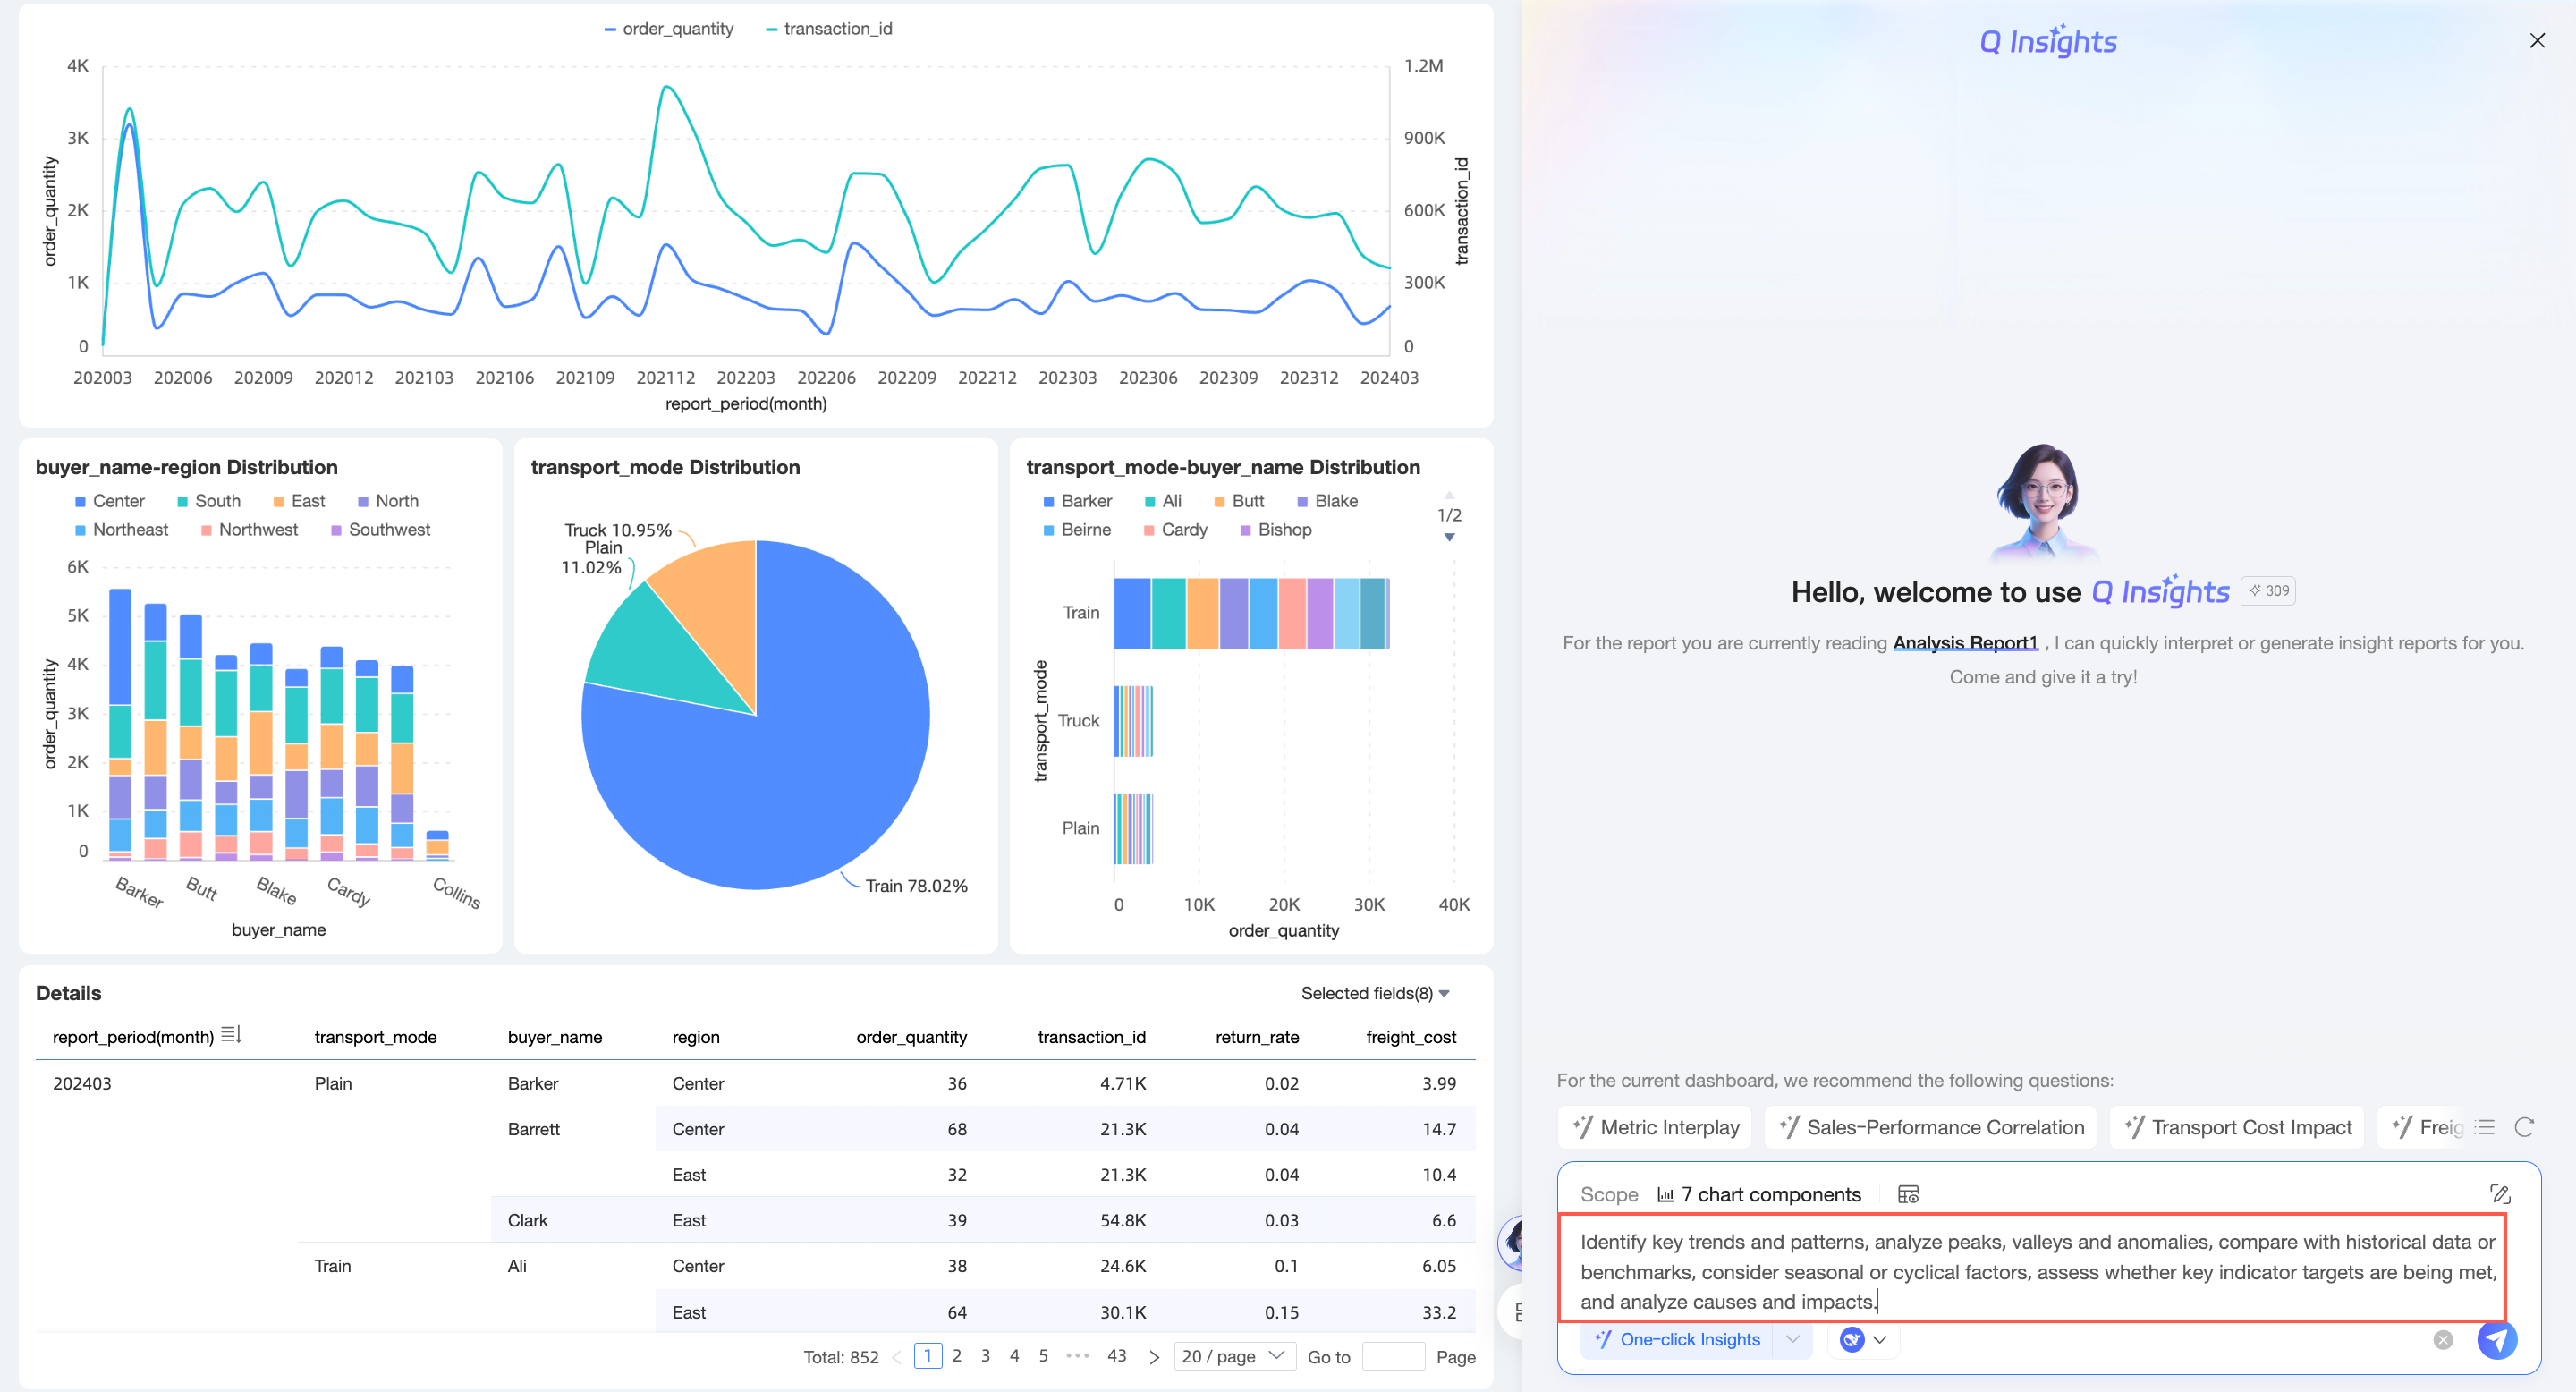
-
The data interpretation results are returned.