Apache JMeter is an open-source tool for performance testing, featuring parameterization, assertions, and a rich ecosystem of extensions. PTS enhances JMeter by providing native engine support, easy horizontal scaling, and integrated cloud monitoring. This lets you run high-concurrency tests and pinpoint performance issues effectively. This topic shows how to create and run a JMeter performance test.
Step 1: Create a JMeter scenario
-
Upload a JMeter test file.
-
Log on to the PTS console, choose , and then click JMeter.
-
On the Create JMeter Scenario page, enter a Scenario.
-
In the Scenario Settings section, upload a JMeter test file with a
.jmxextension. The file name cannot contain spaces.After you upload the JMX test file, PTS automatically adds missing plug-ins. For more information, see Automatic completion of JMeter plug-ins.
-
Click Upload File to upload other necessary files, such as CSV data files or JAR plug-in files.
ImportantUploading a file with the same name as an existing file overwrites it. To verify if a file has changed, you can get its MD5 hash from the Actions column and compare it with the MD5 hash of your local file.
Limitations:
-
JMX script file: The file size cannot exceed 2 MB. You can upload multiple JMX script files, but only one can be selected for a test.
-
JAR file: The file size cannot exceed 10 MB. Before uploading, debug the JAR file in your local JMeter environment.
-
CSV file: The file size cannot exceed 60 MB. For files larger than 60 MB, use the OSS data source feature to import them. The total number of non-JMX files cannot exceed 20.
Important-
When preparing a CSV file, do not rename an XLSX file extension. Export the file to CSV format from software like Excel or Numbers, or generate it programmatically by using a library such as Apache Commons CSV.
-
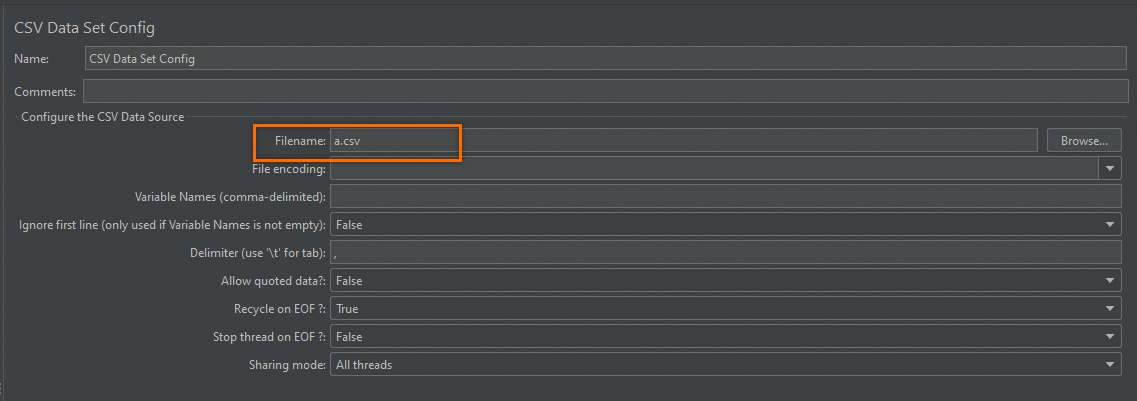
If your JMX script references a data file, set the Filename field in the CSV Data Set Config element to the file name only. Do not include the file path, as shown in the following figure. Otherwise, PTS cannot read the data file. This rule also applies if you use the __CSVRead function or reference files in a JAR package.
-
-
-
If you uploaded multiple JMX files, select one to use as the JMeter script for this test scenario.
-
(Optional) For a CSV file, you can select Split File to distribute unique data segments from the file to each load generator. If you do not select this option, each load generator uses the same data. For more information, see Use CSV parameter files in JMeter.
-
(Optional) If your uploaded script contains distributed components, such as timers or controllers, you can configure their distributed behavior across multiple load generators for more precise performance testing.
-
Configure the Synchronous timer. If your JMeter script includes a timer, choose whether the settings in the script should apply globally or to a Single Generator.
-
Configure the Constant Throughput Timer. If your JMeter script includes a timer, choose whether the settings in the script should apply globally or to a Single Generator. For more information, see Example of distributed constant throughput.
-
-
Choose whether to use dependency environment. For more information, see JMeter environment management.
-
If you select Yes, you must select an environment that you have already created.
-
If you select No, select a JMeter version. PTS supports Apache JMeter 5.0 and Java 11.
-
-
-
Configure the load.
For more information about how to set up the load, see Configure load pattern and magnitude.
-
(Optional) Configure advanced settings.
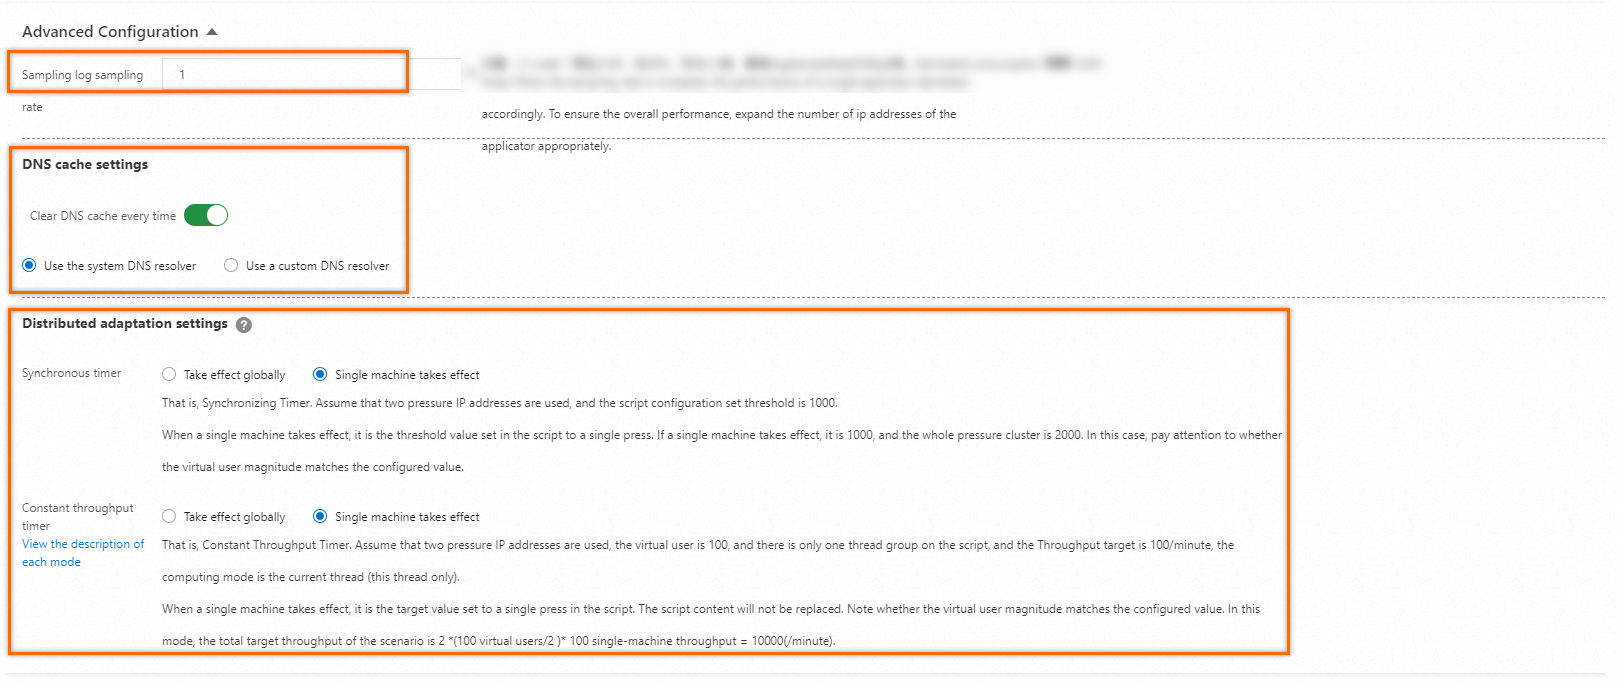
Advanced settings include log sampling rate, DNS configuration, and distributed component settings. This section is disabled by default. To configure these settings, turn on the switch.
Default settings
Default settings are used: the log sampling rate is 1%, the DNS cache is not cleared for each loop, the system DNS resolver is used, and both the synchronizing timer and constant throughput timer apply to a single generator only.
Custom settings
-
Log sampling rate settings
You can customize the log sampling rate. The default rate is 1%. To decrease the sampling rate, enter a value in the range of
(0,1]. To increase the rate, enter a multiple of 10 in the range of(1,50], such as 20.ImportantA sampling rate greater than 1% incurs an additional fee. For example, a sampling rate of 20% incurs an additional fee of 20% of the VUM cost. For more information, see Pay-as-you-go.
-
DNS cache settings
You can choose whether to clear the DNS cache for each request. If you choose to clear the DNS cache, you can use the system DNS resolver or a custom DNS resolver.
You may need to use a custom DNS resolver in the following situations:
-
Performance testing in a public network environment
If test requests need to access services over the public internet, you can bind a public domain name to the IP address of a test environment. This isolates test traffic from production traffic.
-
Performance testing in an Alibaba Cloud VPC environment
This applies when testing services located within your Alibaba Cloud VPC. To avoid changing the domain name in your test endpoints, you can bind a domain name to a private IP address within the VPC for the test scenario. For more information, see Test services in an Alibaba Cloud VPC.
-
-
Distributed component settings
If your script contains distributed components such as timers or controllers, you can configure their distributed behavior across multiple load generators for more precise and effective performance testing.
-
Configure the synchronizing timer. If your JMeter script includes a timer, choose whether the settings in the script apply globally or to a single generator.

-
Global: The value in the script is treated as the total threshold for the entire cluster. This value is divided by the number of load generators. For example, if two load generators are used and the script sets the threshold to 1,000, the threshold for each generator is 500.
-
Single generator: The value in the script is applied as the threshold for each individual load generator. The script content is not modified. Ensure that your concurrency settings match this value. For example, if two load generators are used and the script sets the threshold to 1,000, the threshold for each generator is 1,000, and the total threshold for the cluster is 2,000.
-
-
Configure the constant throughput timer. If your JMeter script includes a controller, choose whether the settings in the script apply globally or to a single generator.

-
Global: The value in the script is treated as the total target throughput for the entire cluster. This value is divided by the number of load generators. For example, assume a test uses two load generators and 100 concurrent users. The script has one thread group, a target throughput of 100 per minute, and the calculation mode is for the current thread. The total target throughput per minute for the scenario is 2 × (100 concurrent users / 2) × (100 / 2) = 5,000.
-
Single generator: The value in the script is applied as the target throughput for each individual load generator. The script content is not modified. Ensure that your concurrency level matches this value. For example, assume a test uses two load generators and 100 concurrent users. The script has one thread group, a target throughput of 100 per minute, and the calculation mode is for the current thread. The total target throughput per minute for the scenario is 2 × (100 concurrent users / 2) × 100 = 10,000.
-
-
-
-
(Optional) Add cloud resource monitoring.
Adding monitoring lets you view the corresponding monitoring data during the test and in the test report. This feature is disabled by default. To configure it, turn on the switch.
-
(Optional) Add other information.
You can add the test owner and remarks. This feature is disabled by default. To configure it, turn on the switch.
Step 2: Run the test
-
Before running a full test, you can debug the scenario to check for issues such as network connectivity, plug-in integrity, and script configuration errors. This helps prevent test failures.Debugging a scenario is a key step to validate your configuration. To debug the scenario, click Debug to open the scenario debugging page. For more information, see Debug scenarios.
-
Click Save and Start. In the Note dialog box, select Execute Now, select The test is permitted and complies with the applicable laws and regulations., and then click Start Test.
-
(Optional) During the test, you can monitor test data and adjust the scenario concurrency.
-
Data
Item
Description
Real-time VUM
This is the total resources consumed by the test, measured in Virtual User Minutes (VUM).
Request success rate (%)
The success rate of all requests during the statistical period.
Average RT (success/failure)
-
Success RT Avg (ms): The average response time of all successful requests.
-
Failure RT Avg (ms): The average response time of all failed requests.
TPS
The total number of requests divided by the statistical period in seconds.
Anomalies
The number of request exceptions. Common causes include connection timeouts and request timeouts.
Traffic (Request/Response)/Seconds
The request traffic sent and response traffic received by the load generators.
Concurrency (current/max)
The concurrency value for the test. If you adjust the concurrency during the test, the current and maximum configured concurrency values are displayed. During the warm-up stage, concurrency may not reach the configured value, but it reaches that value after the warm-up period ends.
Click Speed Regulation and enter a number to adjust the scenario concurrency during the test.
Total requests
The total number of requests sent during the test.
NoteThe monitoring data is based on simple aggregation calculations from the Backend Listener. The statistical sampling period for load generator agents is 15 seconds, and the data aggregation cycle is also 15 seconds, which can cause data latency.
-
-
Configuration Information
The Configuration information tab lists basic information about the scenario configuration, including the load source, duration, traffic model, and number of load generators.
-
Test details
-
On the Testing Details tab, click View chart to the right of an individual link to view its real-time data, such as TPS, success rate, response time, and traffic.
-
Click the Load Generator Performance tab to view time-series charts for all load generators, showing metrics like CPU utilization, 5-minute load average, memory utilization, and network traffic. You can also filter to view the performance of a specific load generator.
-
If you added monitoring for ECS, SLB, RDS, or ARMS, you can click the Cloud Resource Monitoring tab to view the related monitoring information.
-
-
Sampling log details
On the Sampling log tab, you can filter logs by test sampler, response status, or RT range to view log details.
-
Filter the logs by test sampler, response status, or other criteria. In the Actions column for a log, click View details.
-
In the Log Details dialog box, view the log fields and their values on the General tab. You can switch the display format in the upper-right corner between General and HTTP protocol style.
-
If Embed resources from HTML files (Embedded Resources from HTML Files) is configured in a JMeter script, the Sub-request Details tab appears in the log details.
You can select a sub-request to view its corresponding request logs.
-
The Timing Waterfall tab shows the time taken for the main request and each sub-request.
-
The Trace View tab displays the upstream and downstream call trace details for the tested API.
-
-
-
Step 3: View the test report
After the test stops, the system automatically collects data and generates a test report. This report shows the dynamic performance information for the JMeter scenario and its specific requests.
-
Log on to the PTS console and choose .
-
On the report list page, select the JMeter scenario type. Find the target report and click View report in the Actions column. For more information, see View JMeter test reports.
NoteIn trend charts, the statistical sampling period for each data point is 15 seconds, which may cause initial data latency in the final report. Test report data is retained for 30 days. You can export reports for local storage.
(Optional) Step 4: Export the test report
You can export the current test report to your local computer.
-
On the Report details page, click Export Report.
-
Select Watermarked version or Non-watermarked version to download the test report as a PDF file.
Use cases for JMeter performance testing
JMeter performance testing is suitable for the following scenarios:
-
You need to run high-concurrency, distributed performance tests.
-
Real-time, second-level monitoring during tests, with automatically generated reports.
-
Centralized management of JMeter scripts and their environmental dependencies.
For a specific use case example, see Use JMeter to simulate file uploads.