After a Performance Testing Service (PTS) stress test completes, PTS automatically collects testing data and generates a report. The report covers scenario-level metrics, per-Sampler business details, load generator health, and request-level sampling logs -- providing everything you need to evaluate system performance and pinpoint bottlenecks.
Prerequisites
Before you begin, ensure that you have:
A completed JMeter performance test in PTS. JMeter reports are marked with a JMeter tag
 icon in the report list
Open a report
Log on to the PTS console and choose Performance Test > Reports.
Find the target report and click View Report in the Actions column.
Sampling logs are retained for 30 days. After this period, you cannot view the sampling logs. To prevent data loss, export the report to your on-premises device before the retention period expires.
Report sections
A JMeter performance testing report contains four sections: Business Monitoring, Load Generator Monitoring, Request Sampling Log, and JMeter Logs.
Business monitoring
Navigate to Global Monitoring > Business Monitoring to view scenario-level metrics and per-Sampler breakdowns.
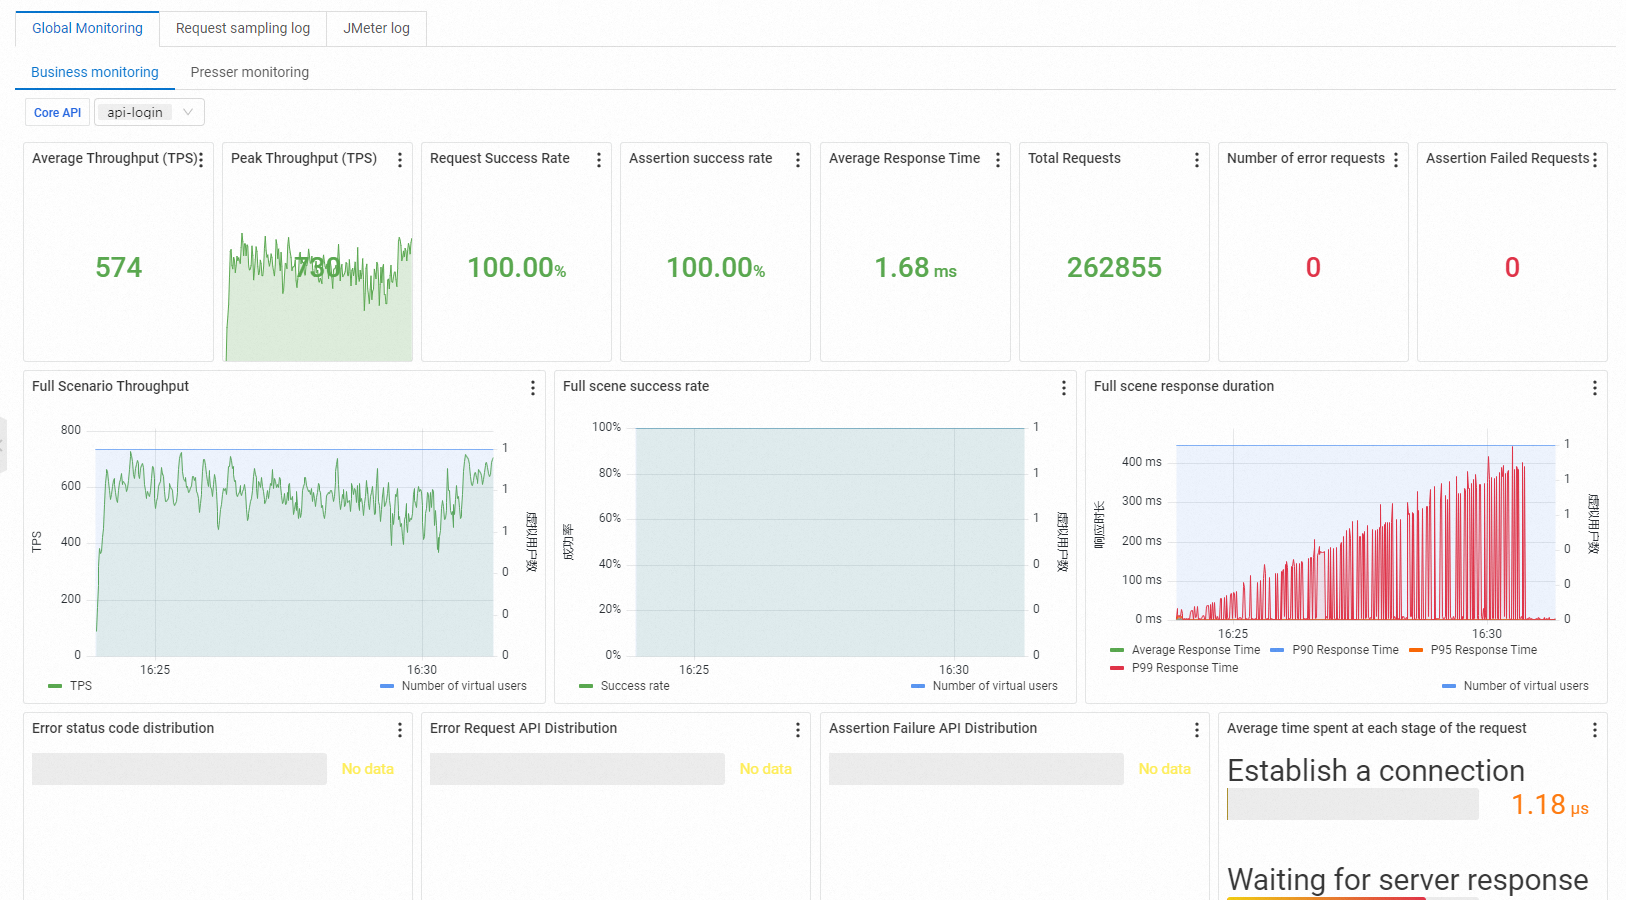
The view contains two groups of metrics:
Scenario metrics summarize the overall test run:
| Metric | Description |
|---|---|
| VUM | Total resources consumed, measured in Virtual User Minutes (VUM). One VUM equals one virtual user running for one minute. |
| Scenario Concurrency | Active concurrent virtual users. During the warm-up phase, this value ramps toward the configured concurrency level. After warm-up completes, it matches the configured level. |
| Scenario TPS (s) | Total requests in all agent statistical periods divided by the time. |
| Total Requests | Total requests sent across the entire scenario. |
| Successful RT Avg (ms) | Mean Response Time (RT) for all successful requests. A stable or low value indicates consistent backend performance. |
| Failed RT Avg (ms) | Mean RT for all failed requests. Compare against the successful RT to determine whether failures correlate with timeouts or immediate rejections. |
| Success Rate | Percentage of successful requests across all agents. |
| Load Source | Origin of test traffic: public internet inside the Chinese mainland, or Alibaba Cloud VPC. |
| Specified IP Addresses | Number of source IP addresses configured in the scenario load settings. |
Business metrics break down performance by individual Sampler:
| Metric | Description |
|---|---|
| Sampler Name | Name of the Sampler or the aggregate scenario total. |
| Total Requests | Total requests sent by this Sampler. |
| Average TPS | Average TPS value of the current scenario during the performance testing period. Calculated as total requests during the Sampler performance testing divided by performance testing duration. |
| Success Rate | Percentage of successful requests for this Sampler. Click the success or failure count to jump directly to the corresponding log entries. Click Details to see failure counts grouped by HTTP status code (2XX, 3XX, 4XX, 5XX) and other exceptions. Under other exceptions, view error rankings, error messages, and their percentage distribution. |
| Average Response Time | Mean response time for this Sampler. Click Details to see the maximum, minimum, and percentile response times. |
| Traffic (Send/Receive) | Total bytes sent and received by this Sampler. |
Interpret business metrics
Use these patterns to identify common performance issues:
Flat response times under increasing load: The system handles the load well. This is the expected pattern for a healthy service.
Rising response times with stable TPS: The backend is approaching saturation. Scale resources or optimize slow endpoints.
TPS plateau while concurrency increases: A bottleneck exists -- likely at the application, database, or network layer. Check the slowest Samplers for clues.
Declining success rate: Failed requests are increasing. Group errors by HTTP status code using Details to isolate the root cause (for example, 429 for rate limiting or 503 for service overload).
Load generator monitoring
Navigate to Global Monitoring > Load Generator Monitoring to check the health of the machines generating test traffic.
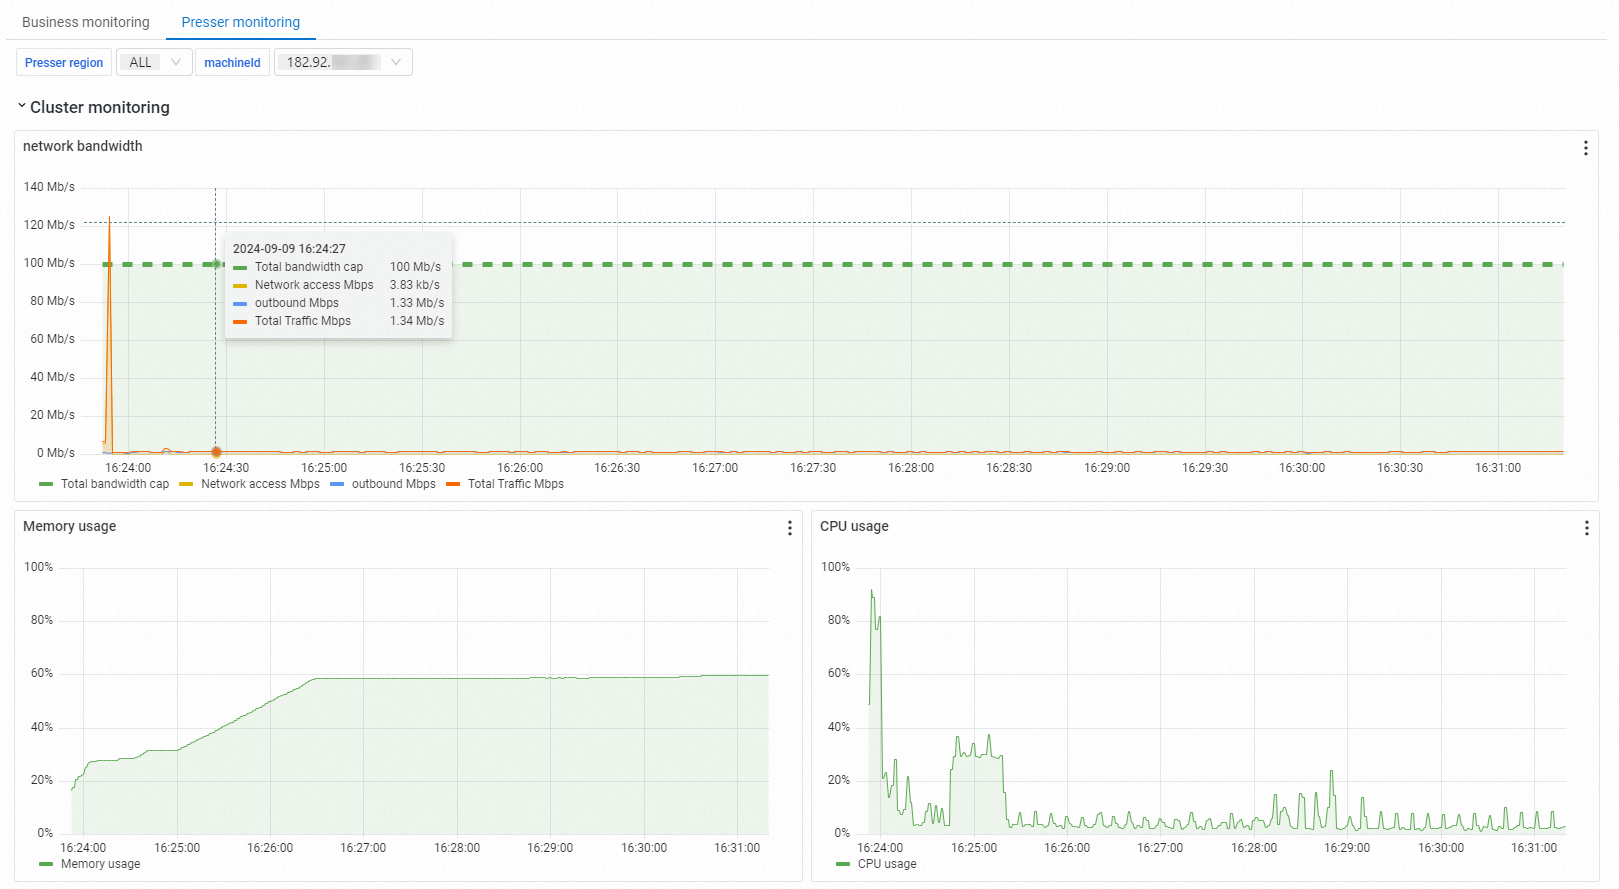
The monitoring view displays each load generator's location, network bandwidth, CPU utilization, and memory usage. Monitor these metrics to ensure the load generators themselves do not become a bottleneck that could skew test results.
Request sampling log
Click Request Sampling Log, then click View Details on any request to inspect its General information and Timing Waterfall.
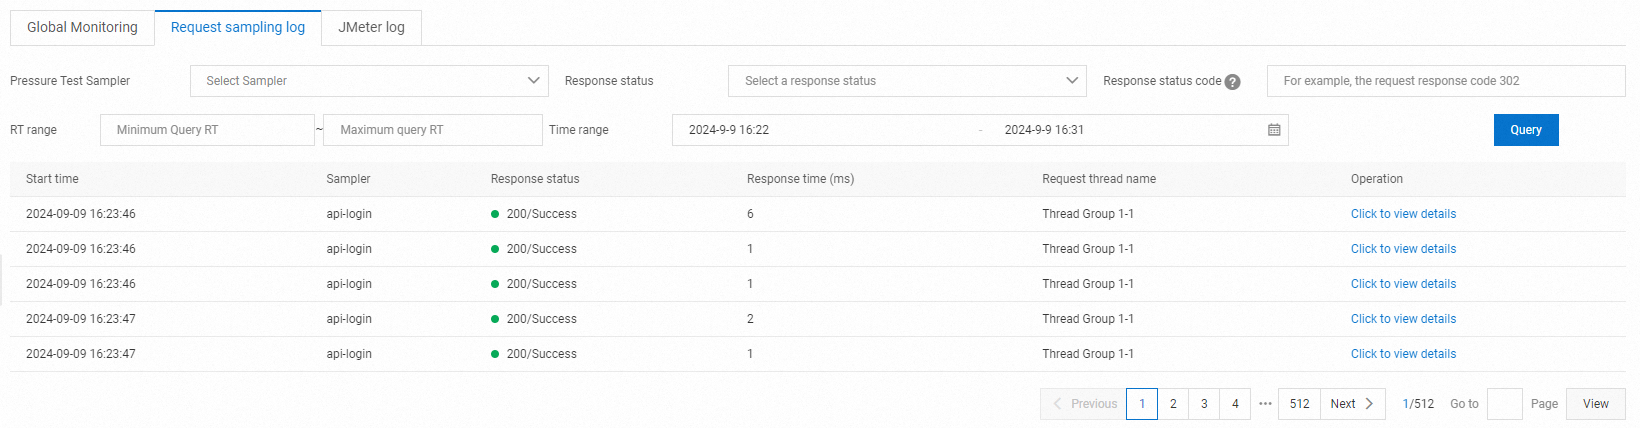
Sampling logs are useful for debugging individual request failures. The Timing Waterfall visualizes where time is spent in each request phase, making it easy to spot slow stages.
JMeter logs
Click JMeter Logs to view and retrieve JMeter engine log output.
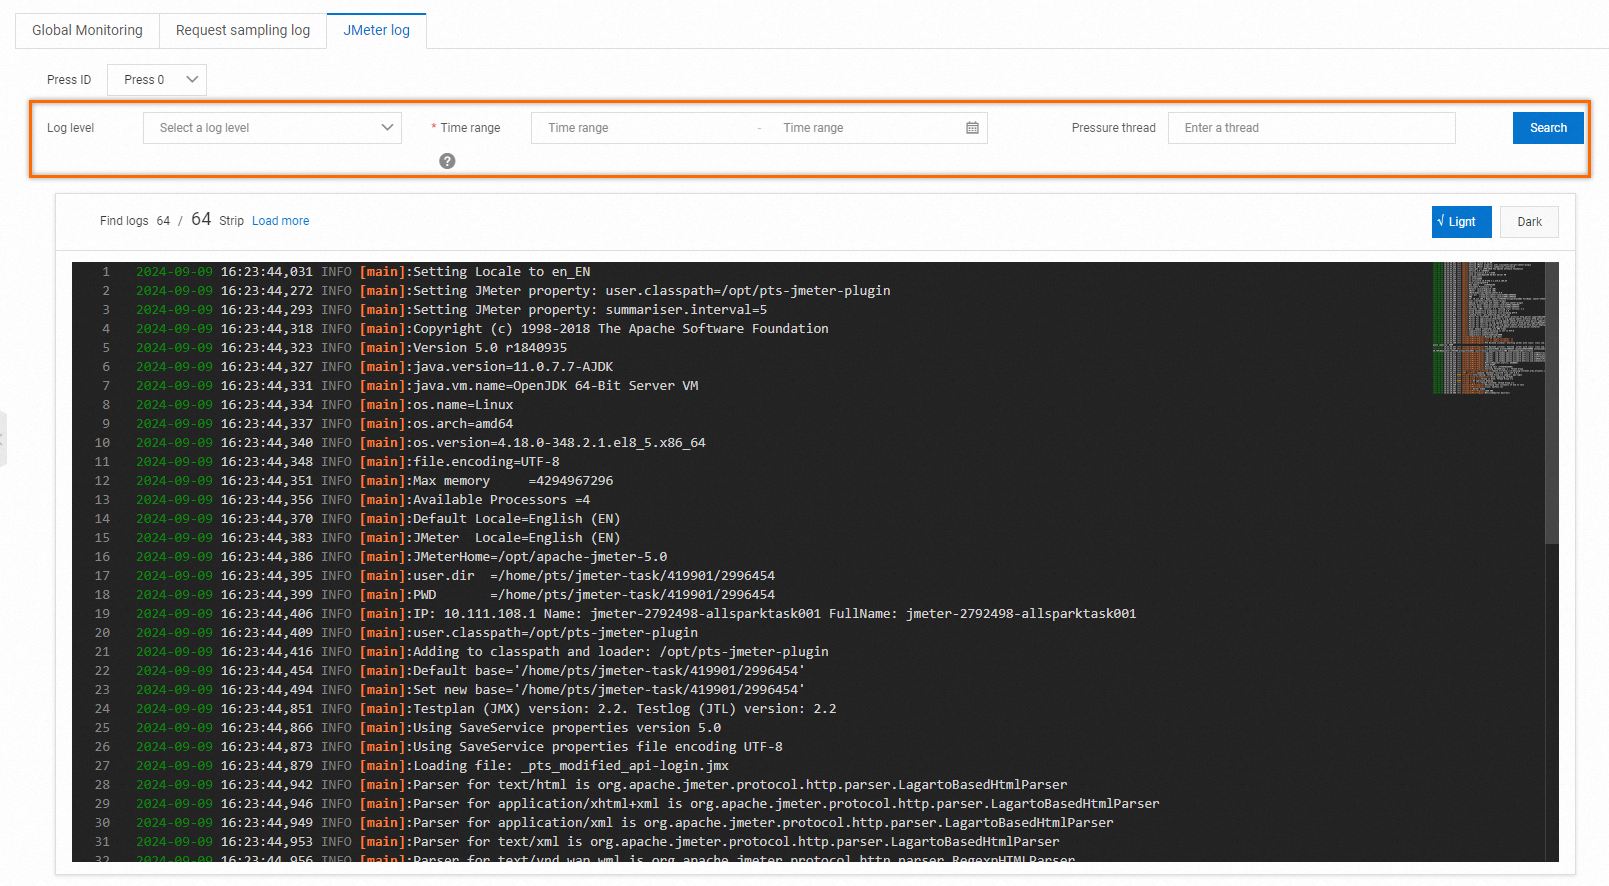
Use JMeter logs to troubleshoot script-level issues such as misconfigured thread groups, plugin errors, or assertion failures that do not surface in the business metrics.
Monitoring data is collected through Backend Listener. Both the agent sampling period and the data aggregation period are 15 seconds, so metrics may reflect a short delay relative to real-time conditions.
Troubleshoot common issues
| Symptom | Likely cause | Action |
|---|---|---|
| High error rate with 5XX codes | Backend service overload or crash | Check application logs and scale backend resources. |
| High error rate with 4XX codes | Incorrect request parameters or authentication issues | Review Sampler configuration and request headers in the sampling log. |
| Response time spikes at test start | Cold starts, cache misses, or connection pool initialization | Run a short warm-up test first, or exclude the warm-up phase from analysis. |
| Load generator CPU is high | Generator is overloaded | Distribute load across more generators or reduce per-generator concurrency. |
| Metrics show unexpected delay | 15-second aggregation window | This is expected behavior. Wait for at least two aggregation cycles before drawing conclusions. |
What's next
Test metrics: Full reference for all PTS metrics and their definitions.
Technical guide for performance testing: Best practices for designing and running stress tests.
Test analysis and tuning: Guidance on interpreting results and optimizing system performance.