Online visualization of billion-scale vector spatial data with 100 lines of code using
Visualize billions of spatial records in real time — no tile caching, no pre-processing pipeline, no GIS expertise required. GanosBase, the spatiotemporal engine in PolarDB for PostgreSQL (Compatible with Oracle), handles spatial indexing and rendering entirely inside the database. A few hundred lines of Python and JavaScript are enough to put a smooth, interactive map in front of your users.
Background
Traditionally, visualizing large-scale vector spatial data online requires pre-slicing data into cached tiles. This offline process raises a set of difficult questions before you can even start:
-
How long does slicing take, and which zoom levels are worth generating?
-
Is there enough disk space for the tile cache?
-
For real-time tiles, can the rendering response time meet performance requirements?
-
For small-scale maps, does tile size become a data-transfer bottleneck?
-
Can the front end handle the rendering load?
For data that changes frequently or that you need to explore quickly, this offline workflow is impractical. GanosBase solves the problem with a database-native fast visualization engine built around a novel index structure called the sparse vector pyramid (SVP).
How it works
SVP indexing bridges the database and the rendering pipeline. The index has two defining characteristics: fast and efficient.
Fast
-
Fast pyramid creation. GanosBase uses spatial indexing to segment data by spatial density, then builds a sparse index on top of that structure. Compared with traditional tiling workflows, this cuts computational work by 90%. A fully parallel processing model further accelerates creation so that even a dataset of 100 million land parcel polygons is indexed in 10 minutes.
-
Fast rendering. A visibility culling algorithm based on Z-order sorting filters out data that has no effect on the visual result, so the database returns only the geometry that actually matters for the current view. GanosBase outputs raster tiles in PNG format and vector tiles in Mapbox Vector Tile (MVT) format, achieving second-level response times even for 100 million land parcels.
Efficient
-
Disk footprint. The SVP index for 100 million land parcel records occupies only 5% of the original table size.
-
Developer effort. Control visualization output by adjusting parameters in a SQL call — no specialized GIS configuration needed.
Prerequisites
Before you begin, ensure that you have:
-
A PolarDB for PostgreSQL (Compatible with Oracle) cluster
-
Database credentials with permission to create extensions and run queries
-
Python 3 with Flask and Psycopg2 installed (
pip install flask psycopg2)
Install the extension
Install the GanosBase geometry pyramid extension before using any of the functions in this topic.
CREATE EXTENSION ganos_geometry_pyramid CASCADE;Build a sparse vector pyramid
Call ST_BuildPyramid on any existing vector table to create an SVP index. The function reads the table's spatial index to segment data by density and stores the pyramid metadata alongside the original table.
For the full function reference, see ST_BuildPyramid.
Example
The following statement creates a vector pyramid named points_geom for the geom column of the points table, with a logical tile size of 512.
points_geomis the name assigned to the pyramid. ThetileSizevalue is a spatial logic division unit, not a physical tile stored on disk.
ST_BuildPyramid('points', 'geom', 'gid', '{"name":"points_geom","tileSize":512}')Choose a tile type
GanosBase supports two output formats. Pick the one that matches your use case.
| Raster tiles (PNG) | Vector tiles (MVT) | |
|---|---|---|
| Rendering location | Server (database) | Client (WebGL) |
| Style changes | Update server-side parameters, re-request tile | Reconfigure client styles without a server call |
| Best for | Data management systems, server-enforced styling | Interactive maps with dynamic filtering or style toggling |
| GanosBase function | ST_AsPng |
ST_Tile |
| MIME type | image/png |
application/vnd.mapbox-vector-tile |
Get raster tiles
ST_AsPng renders a tile from the pyramid on demand and returns a PNG image. Basic styling — point size, line width, fill color, background — is passed as a JSON configuration, making this the right choice for lightweight data management dashboards.
For the full function reference, see ST_AsPng.
Example
The following statement retrieves the tile at coordinates z=1, x=2, y=1 from the points_geom pyramid, renders it with the given style, and returns a PNG image.
ST_AsPng('points_geom', '1_2_1','{"point_size": 5,"line_width": 2,"line_color": "#003399FF","fill_color": "#6699CCCC","background": "#FFFFFF00"}')Get vector tiles
ST_Tile returns tile data in MVT format using standard Tile Map Service (TMS) coordinates. Because MVT tiles are rendered client-side with WebGL, the client controls all styling — enabling dynamic, interactive maps with frameworks like Mapbox.
For the full function reference, see ST_Tile.
Example
The following statement retrieves the vector tile at z=1, x=2, y=1 from the points_geom pyramid in MVT format.
ST_Tile('points_geom', '1_2_1');Best practices
This section walks through a complete end-to-end setup using two sample datasets: polygon building data for raster tiles and point data for vector tiles.
Test data
| Dataset | Geometry type | Records | Used for |
|---|---|---|---|
buildings |
Polygon (MULTIPOLYGON) | 125 million | Raster tile demo |
points |
Point | 107,000 | Vector tile demo |
Sample rows:
-- buildings
gid|geom
---|----
  1|MULTIPOLYGON(((-88.066953 34.916114 0,-88.066704 34.916114 0,-88.066704 34.91602 0,-88.066953 34.91602 0,-88.066953 34.916114 0)))
  2|MULTIPOLYGON(((-87.924658 34.994797 0,-87.924791 34.99476 0,-87.924817 34.994824 0,-87.924685 34.994861 0,-87.924658 34.994797 0)))

-- points
id|geom
--|----
 1|POINT (113.5350205 22.1851929)
 2|POINT (113.5334245 22.1829781)
Architecture
The stack has three layers: the database server running GanosBase, a Python service layer that converts tile requests into SQL, and the browser client rendering the tiles.

Server-side code
The backend uses Flask to expose two tile endpoints and Psycopg2 to query the database. All tile fetching — whether raster or vector — follows the same pattern: convert a tile request into a SQL call, return the binary result.
Save the following code as Vector.py and start the server with python Vector.py. The service runs on port 5000.
# -*- coding: utf-8 -*-
# @File : Vector.py

import json
from psycopg2 import pool
from threading import Semaphore
from flask import Flask, jsonify, Response, send_from_directory
import binascii

# Connection parameters
CONNECTION = "dbname=<database_name> user=<user_name> password=<user_password> host=<host> port=<port>"


class ReallyThreadedConnectionPool(pool.ThreadedConnectionPool):
    """
    Connection pool for multithreading, improving response in high concurrency scenarios for map tiles.
    """
    def __init__(self, minconn, maxconn, *args, **kwargs):
        self._semaphore = Semaphore(maxconn)
        super().__init__(minconn, maxconn, *args, **kwargs)

    def getconn(self, *args, **kwargs):
        self._semaphore.acquire()
        return super().getconn(*args, **kwargs)

    def putconn(self, *args, **kwargs):
        super().putconn(*args, **kwargs)
        self._semaphore.release()


class VectorViewer:
    def __init__(self, connect, table_name, column_name, fid):
        self.table_name = table_name
        self.column_name = column_name
        # Create a connection pool
        self.connect = ReallyThreadedConnectionPool(5, 10, connect)
        # Convention for pyramid table name
        self.pyramid_table = f"{self.table_name}_{self.column_name}"
        self.fid = fid
        self.tileSize = 512
        # self._build_pyramid()

    def _build_pyramid(self):
        """Create pyramid"""
        config = {
            "name": self.pyramid_table,
            "tileSize": self.tileSize
        }
        sql = f"select st_BuildPyramid('{self.table_name}','{self.column_name}','{self.fid}','{json.dumps(config)}')"
        self.poll_query(sql)

    def poll_query(self, query: str):
        pg_connection = self.connect.getconn()
        pg_cursor = pg_connection.cursor()
        pg_cursor.execute(query)
        record = pg_cursor.fetchone()
        pg_connection.commit()
        pg_cursor.close()
        self.connect.putconn(pg_connection)
        if record is not None:
            return record[0]


class PngViewer(VectorViewer):
    def get_png(self, x, y, z):
        # Default parameters
        config = {
            "point_size": 5,
            "line_width": 2,
            "line_color": "#003399FF",
            "fill_color": "#6699CCCC",
            "background": "#FFFFFF00"
        }
        # When using psycopg2, it is more efficient to return binary data as a hexadecimal string
        sql = f"select encode(st_aspng('{self.pyramid_table}','{z}_{x}_{y}','{json.dumps(config)}'),'hex')"
        result = self.poll_query(sql)
        # Only when returning as a hexadecimal string is it necessary to convert it back
        result = binascii.a2b_hex(result)
        return result


class MvtViewer(VectorViewer):
    def get_mvt(self, x, y, z):
        # When using psycopg2, it is more efficient to return binary data as a hexadecimal string
        sql = f"select encode(st_tile('{self.pyramid_table}','{z}_{x}_{y}'),'hex')"
        result = self.poll_query(sql)
        # Only when returning as a hexadecimal string is it necessary to convert it back
        result = binascii.a2b_hex(result)
        return result


app = Flask(__name__)


@app.route('/vector')
def vector_demo():
    return send_from_directory("./", "Vector.html")

# Define table name, field name, etc.


pngViewer = PngViewer(CONNECTION, 'usbf', 'geom', 'gid')


@app.route('/vector/png/<int:z>/<int:x>/<int:y>')
def vector_png(z, x, y):
    png = pngViewer.get_png(x, y, z)
    return Response(
        response=png,
        mimetype="image/png"
    )


mvtViewer = MvtViewer(CONNECTION, 'points', 'geom', 'gid')

@app.route('/vector/mvt/<int:z>/<int:x>/<int:y>')
def vector_mvt(z, x, y):
    mvt = mvtViewer.get_mvt(x, y, z)
    return Response(
        response=mvt,
        mimetype="application/vnd.mapbox-vector-tile"
    )


if __name__ == "__main__":
    app.run(port=5000, threaded=True)
Replace the placeholders in CONNECTION with your actual database credentials:
| Placeholder | Description |
|---|---|
<database_name> |
Name of your database |
<user_name> |
Database user |
<user_password> |
Database password |
<host> |
Database host address |
<port> |
Database port |
Client-side code
The frontend uses Mapbox GL JS to render both raster and vector tile layers. Create Vector.html in the same directory as Vector.py, then open http://localhost:5000/vector once the server is running.
<!DOCTYPE html>
<html>
  <head>
    <meta charset="UTF-8" />
    <title></title>
    <link
      href="https://cdn.bootcdn.net/ajax/libs/mapbox-gl/1.13.0/mapbox-gl.min.css"
      rel="stylesheet"
    />
  </head>
  <script src="https://cdn.bootcdn.net/ajax/libs/mapbox-gl/1.13.0/mapbox-gl.min.js"></script>
  <script src="https://cdn.bootcdn.net/ajax/libs/axios/0.21.0/axios.min.js"></script>
  <body>
    <div id="map" style="height: 100vh" />
    <script>
      const sources = {
        osm: {
          type: "raster",
          tiles: ["https://b.tile.openstreetmap.org/{z}/{x}/{y}.png"],
          tileSize: 256,
        },
      };
      const layers = [
        {
          id: "base_map",
          type: "raster",
          source: "osm",
          layout: { visibility: "visible" },
        },
      ];
      const map = new mapboxgl.Map({
        container: "map",
        style: { version: 8, layers, sources },
      });
      map.on("load", async () => {
        map.resize();

        // Add raster tile data source
        map.addSource("png_source", {
          type: "raster",
          minzoom: 1,
          tiles: [`${window.location.href}/png/{z}/{x}/{y}`],
          tileSize: 512,
        });
        // Add raster tile layer
        map.addLayer({
          id: "png_layer",
          type: "raster",
          layout: { visibility: "visible" },
          source: "png_source",
        });

        // Add vector tile data source
        map.addSource("mvt_source", {
          type: "vector",
          minzoom: 1,
          tiles: [`${window.location.href}/mvt/{z}/{x}/{y}`],
          tileSize: 512,
        });

        // Add vector tile layer and apply styles
        map.addLayer({
          id: "mvt_layer",
          paint: {
            "circle-radius": 4,
            "circle-color": "#6699CC",
            "circle-stroke-width": 2,
            "circle-opacity": 0.8,
            "circle-stroke-color": "#ffffff",
            "circle-stroke-opacity": 0.9,
          },
          type: "circle",
          source: "mvt_source",
          "source-layer": "points_geom",
        });

      });
    </script>
  </body>
</html>
Visualization
Dynamic visualization effect of vector tiles
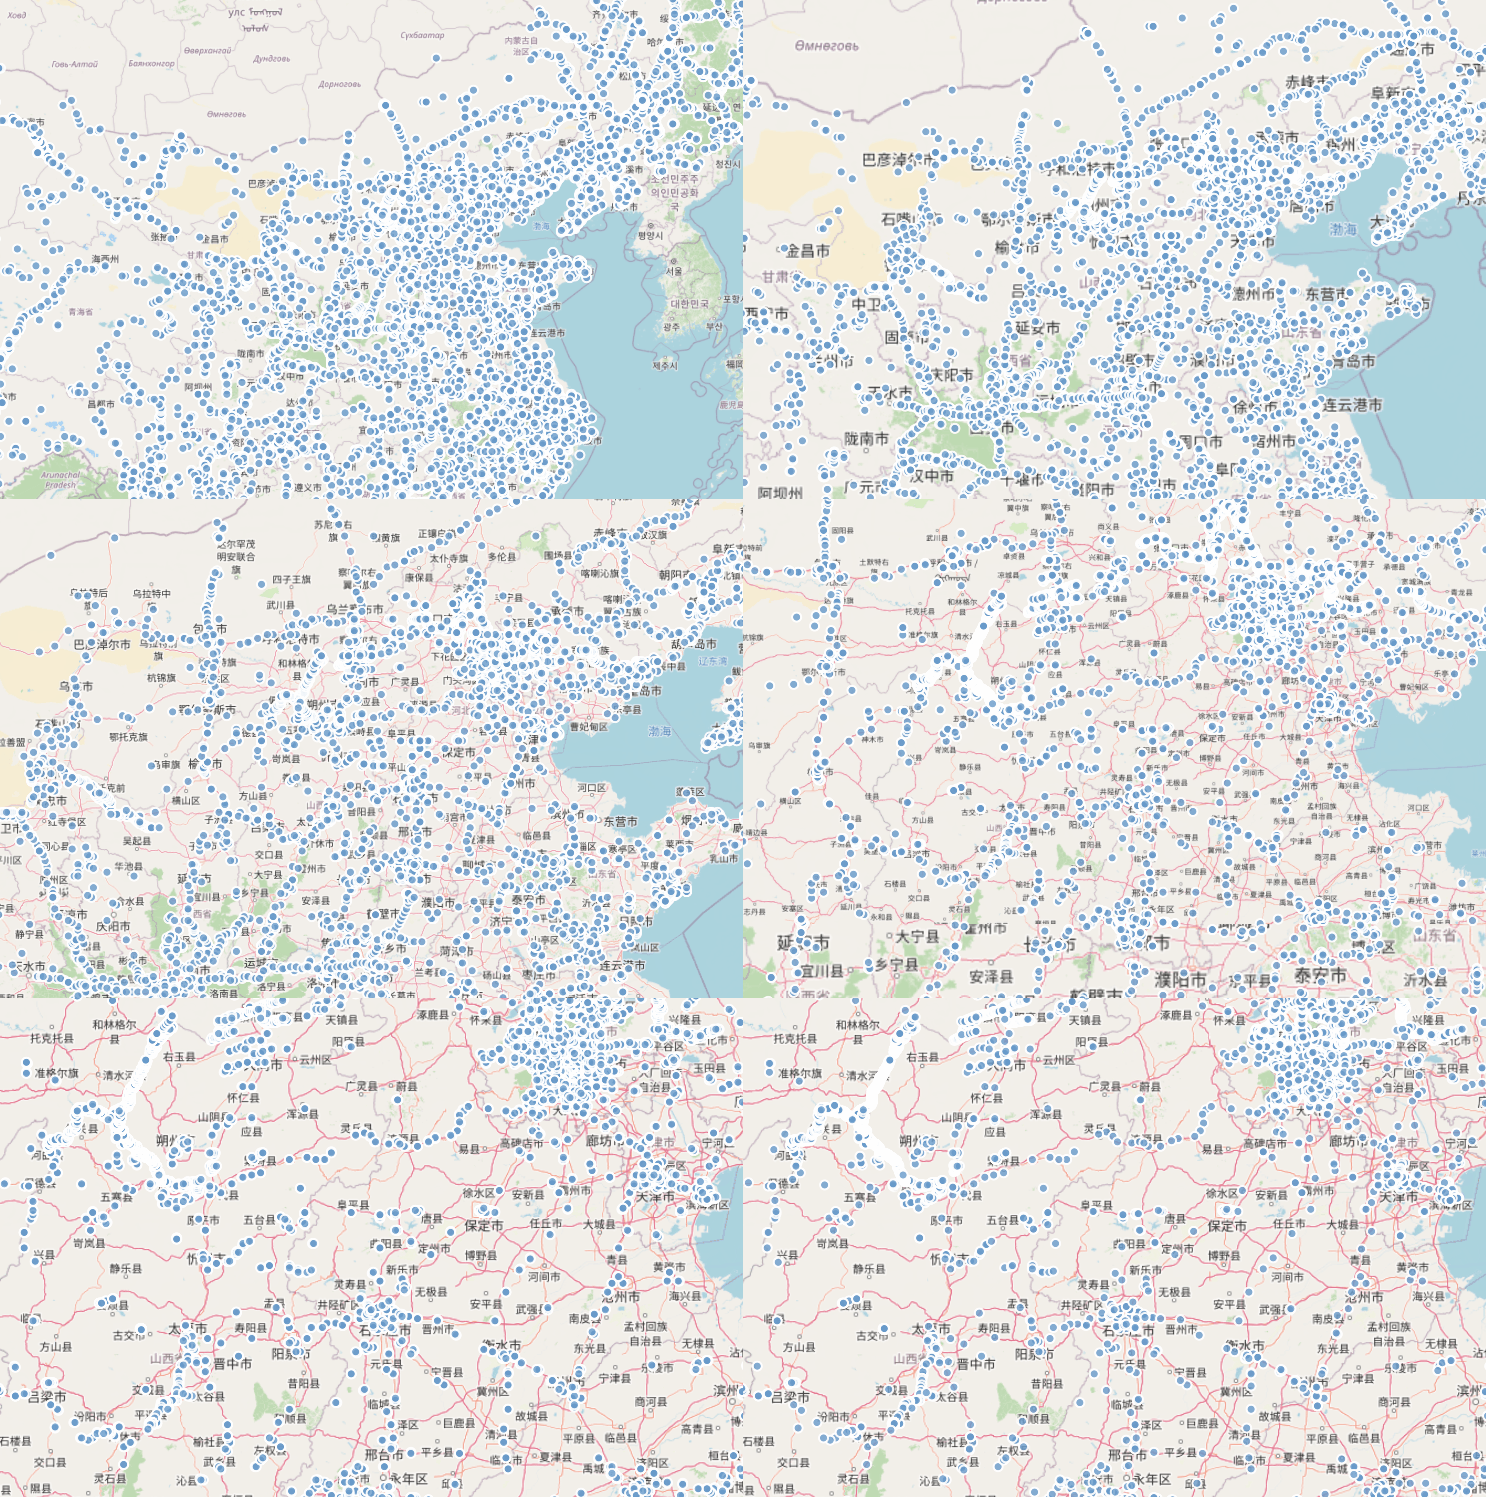
Adjust visualization styles on the client side by modifying the layer paint properties:
{
  "circle-radius": 4,
  "circle-color": "#000000",
  "circle-stroke-width": 2,
  "circle-opacity": 0.3,
  "circle-stroke-color": "#003399",
  "circle-stroke-opacity": 0.9
}
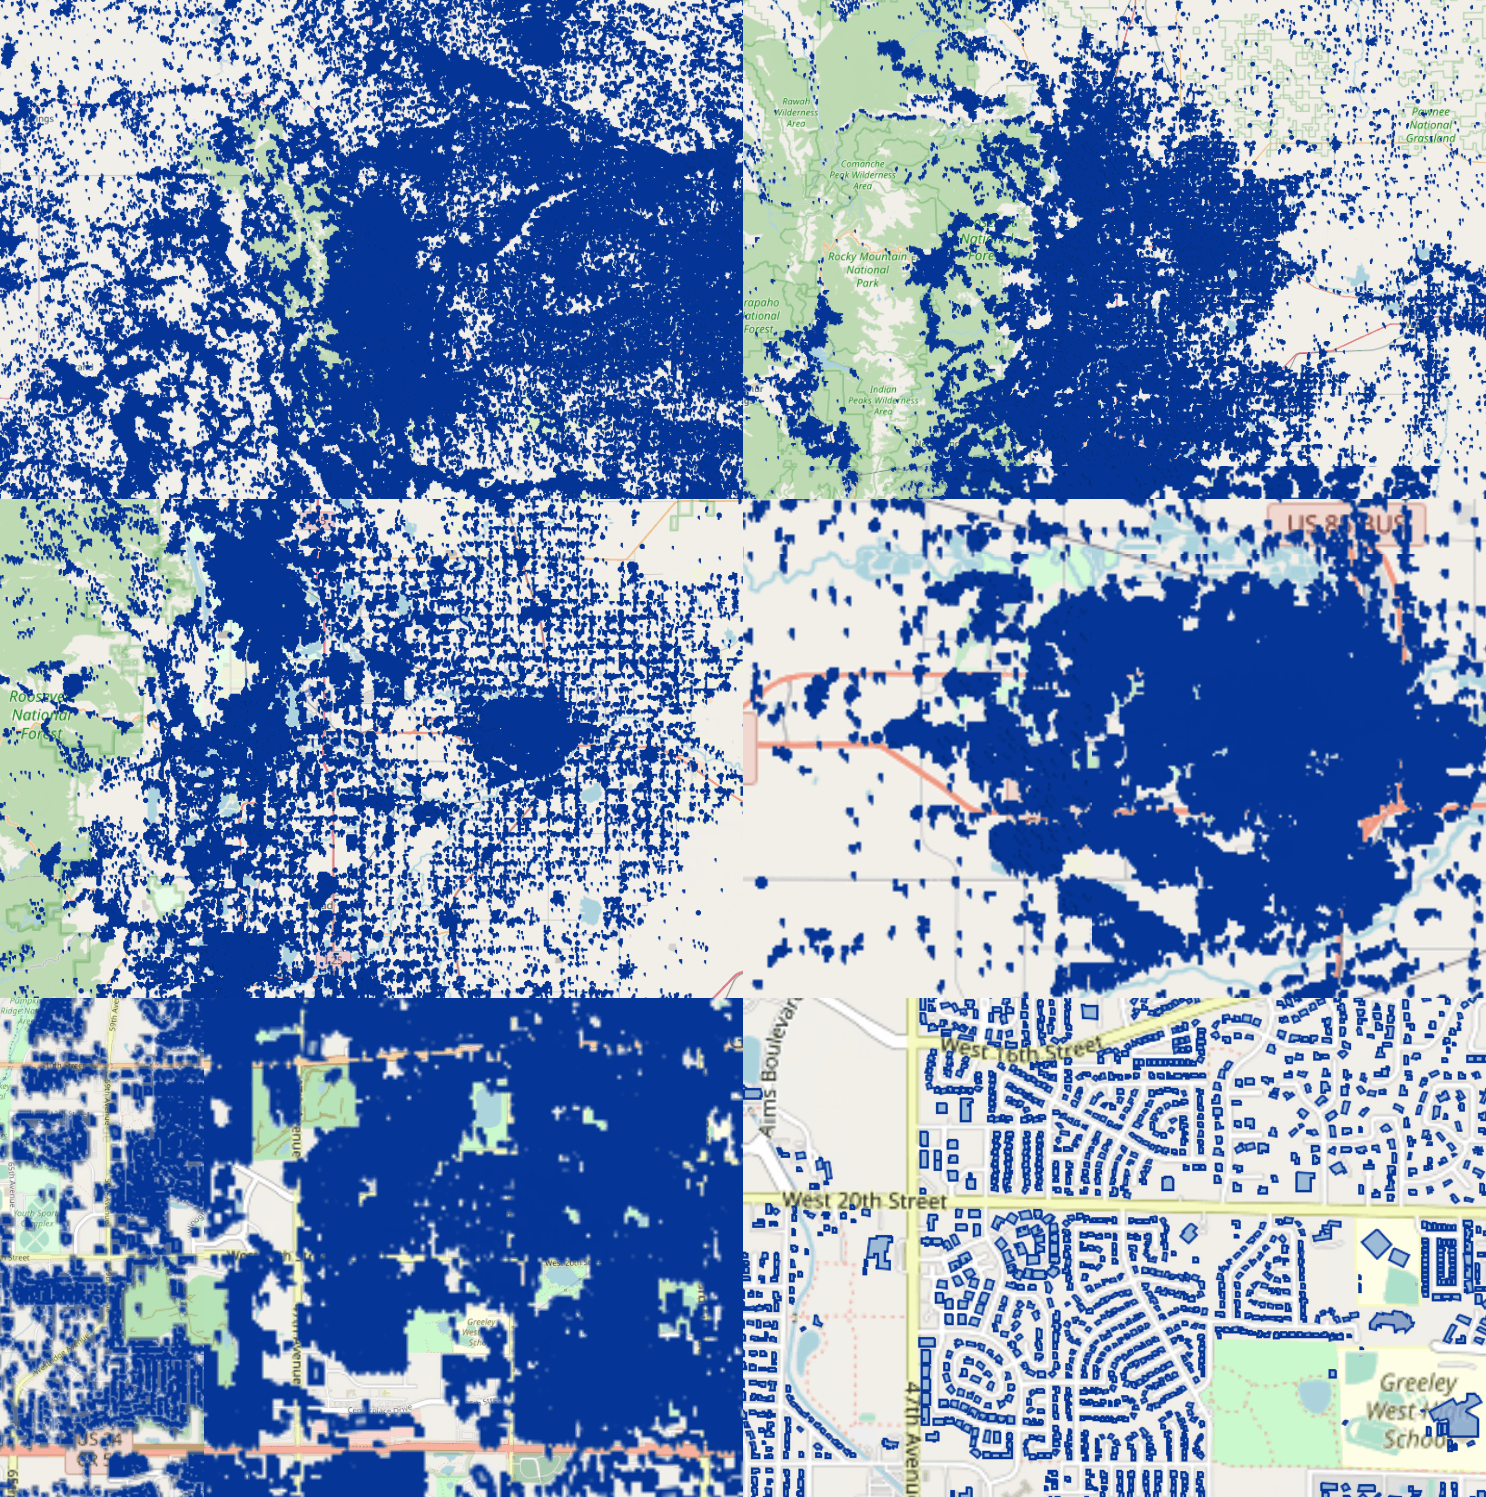
Dynamic visualization effect of raster tiles

Integrate with pgAdmin
pgAdmin, the standard PostgreSQL management tool, includes built-in support for viewing vector data. Without fast rendering, it can only display individual objects or small result sets — global browsing of a large dataset is not feasible.
After building an SVP index, pgAdmin can load and browse the full dataset immediately. This gives you a quick overview of data quality and coverage right after import, without leaving your database management workflow.
What's next
Beyond visualization, use the server-side capabilities of GanosBase for spatial querying and analysis on the same dataset — including attribute lookup, spatial selection, and spatial analysis.
-
Usage notes — additional configuration and usage details for GanosBase fast visualization
-
PolarDB cluster buy page — activate PolarDB to get started