Build end-to-end monitoring for a website architecture with CloudMonitor, covering ECS, RDS, Server Load Balancer (SLB), site probes, and alerting.
Background
Alibaba Cloud offers products such as ECS, Application Load Balancer (ALB), NAT Gateway, IPv6 Gateway, OSS, and RDS. CloudMonitor lets you build a unified monitoring system across all of them.
CloudMonitor is an enterprise-grade monitoring solution that covers infrastructure monitoring, network probes, and business monitoring based on events, custom metrics, and logs. It improves service availability and reduces O&M costs.
Prerequisites
Before you set up CloudMonitor:
Verify the CloudMonitor agent is running on your ECS instances. If installation fails, install the agent manually. See CloudMonitor agent installation guide.
Create alert contacts and contact groups. See Create an alert contact or an alert contact group.
Overall approach
The following example shows how to build monitoring for a website that uses ECS, RDS, and SLB.

For the website architecture shown in the preceding figure, the approach is as follows.
Monitor and alert on ECS instances.
Monitor and alert on RDS for MySQL databases.
Monitor and alert on SLB.
Set up site monitoring.
Probe page performance and user experience.
Manage system events.
Create a custom monitoring dashboard.
Detailed steps
The following sections show how to implement each step with CloudMonitor.
Monitor ECS instances
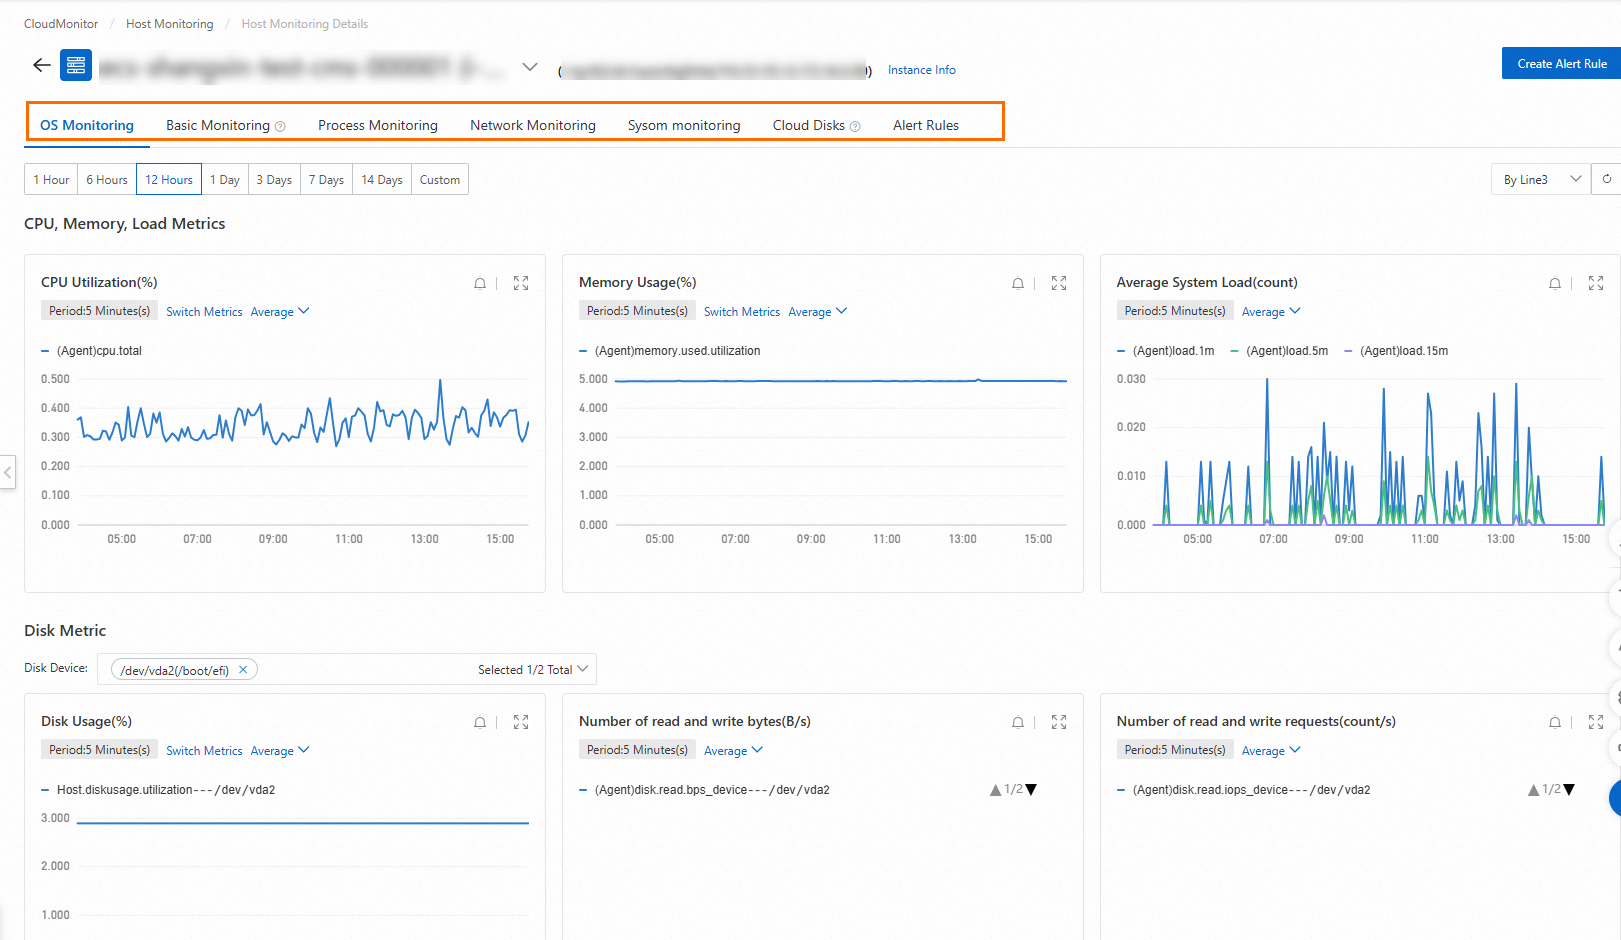
View ECS monitoring metrics
CloudMonitor displays monitoring metrics for ECS instances.
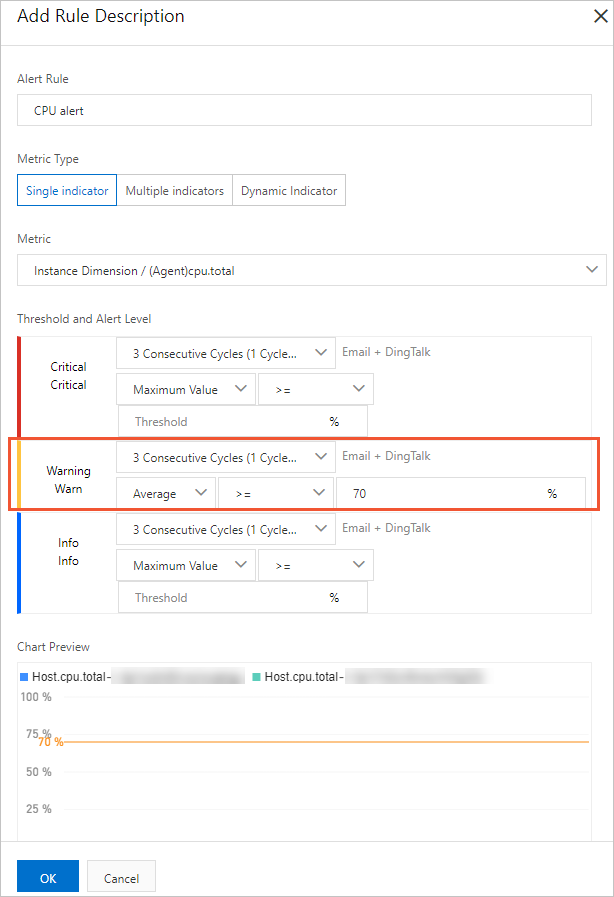
Alert rule configuration example
Set alert thresholds carefully. A threshold too low causes frequent alerts; a threshold too high delays your response.
Customize alert levels and metric thresholds for your ECS instances. For example, set the CPU alert threshold to 70% and trigger an alert after three consecutive breaches to reserve processing headroom.
Monitor RDS for MySQL instances
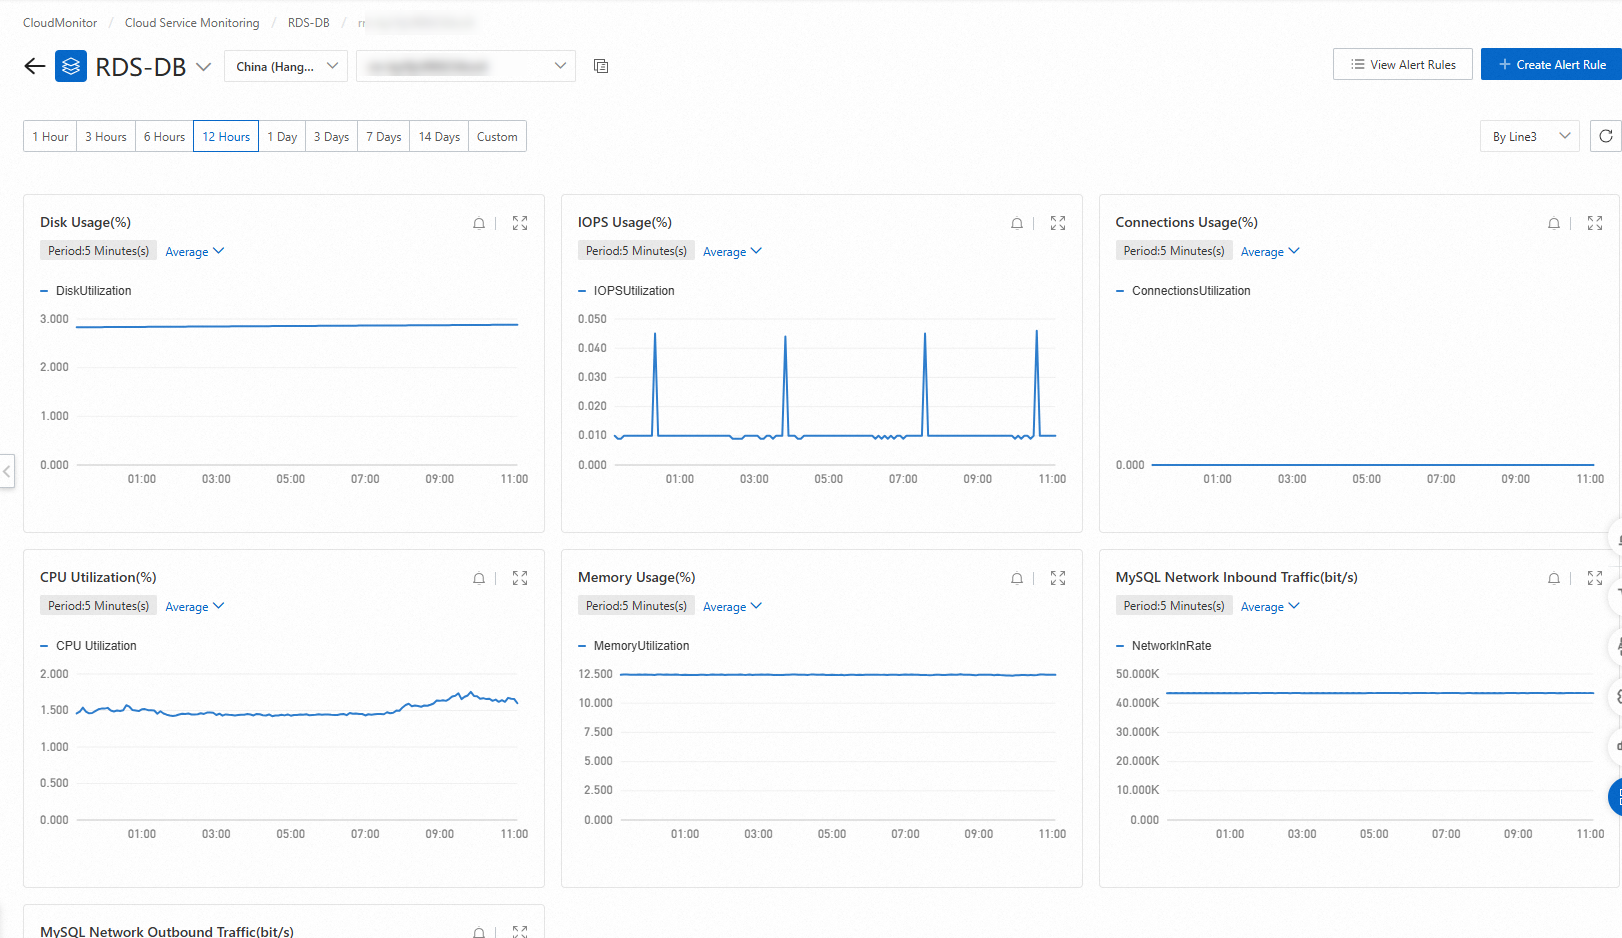
View RDS monitoring metrics
CloudMonitor displays monitoring metrics for RDS for MySQL.
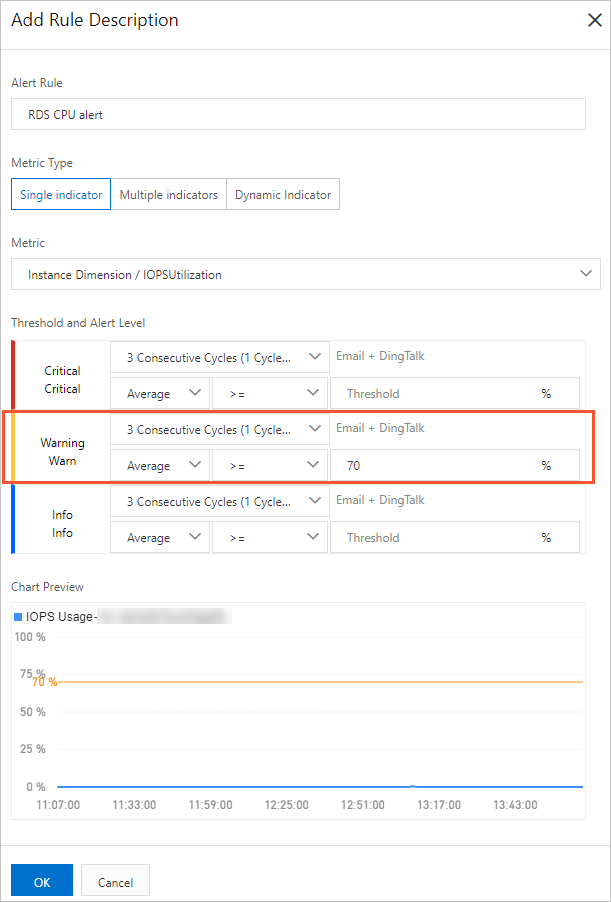
Alert rule configuration example
Customize alert levels and metric thresholds for your RDS instances. For example, set the CPU utilization alert threshold to 70% and trigger an alert after three consecutive breaches. You can also set alert rules for other metrics, such as disk usage, IOPS utilization, and connections.
Monitor SLB
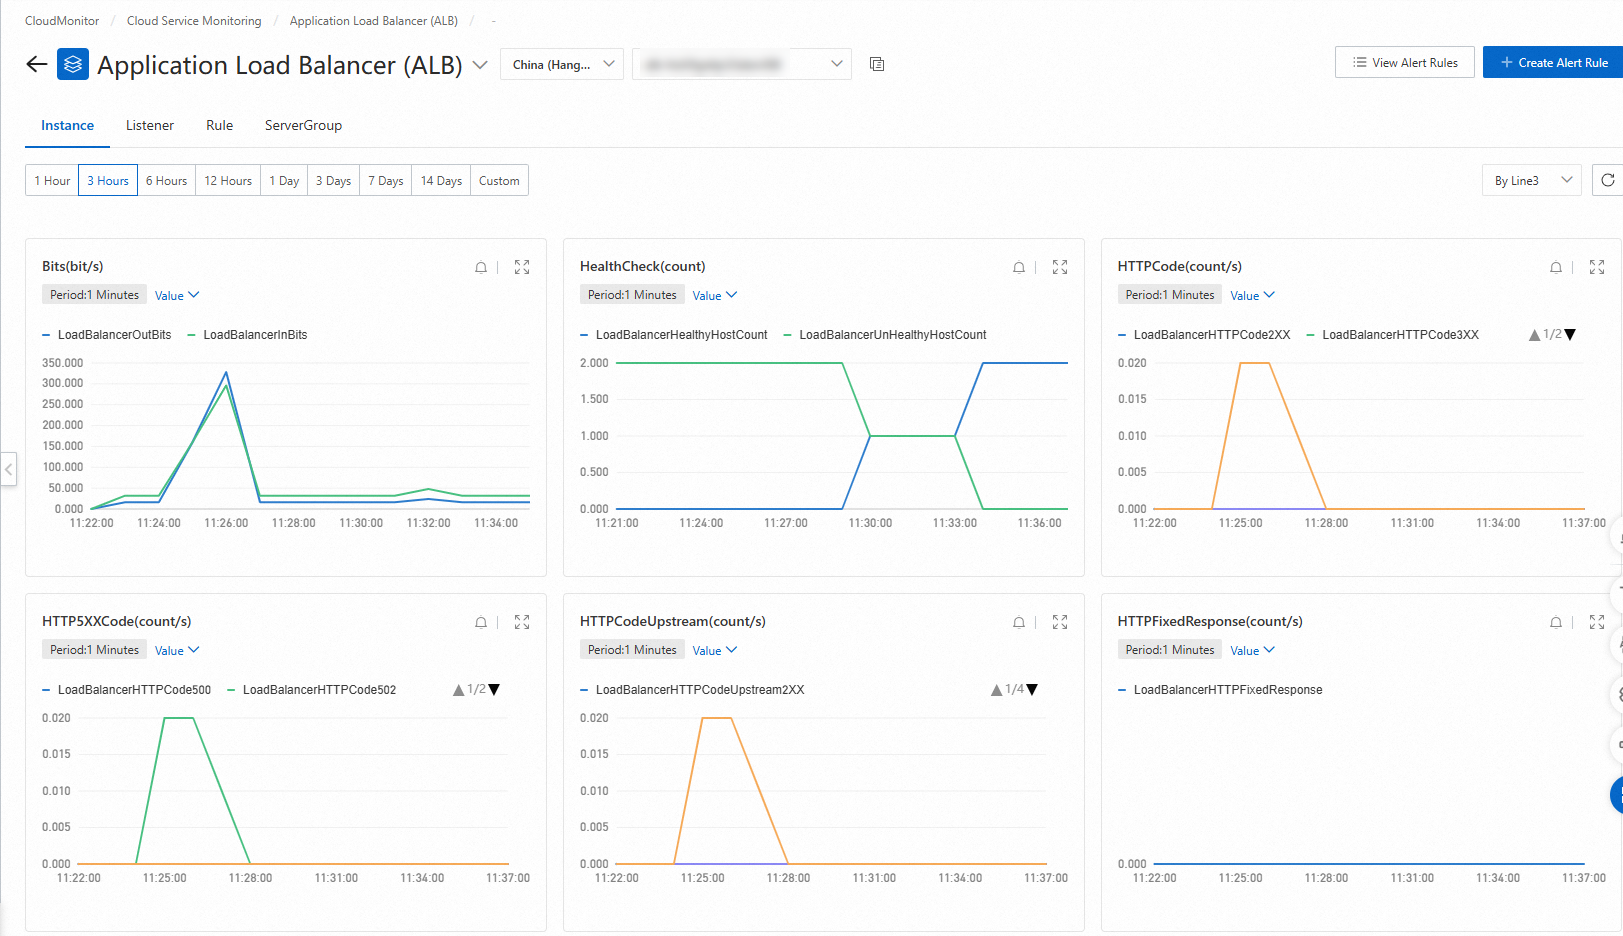
View SLB monitoring metrics
CloudMonitor displays monitoring metrics for SLB.
Alert rule configuration example
Customize alert levels and metric thresholds for your SLB instances. Enable health checks for SLB first, then configure alert rules. For example, set the SLB bandwidth alert threshold to 7 Mbit/s.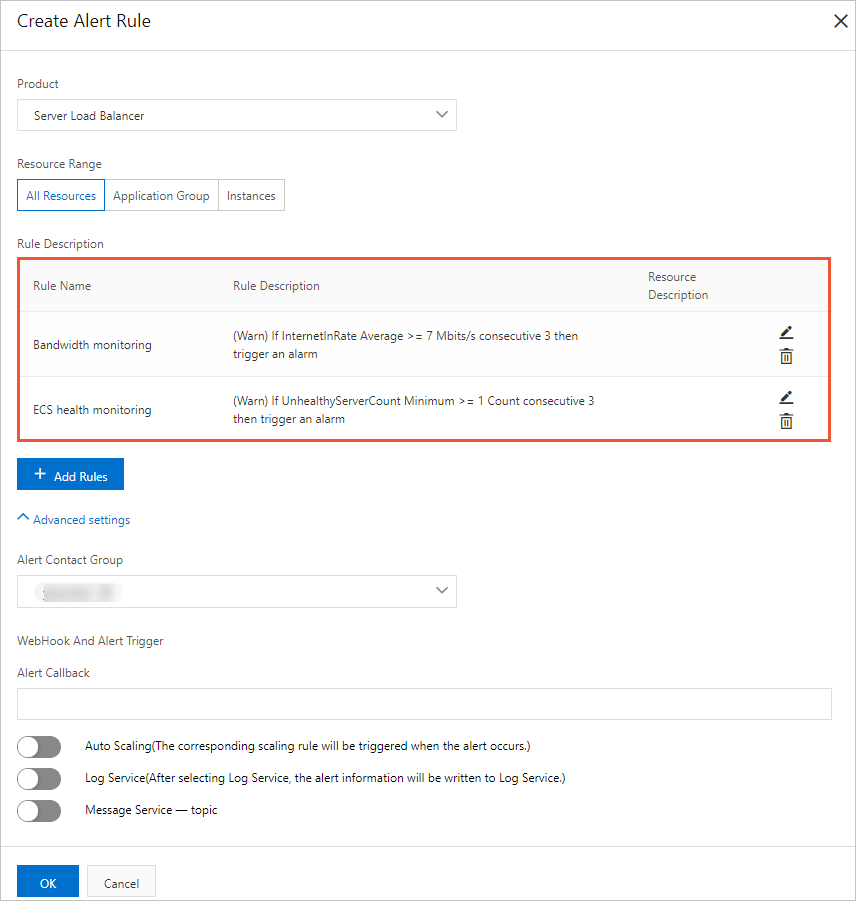
See Cloud service monitoring for details on viewing metrics and configuring alert rules.
Set up site monitoring
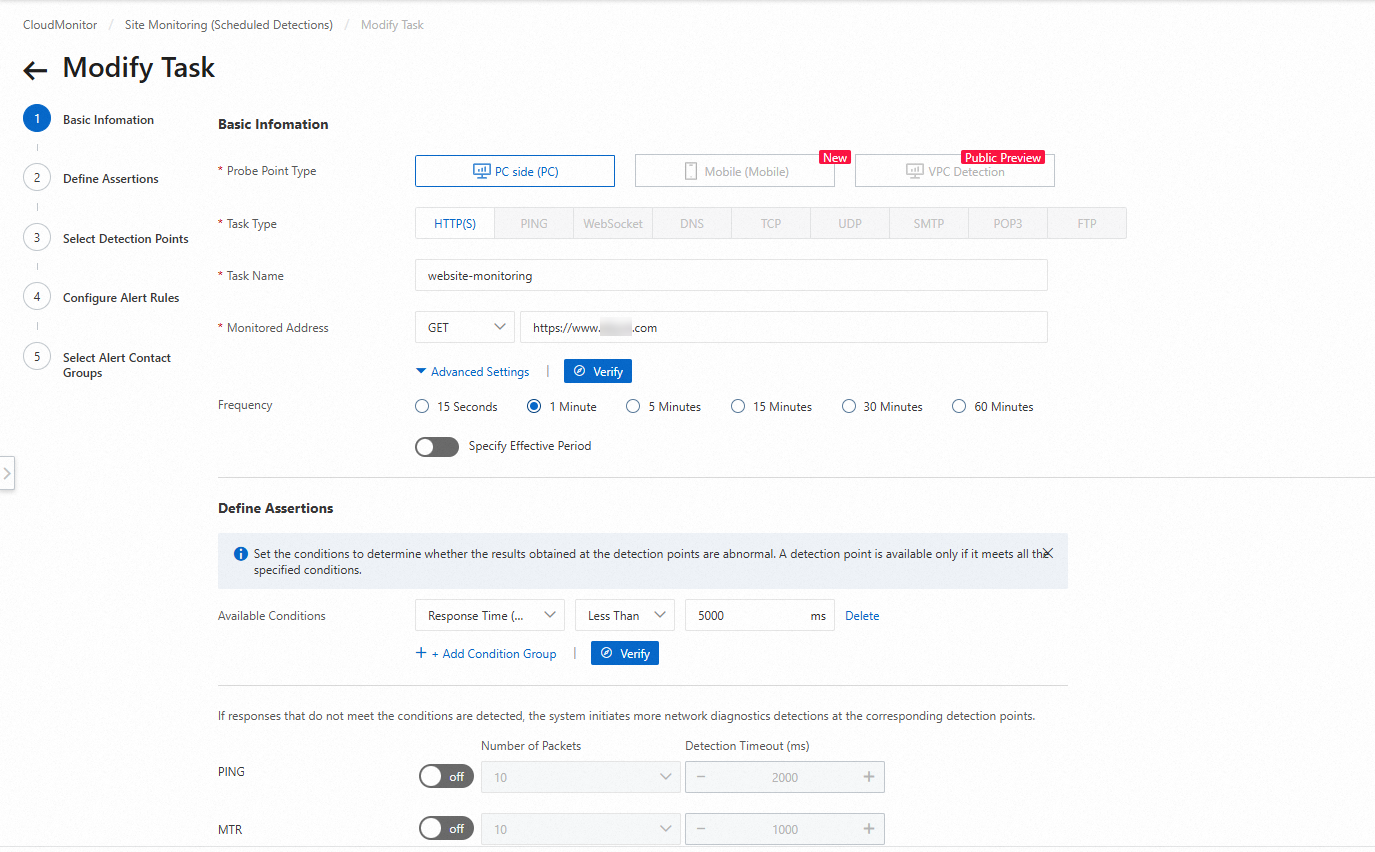
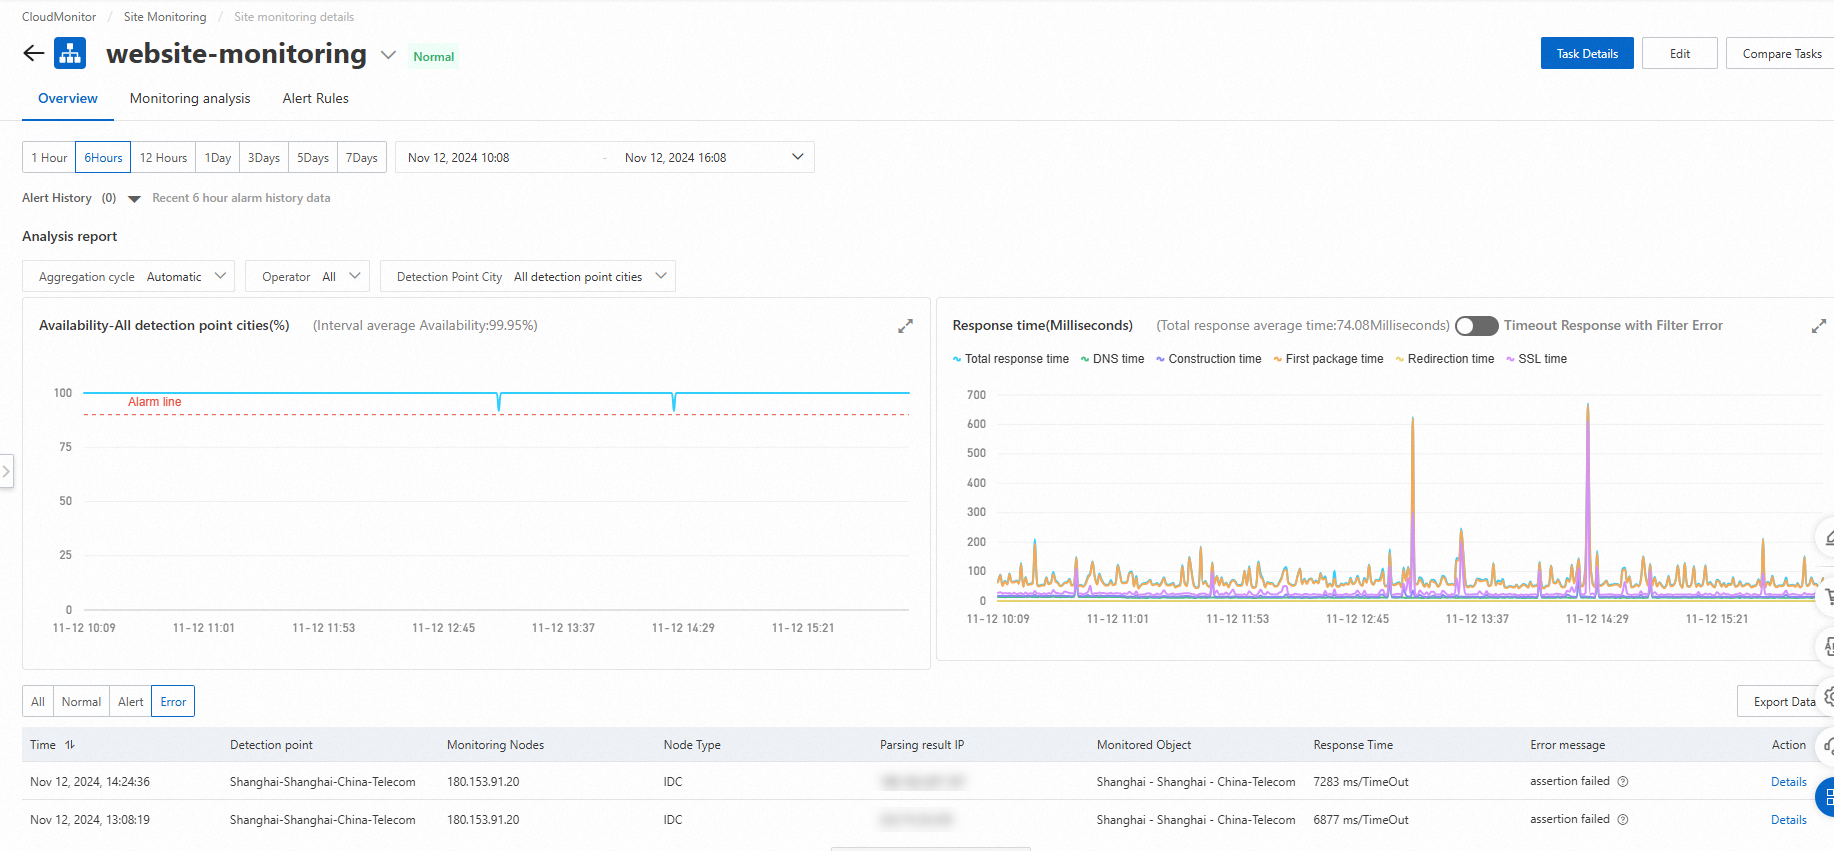
Site monitoring simulates real user access to test business availability and help troubleshoot issues on the external-facing layer of your cloud resources.
Site monitoring configuration example
View site monitoring example
Probe the performance and experience of a target page
Configure browser probes to analyze the network quality of your website for development, optimization, and O&M. See Probe the performance and experience of a target page.
Manage system events
Event monitoring aggregates system events across cloud products, helping you track operational status and diagnose failures. See Supported cloud products and their system events.
Create a custom monitoring dashboard
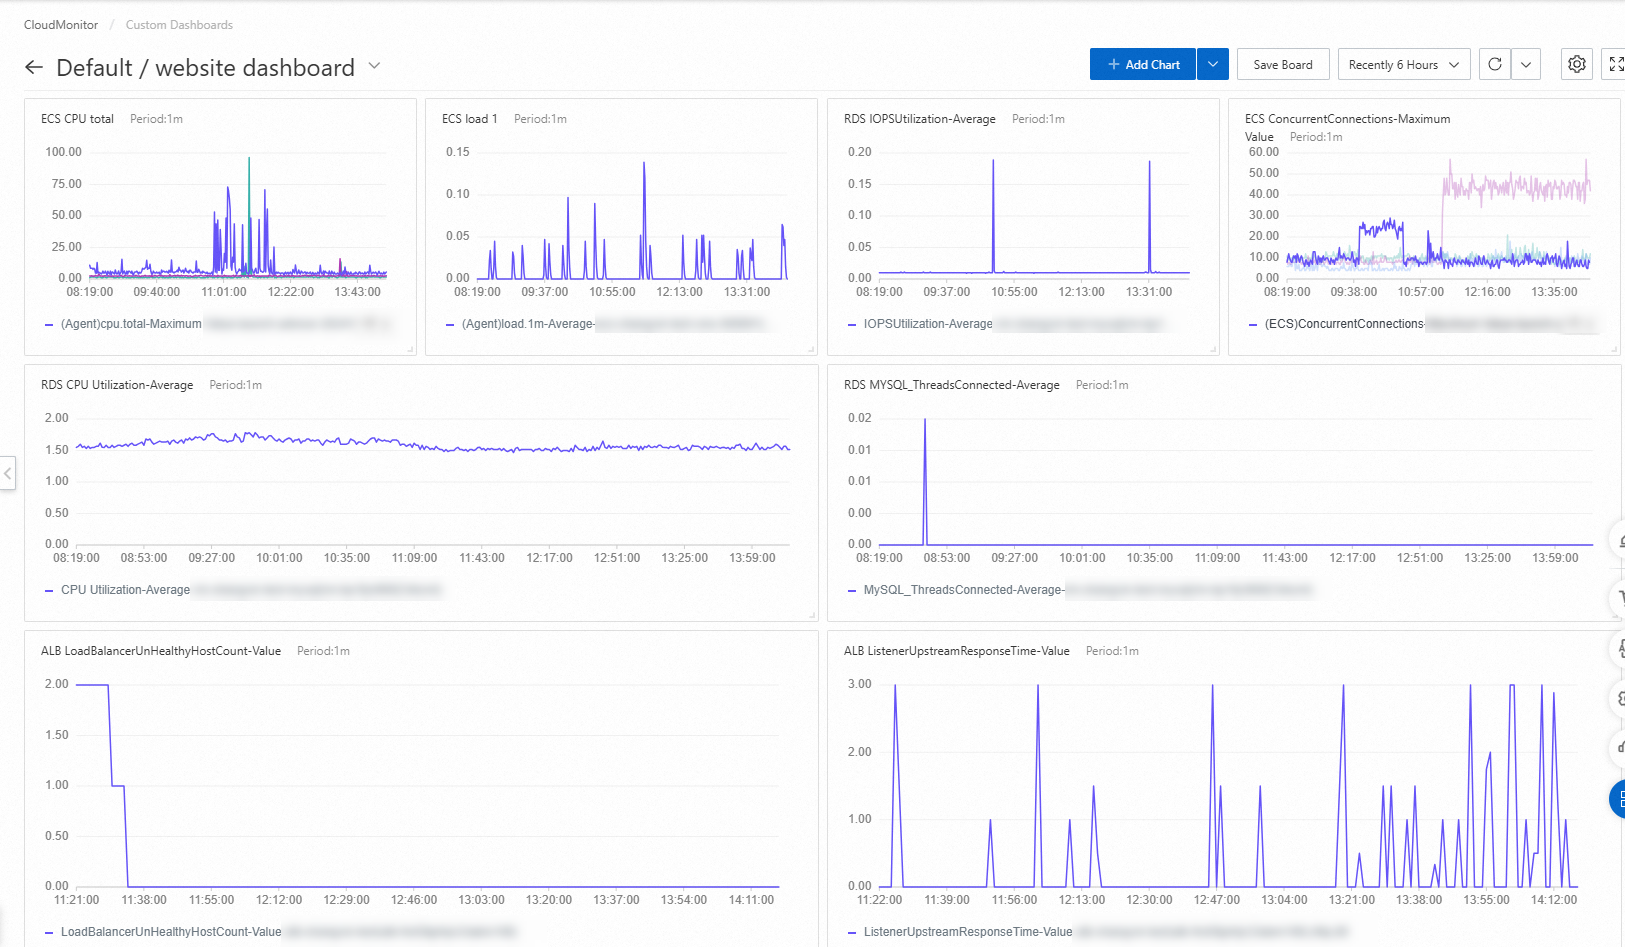
Use the CloudMonitor Dashboard feature to view core metrics of all cloud products on a single page. See Custom monitoring overview.
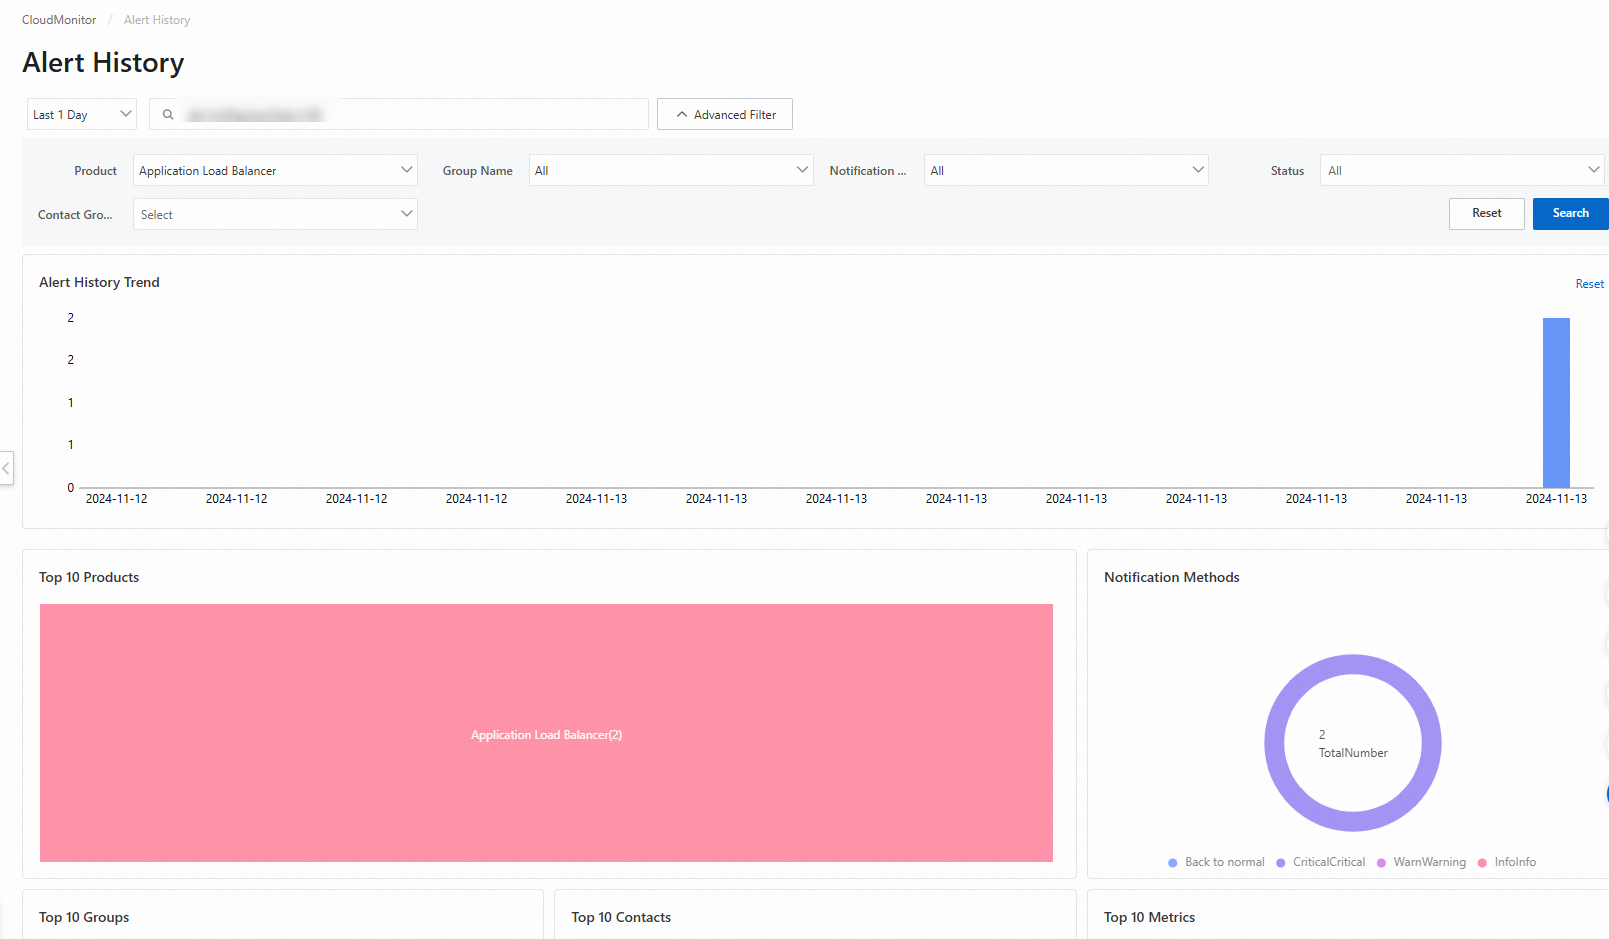
View monitoring alerts
When a metric meets the alert conditions, CloudMonitor sends notifications to configured channels, such as mobile phone, email, and DingTalk. You can also view historical alerts in the CloudMonitor console.