When your data pipelines have committed delivery times, a missed deadline can trigger downstream failures and SLA violations. Baseline instances let you track whether each pipeline will meet its committed delivery time. Each time a baseline runs, DataWorks calculates the estimated completion time for every node, monitors progress against the committed time, and alerts your team when a delivery deadline is at risk.
Prerequisites
Before you begin, make sure that:
Your DataWorks workspace is on Standard Edition or a higher edition. Baseline instances are not available on lower editions. To upgrade, see Differences among DataWorks editions.
The baseline is enabled. Baseline instances are only generated for enabled baselines. To enable a baseline, see Manage baselines.
View baseline instances
Log on to the DataWorks console. In the top navigation bar, select the region. In the left-side navigation pane, choose Data Development and O\&M > Operation Center. Select the workspace from the drop-down list, then click Go to Operation Center.
In the left-side navigation pane, choose Node Alarm > Smart Baseline.
Click the Baseline Instances tab.
Filter baseline instances
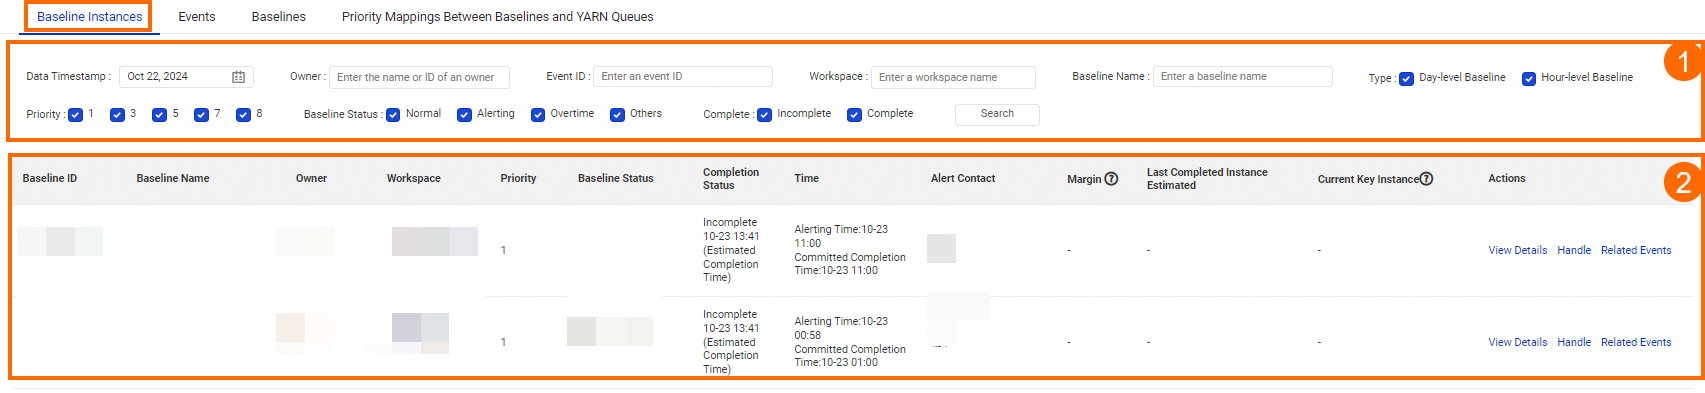
Use the filters at the top of the page (area 1 in the screenshot) to narrow the list by:
Data Timestamp, Owner, Event ID, Workspace, Baseline Name, Type, Priority, and Baseline Status.
Baseline instance list
The list (area 2 in the screenshot) displays the baseline instances that match your filters. Each row shows:
Baseline Name, Owner, Workspace, Priority, Baseline Status, Completion Status, Time, Alert Contact, Margin Thres, Last Completed Instance Estimated, and Current Key Instance.
From the Actions column, click:
View Details — open the instance details page
Handle — record your handling of the alert
View Gantt Chart — visualize node progress on a Gantt chart
Related Events — view events linked to this baseline instance
Baseline status
Baseline Status shows whether the baseline is on track to meet its committed completion time.
| Status | What it means | What to do |
|---|---|---|
| Normal | All nodes finished before the alerting time. | No action needed. |
| Alerting | One or more nodes are still running after the alerting time but before the committed time. | Investigate the current key instance and resolve issues before the committed time. |
| Overtime | One or more nodes are still running after the committed time. | The data delivery SLA has been breached. Escalate and resolve immediately. |
| Others | All nodes are suspended, or no nodes are associated with the baseline. | Check whether the baseline is configured correctly and has active nodes. |
Key fields
Last Completed Instance Estimated is the node instance estimated to finish last in the baseline — the one determining the overall completion time.
Current Key Instance is the first node instance in the key path that is not running as expected. A node instance is considered not running as expected when it is in one of these states: Pending (Ancestor), Pending (Resource), Pending (Schedule), Running, or Failed.
Margin Thres (Margin Threshold) is the time buffer remaining before the baseline enters an alert state. It shows how much time your O&M team has to act before a deadline is missed.
How alerting time, margin threshold, and committed completion time relate:
[Alerting time] ----[Margin Thres]----> [Committed completion time]
      ^                                           ^
  DataWorks starts alerting                 Data delivery deadline
How Margin Thres is calculated:
If the node has finished:
  Margin Thres = Alerting time − Actual completion time of the node

If the node has not finished:
  Margin Thres = Alerting time − Estimated completion time of the node
When Margin Thres is negative, the baseline is in Alerting or Overtime state.
Example: If the alerting time is 07:30 and a node's estimated completion time is 07:45, Margin Thres = 07:30 − 07:45 = −15 minutes, and the baseline enters Alerting or Overtime state.
View baseline instance details
On the Baseline Instances tab, find the baseline instance and click View Details in the Actions column.
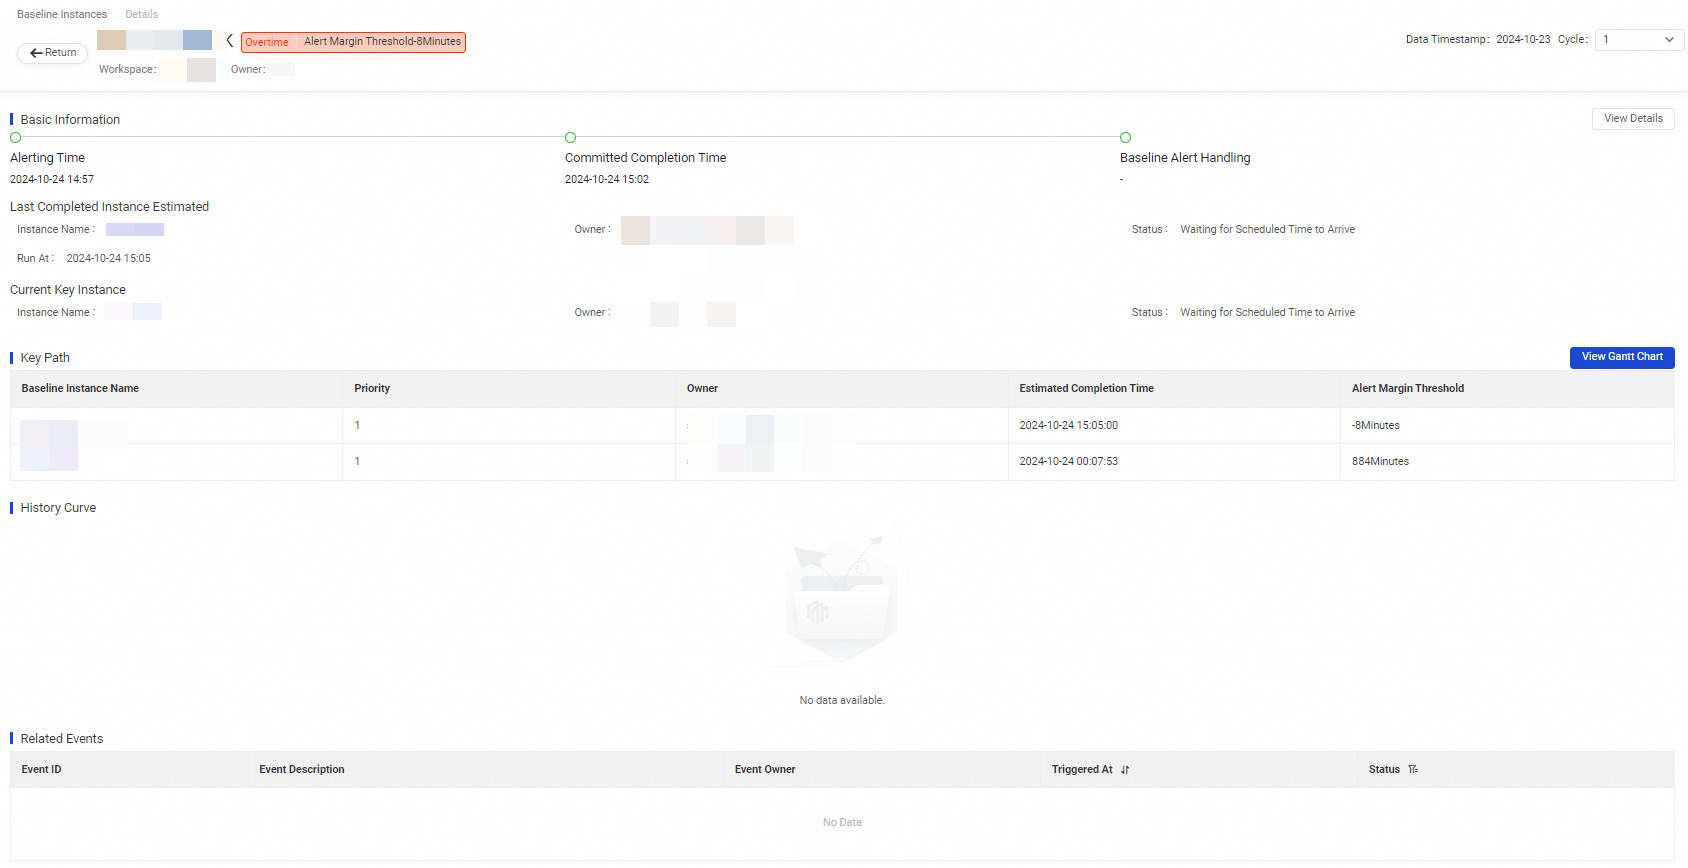
Basic information
The Basic Information section shows:
Committed Completion Time — the latest time by which all nodes in the baseline must finish running (your data delivery deadline).
Alerting Time — calculated as
Committed completion time − Alert margin threshold. This is the point at which DataWorks starts alerting if nodes are still running.Last Completed Instance Estimated — the node instance estimated to finish last in the baseline.
Current Key Instance — the first node instance in the key path that is not running as expected.
Baseline Alert Handling — the person responsible for handling the current baseline alert.
How committed time, alerting time, and margin threshold relate:
[Alerting time] ----[Alert margin threshold]----> [Committed completion time]
      ^                                                       ^
  DataWorks starts alerting                        Data delivery deadline
The alert margin threshold is the buffer you configure to give your O&M team time to respond before the committed time is missed. For more details on how DataWorks uses this threshold, see Core logic: baseline alert.
For hour-level baselines, change the cycle in the upper-right corner of the details page.
Key path
The Key Path tab shows the node instances in the critical path — the sequence of nodes blocking data generation. Switch between list view and Gantt chart view. The Gantt chart shows both the current status and the historical status of nodes in the key path.
For details on how DataWorks identifies the key path, see Core logic: key path and key instance.
History curve
The History Curve tab shows the completion status of nodes in the baseline over a historical period, so you can identify recurring delay patterns.
Related events
The Related Events tab lists the events preventing nodes from completing on time. Events are classified as Error or Slow. For definitions of event types, see Overview.
FAQ
Why is a baseline in the Empty Baseline state?