When an instance doesn't run as expected, Intelligent Diagnosis pinpoints the root cause — whether it's a blocked upstream dependency, a scheduling time that hasn't arrived, insufficient resource group capacity, or a code execution error.
How it works
Whether an instance runs on time depends on four factors: the scheduling times of both the current node and its ancestor nodes, when ancestor instances finish running, and how much capacity remains in the resource group.
Intelligent Diagnosis walks you through these four factors in sequence on the Running Details tab. Each step confirms a precondition for the next, so work through them in order.
Instance states
In Operation Center, status icons show where an instance is in its lifecycle and whether it needs attention.
| State | Requires action? | Description |
|---|---|---|
| Run Successfully | No | The instance completed normally. |
| Not run | Check ancestors | The instance hasn't started. Usually blocked by an upstream dependency. |
| Failed To Run | Yes | The instance ran but encountered an error. Check the Execution step. |
| Running | No | The instance is currently executing. |
| Wait time | Yes | The instance is waiting — for ancestors, for its scheduled time, or for resources. |
| Freeze | Yes | The instance is frozen. Contact the node owner to unfreeze it. |
For details on reading status icons, see View log data.
If an ancestor instance has been in the Running state for an unusually long time, the cause depends on the node type. For non-batch synchronization nodes, check the run logs to find the cause. For batch synchronization nodes, the likely cause is resource contention in the resource group or slow code execution. See How to troubleshoot long execution duration in a batch synchronization node.
Prerequisites
Before you begin, make sure that:
Auto triggered instances have been generated for nodes. After you commit and deploy an auto triggered node, DataWorks generates instances based on the Instance Generation Mode parameter configured in DataStudio.
Open the Intelligent Diagnosis page
Intelligent Diagnosis is available for any instance that isn't running as expected — auto triggered node instances, data backfill instances, and test instances.
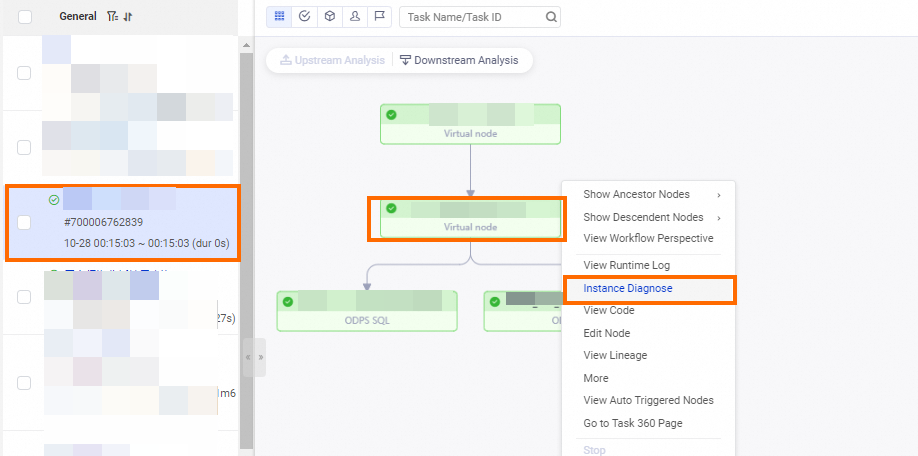
To open the diagnosis page, locate the instance in Operation Center, right-click it, and select Instance Diagnose.
Diagnose an instance
On the Running Details tab, Intelligent Diagnosis provides four sequential checks and one optional monitoring step.
| Step | What to check | Where to find it |
|---|---|---|
| 1. Check ancestor instance status | Whether all upstream dependencies have completed | Upstream Nodes step on the Running Details tab |
| 2. Check the scheduling time | Whether the configured scheduling time has arrived | Timing Check step on the Running Details tab |
| 3. Check scheduling resource usage | Whether the resource group has enough capacity | Resources step on the Running Details tab |
| 4. View running details | Why the instance failed during execution | Execution step on the Running Details tab |
| (Optional) 5. View monitoring details | Status of monitoring rules and baselines | General, Impact baseline, and Historical instance tabs |
Check the status of ancestor instances
A node runs only after all its ancestor nodes have completed successfully. If an ancestor instance hasn't run, the data it produces doesn't exist — running the current instance without that data risks data quality issues.
Two factors from ancestor instances affect when the current instance can start:
Completion status: All ancestor instances must finish before the current instance can start.
Scheduling time: The current instance can't start before the scheduled start time of its ancestor instances, even if those ancestors finish early. For details, see Impacts of dependencies between tasks on the running of the tasks.
Locate ancestor instances that haven't run
If the current instance is in the Pending (Ancestor) state (indicated by the ![]() icon), open the directed acyclic graph (DAG) of the current instance, right-click the instance, and select Instance Diagnose. On the Running Details tab, click Upstream Nodes to see which ancestor instances haven't completed.
icon), open the directed acyclic graph (DAG) of the current instance, right-click the instance, and select Instance Diagnose. On the Running Details tab, click Upstream Nodes to see which ancestor instances haven't completed.
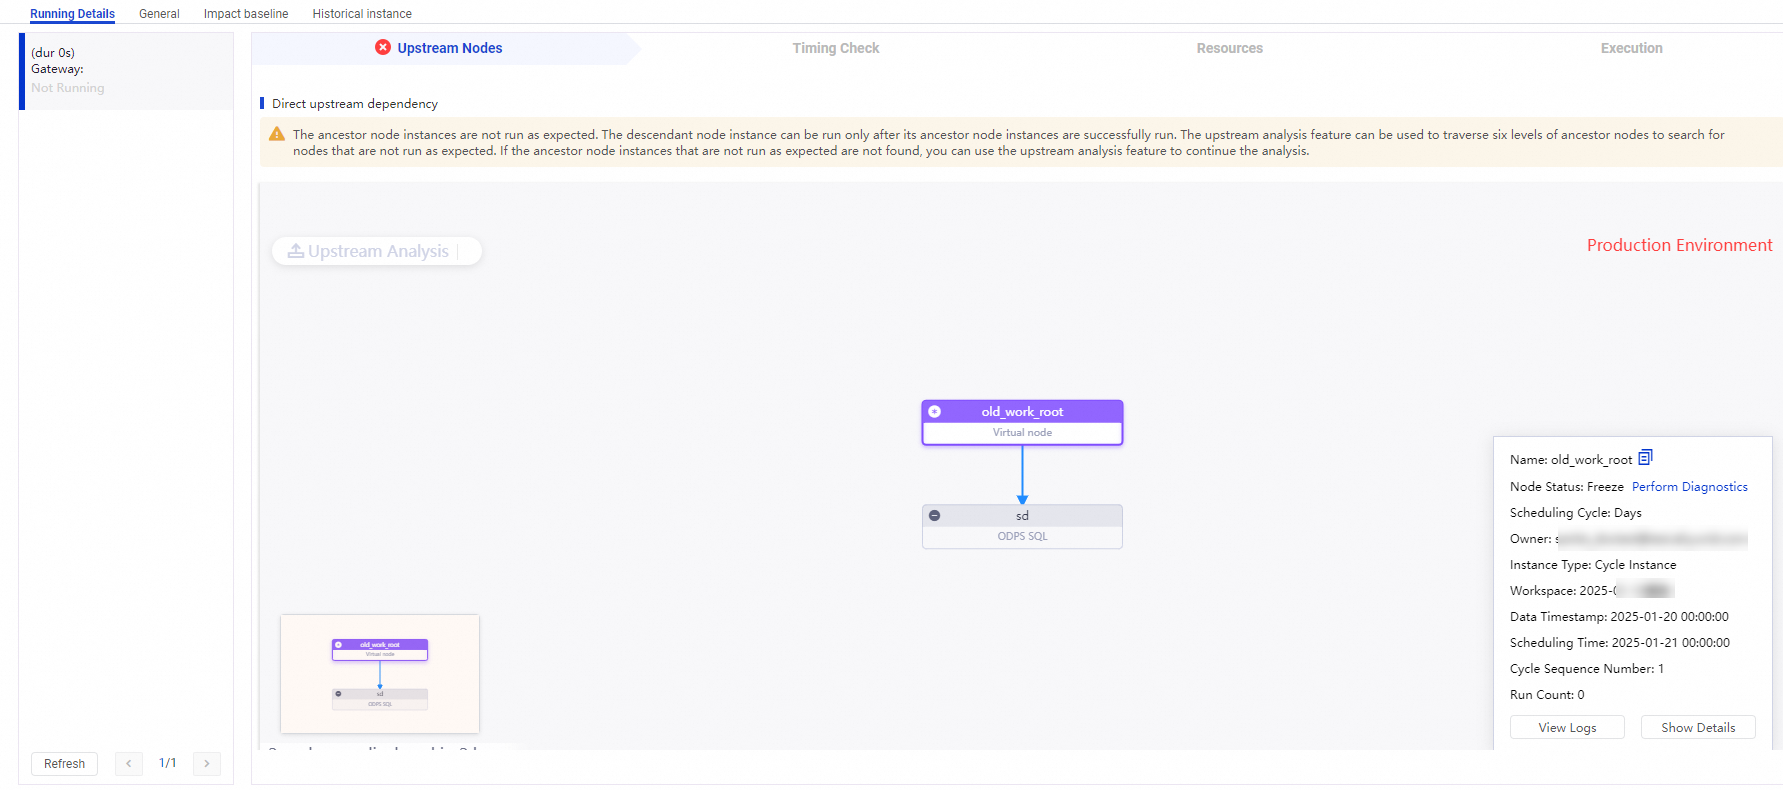
The upstream analysis traverses up to six levels of ancestor instances by default. If no blocking ancestor is found within those six levels, click Upstream Analysis in the DAG to continue the analysis.
Special cases:
Isolated nodes: A node with no configured ancestor nodes can't run on schedule. If the current instance is generated by an isolated node, configure the required ancestor nodes as soon as possible. For details, see Isolated node.
Frozen ancestor instances: If an ancestor instance is frozen, the current instance is also blocked. Contact the owner of the ancestor node to find out why it was frozen and unfreeze it as soon as possible.
Check the scheduling time
The scheduling time configured in DataStudio is the expected running time of an instance. The scheduling time check triggers automatically once all ancestor instances of the current instance have successfully run, which ensures that the data the current instance depends on is available.
When you run the timing check manually, you'll see one of two situations:
Scheduling time has arrived, but ancestors are still running: Once ancestors complete, the instance starts immediately — provided enough scheduling resources are available.
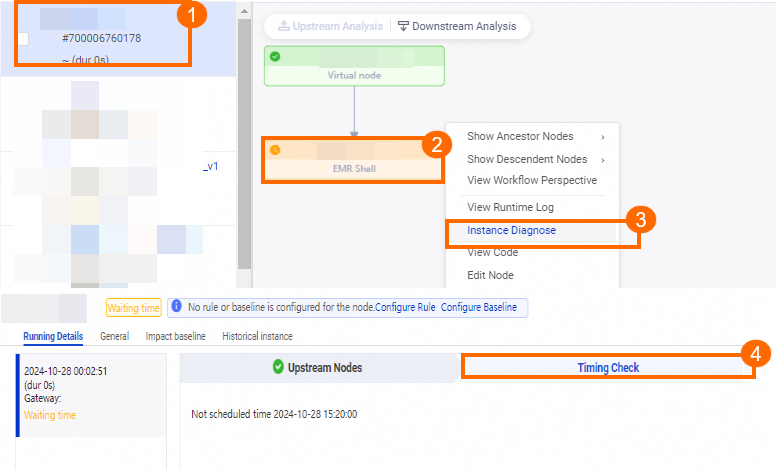
Ancestors have completed, but scheduling time hasn't arrived: The instance enters the Pending (Schedule) state and waits. The
 icon indicates this state. Check the Timing Check step on the Running Details tab for the exact scheduled start time.
Check scheduling resource usage
Once ancestors complete and the scheduling time arrives, the instance can normally start running. However, if the resource group for scheduling doesn't have enough remaining capacity, the instance enters the Pending (Resources) state and waits.
Scheduling resources and compute resources are different. The resource group for scheduling issues the node to a compute engine instance — it doesn't run the node itself. Even after the node is issued successfully, compute engine resource contention can cause further delays. See Overview of DataWorks resource groups.
Locate instances that are consuming resources
If an instance shows the ![]() icon, go to the Resources step on the Running Details tab. It lists the instances currently consuming resources on the resource group so you can identify what's blocking the queue.
icon, go to the Resources step on the Running Details tab. It lists the instances currently consuming resources on the resource group so you can identify what's blocking the queue.
Common causes of the Pending (Resources) state
If a node has been running normally for a long time and then suddenly enters the Pending (Resources) state, check for the following:
| Cause | Action |
|---|---|
| Long-running instances are holding resources and haven't released them | In the Resources step, identify the long-running instances. View their run logs to find out why they're taking so long. |
| More instances are competing for the same resource group | Adjust the priority of the current instance or move it to a different resource group. |
| Shell nodes or PyODPS nodes are consuming large amounts of memory in an exclusive resource group | Check whether any Shell or PyODPS nodes are using excessive memory on the resource group. |
The shared resource group for scheduling is shared across all tenants. During peak hours (00:00–09:00), heavy competition for scheduling resources can delay execution. If your node consistently enters the Pending (Resources) state during peak hours, migrate it to an exclusive resource group for scheduling.
The number of nodes that can run concurrently on an exclusive resource group depends on its specifications. See Exclusive resource groups for scheduling.
View the running details
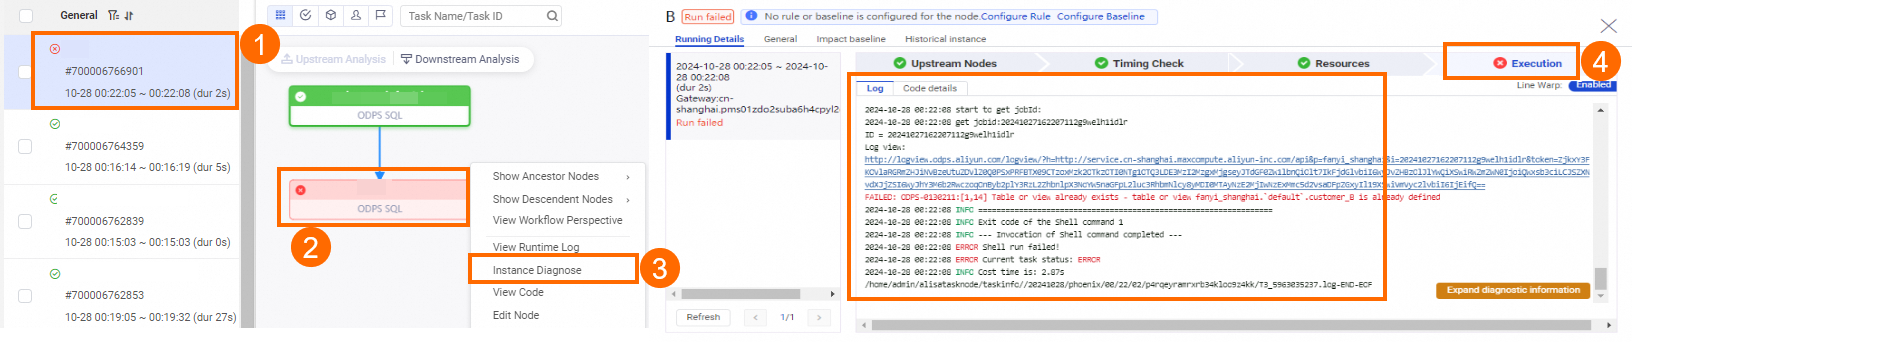
When all preconditions are met, DataWorks issues the instance to the corresponding compute engine or server. If the instance fails after being issued, the Execution step on the Running Details tab shows the failure details. For more about how DataWorks issues instances, see Overview of DataWorks resource groups.
A Failed To Run status (![]() ) has three common causes:
) has three common causes:
The instance code failed to execute (data synchronization or data processing logic errors).
The table data produced by the instance violated configured data quality monitoring rules.
The instance was frozen.
SQL nodes
For SQL nodes, check the detailed log data in the Execution step. DataWorks issues SQL nodes to compute engine instances — if the SQL statements fail, consult the documentation for the relevant compute engine to identify the cause.
Synchronization nodes
For synchronization nodes, the scheduling system issues the node first, but data synchronization may not have started yet. Check the log data to confirm. See Analyze batch synchronization logs.
Two problems commonly occur with synchronization nodes:
WAIT appears in logs for an extended period
The scheduling system has issued the synchronization node, but the resource group for Data Integration doesn't have enough capacity — the node is waiting for resources.
For example, an exclusive resource group for Data Integration with 4 vCPUs and 8 GiB of memory supports up to eight parallel threads. If three synchronization nodes each configured with three parallel threads are assigned to this resource group, and two nodes run in parallel (using six threads), only two threads remain. The third node enters the WAIT state until threads free up.
To see which instances are running on the resource group and how much capacity each is using, go to the Data Integration tab in the Execution step on the Running Details tab.
Each synchronization node holds one scheduling resource slot. If a synchronization node is stuck for a long time, it can block other nodes from running.
If resource usage appears high but no nodes are actually running — or the node count hasn't reached the limit but your node still can't start — join the DataWorks DingTalk group by scanning the QR code below or using the application link to contact support.

The maximum parallel threads for an exclusive resource group for Data Integration depend on its specifications. See Exclusive resource groups for Data Integration.
Data synchronization fails
If a synchronization node fails, read the error message and check the relevant plug-in documentation to identify the cause. See FAQ about network connectivity and operations on resource groups.
View monitoring details
For instances with monitoring rules or baselines configured, go to the Intelligent Diagnosis page of the instance and click View Details next to the prompt message on the Running Details tab. The General, Impact baseline, and Historical instance tabs show the monitoring rules and baselines associated with the instance and their current status.
Monitoring details are only visible when monitoring rules have been configured. See View alert information.