Batch synchronization logs are divided into five areas that correspond to each execution stage. Use these logs to identify which stage a task is in, diagnose failures, and monitor sync performance.
Find the logs
Open the log details page from either module:
| Module | Path |
|---|---|
| Operation Center | Go to Recurring Instance, Test Instance, or Data Backfill. Filter for the instance, then open its log details page. For instructions, see View recurring instances. To work with backfills and test runs, see Backfill data and view data backfill instances (new version) and Run a test and view test instances. |
| DataStudio | On the Operation History page, view execution logs from the last three days. |
Read the logs
The log page is divided into five areas. The following figure shows what the log looks like during a typical execution.
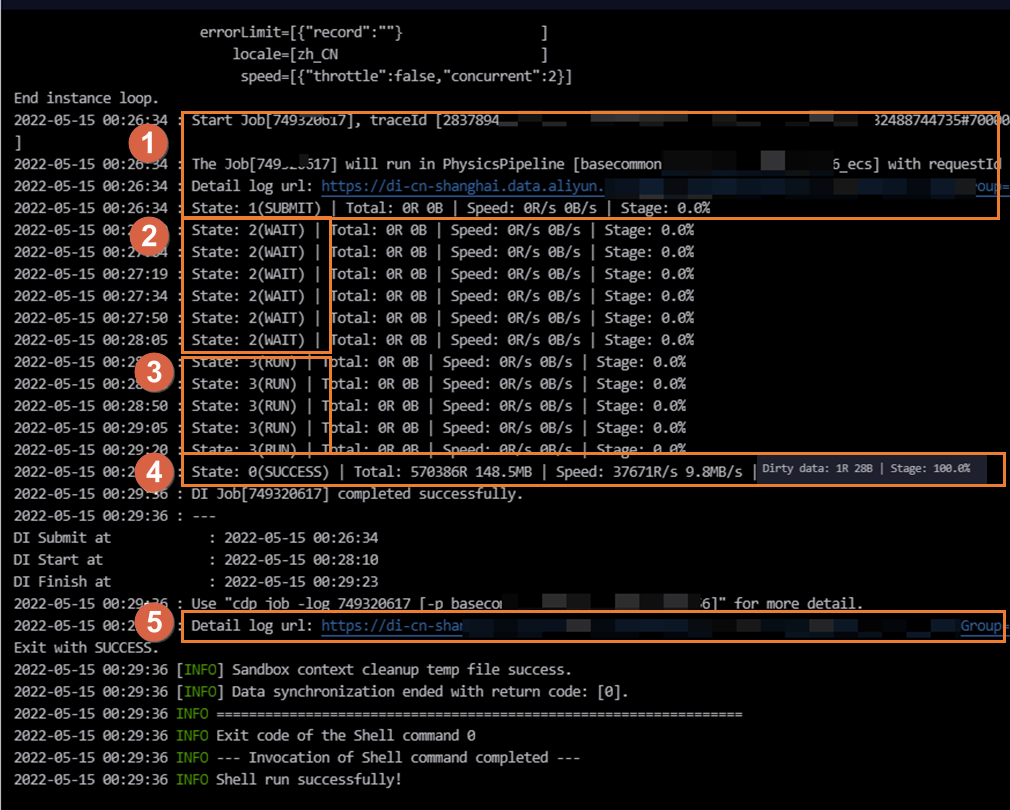
| Area | Status | What it means |
|---|---|---|
| Area ① | SUBMIT | The CDN mapping system has dispatched the sync task to a resource group for Data Integration execution. The task has finished rendering. |
| Area ② | WAIT | The task is waiting for Data Integration resources to become available. |
| Area ③ | RUN | The task is actively running through its execution stages. |
| Area ④ | FAIL / SUCCESS | The task has completed, either with an error or successfully. |
| Area ⑤ | (link) | A link to the detailed log for each individual execution stage. |
Area ①: SUBMIT — identify the resource group
When the task is submitted, the log shows which resource group is running it:
| Resource group type | Log output |
|---|---|
| Default resource group | running in Pipeline[basecommon_ group_xxxxxxxxx] |
| Exclusive resource group for Data Integration | running in Pipeline[basecommon_S_res_group_xxx] |
| Serverless resource group | running in Pipeline[basecommon_Serverless_res_group_xxx] |
Click Detail log url in Area ① to open the detailed log for each stage.
Area ②: WAIT — resolve resource contention
The WAIT status means no Data Integration resources are available on the resource group. To resolve this:
Wait for other tasks running on the resource group to finish and release their resources, then rerun your task. To identify which tasks are consuming resources, see Scenarios and solutions for slow data synchronization.
Coordinate with the owners of those tasks to reduce concurrency.
Reduce the concurrency of the current sync task, then republish it.
Scale out the resource group. See Scale-out and scale-in operations.
Area ③: RUN — four execution stages
A batch synchronization task runs through four sequential stages:
Stage 1: Pre-preparation
The system sends a pre-SQL statement to the source or destination database before reading begins. Not all tasks include this stage.
For a MySQL Writer with a configured PreSQL statement, that statement runs against the database here.
For a MySQL Reader with a configured
querySqlstatement orwhereclause, those statements run here.For example, when writing to MaxCompute with Delete Existing Data Before Writing enabled, the deletion runs at this stage.
Use an indexed field for filter conditions. A slow-running SQL statement at this stage increases overall sync time and can cause the task to time out.
Stage 2: Split task
The source data is split into subtasks for concurrent batch reading. Splitting rules differ by source type:
| Source type | Splitting rule |
|---|---|
| Relational database | Split by splitPk (shard key). No shard key means single-threaded sync. |
| LogHub, DataHub, or MongoDB | Split by number of shards. Max concurrency cannot exceed the number of shards. |
| Semi-structured storage (e.g., OSS) | Split by number of files or data volume. For OSS, max concurrency cannot exceed the number of files. |
Stage 3: Synchronize data
Subtasks are synchronized concurrently based on your configured concurrency setting. For relational databases, DataWorks generates multiple SQL statements from the shard key and reads the data in parallel. See Relationship between batch synchronization concurrency and rate limiting for details.
The actual concurrency during execution may differ from your configured value. Incorrect shard key configuration can generate SQL statements that run for a long time in the database, slowing the sync or causing it to fail. High database load can also reduce sync performance.
Stage 4: Post-preparation
After data synchronization completes, the system sends a post-SQL statement to the database. Not all tasks include this stage.
For a MySQL Writer with a configured PostSQL statement, that statement runs here. Its execution time counts toward the total task duration.
Area ④: FAIL / SUCCESS — interpret the result
If the task fails (FAIL):
A key error message is recorded in the log. Click the link in Area ⑤ to view the detailed execution log for each stage and identify where the task broke down.
If the task succeeds (SUCCESS):
The log shows a summary of results, including the total number of synchronized records and the average synchronization speed.
Dirty data:
If the task encounters dirty data, the log records Dirty data: xxR. Dirty data is not written to the destination. A large volume of dirty data slows synchronization. If you have requirements for synchronization speed, you must first resolve the dirty data issue.
By default, batch synchronization tasks tolerate dirty data. To control this behavior, configure the dirty data toleration count in the task settings. See Configure a task in the codeless UI or Configure a task in the code editor for configuration details. For more about dirty data, see Features of batch synchronization task configuration.
Configure the shard key for relational databases
The splitPk parameter controls how DataWorks splits relational database data into subtasks. Configure it correctly to avoid slow queries and data hot spots.
Best practice: Set splitPk to the table's primary key. Primary keys are typically evenly distributed, which prevents data hot spots in the resulting shards.
Constraints:
splitPksupports only integer data types. Strings, floating-point numbers, dates, and other types are not supported. If you configuresplitPkwith an unsupported type, DataWorks ignores the setting and uses a single channel.If
splitPkis not specified or is left blank, the table is synchronized using a single channel.