Operation Center is where you manage and monitor tasks running in the production environment. This guide walks you through the full O&M workflow for an auto triggered node — from verifying its configuration after publishing, to running smoke tests, backfilling historical data, and setting up monitoring alerts to keep the task on track.
Prerequisites
Before you begin, ensure that you have:
-
An auto triggered node named
result_tablecreated and published. For details, see Data Studio.
All steps in this guide use the result_table node as the example. Apply the same operations to your own tasks as needed.
Background
Operation Center supports operations management for auto triggered nodes, one-time tasks, and real-time sync tasks. It also provides monitoring for tasks and the resources they use, so you can detect and respond to exceptions quickly.
This guide covers the core workflow for getting a published task into a stable, monitored state. For more advanced operations, see:
-
Basic O&M operations for auto triggered nodes — publish, unpublish, or freeze tasks
-
Operation Center overview — full feature reference
Open Operation Center
Log on to the Operation Center console. Switch to the destination region, select your workspace from the drop-down list, and then click Enter Operation Center.
Procedure
The workflow has two phases:
Phase 1 — Test and verify the task
-
View the node configuration — Confirm scheduling parameters and resource group settings are correct.
-
Run a smoke test — Verify that the node runs correctly in production before relying on it.
-
Backfill historical data — Reprocess data for a past time range.
-
Check recurring instances — Confirm the node is scheduling as expected.
-
Verify execution results — Confirm that data was written to the destination table.
Phase 2 — Set up monitoring
-
Create a custom monitoring rule — Get alerted when the node fails to run.
-
Create an intelligent baseline (advanced) — Ensure the node generates data by a committed time.
-
Create an automatic O&M rule for a resource group (advanced) — Automate responses when resource utilization exceeds thresholds.
Step 1: View the node configuration
After publishing a node, verify its scheduling parameters and node dependencies before the first scheduled run. If anything is misconfigured, the node may fail to execute or produce incorrect results.
-
Open Operation Center.
-
Find the node.
-
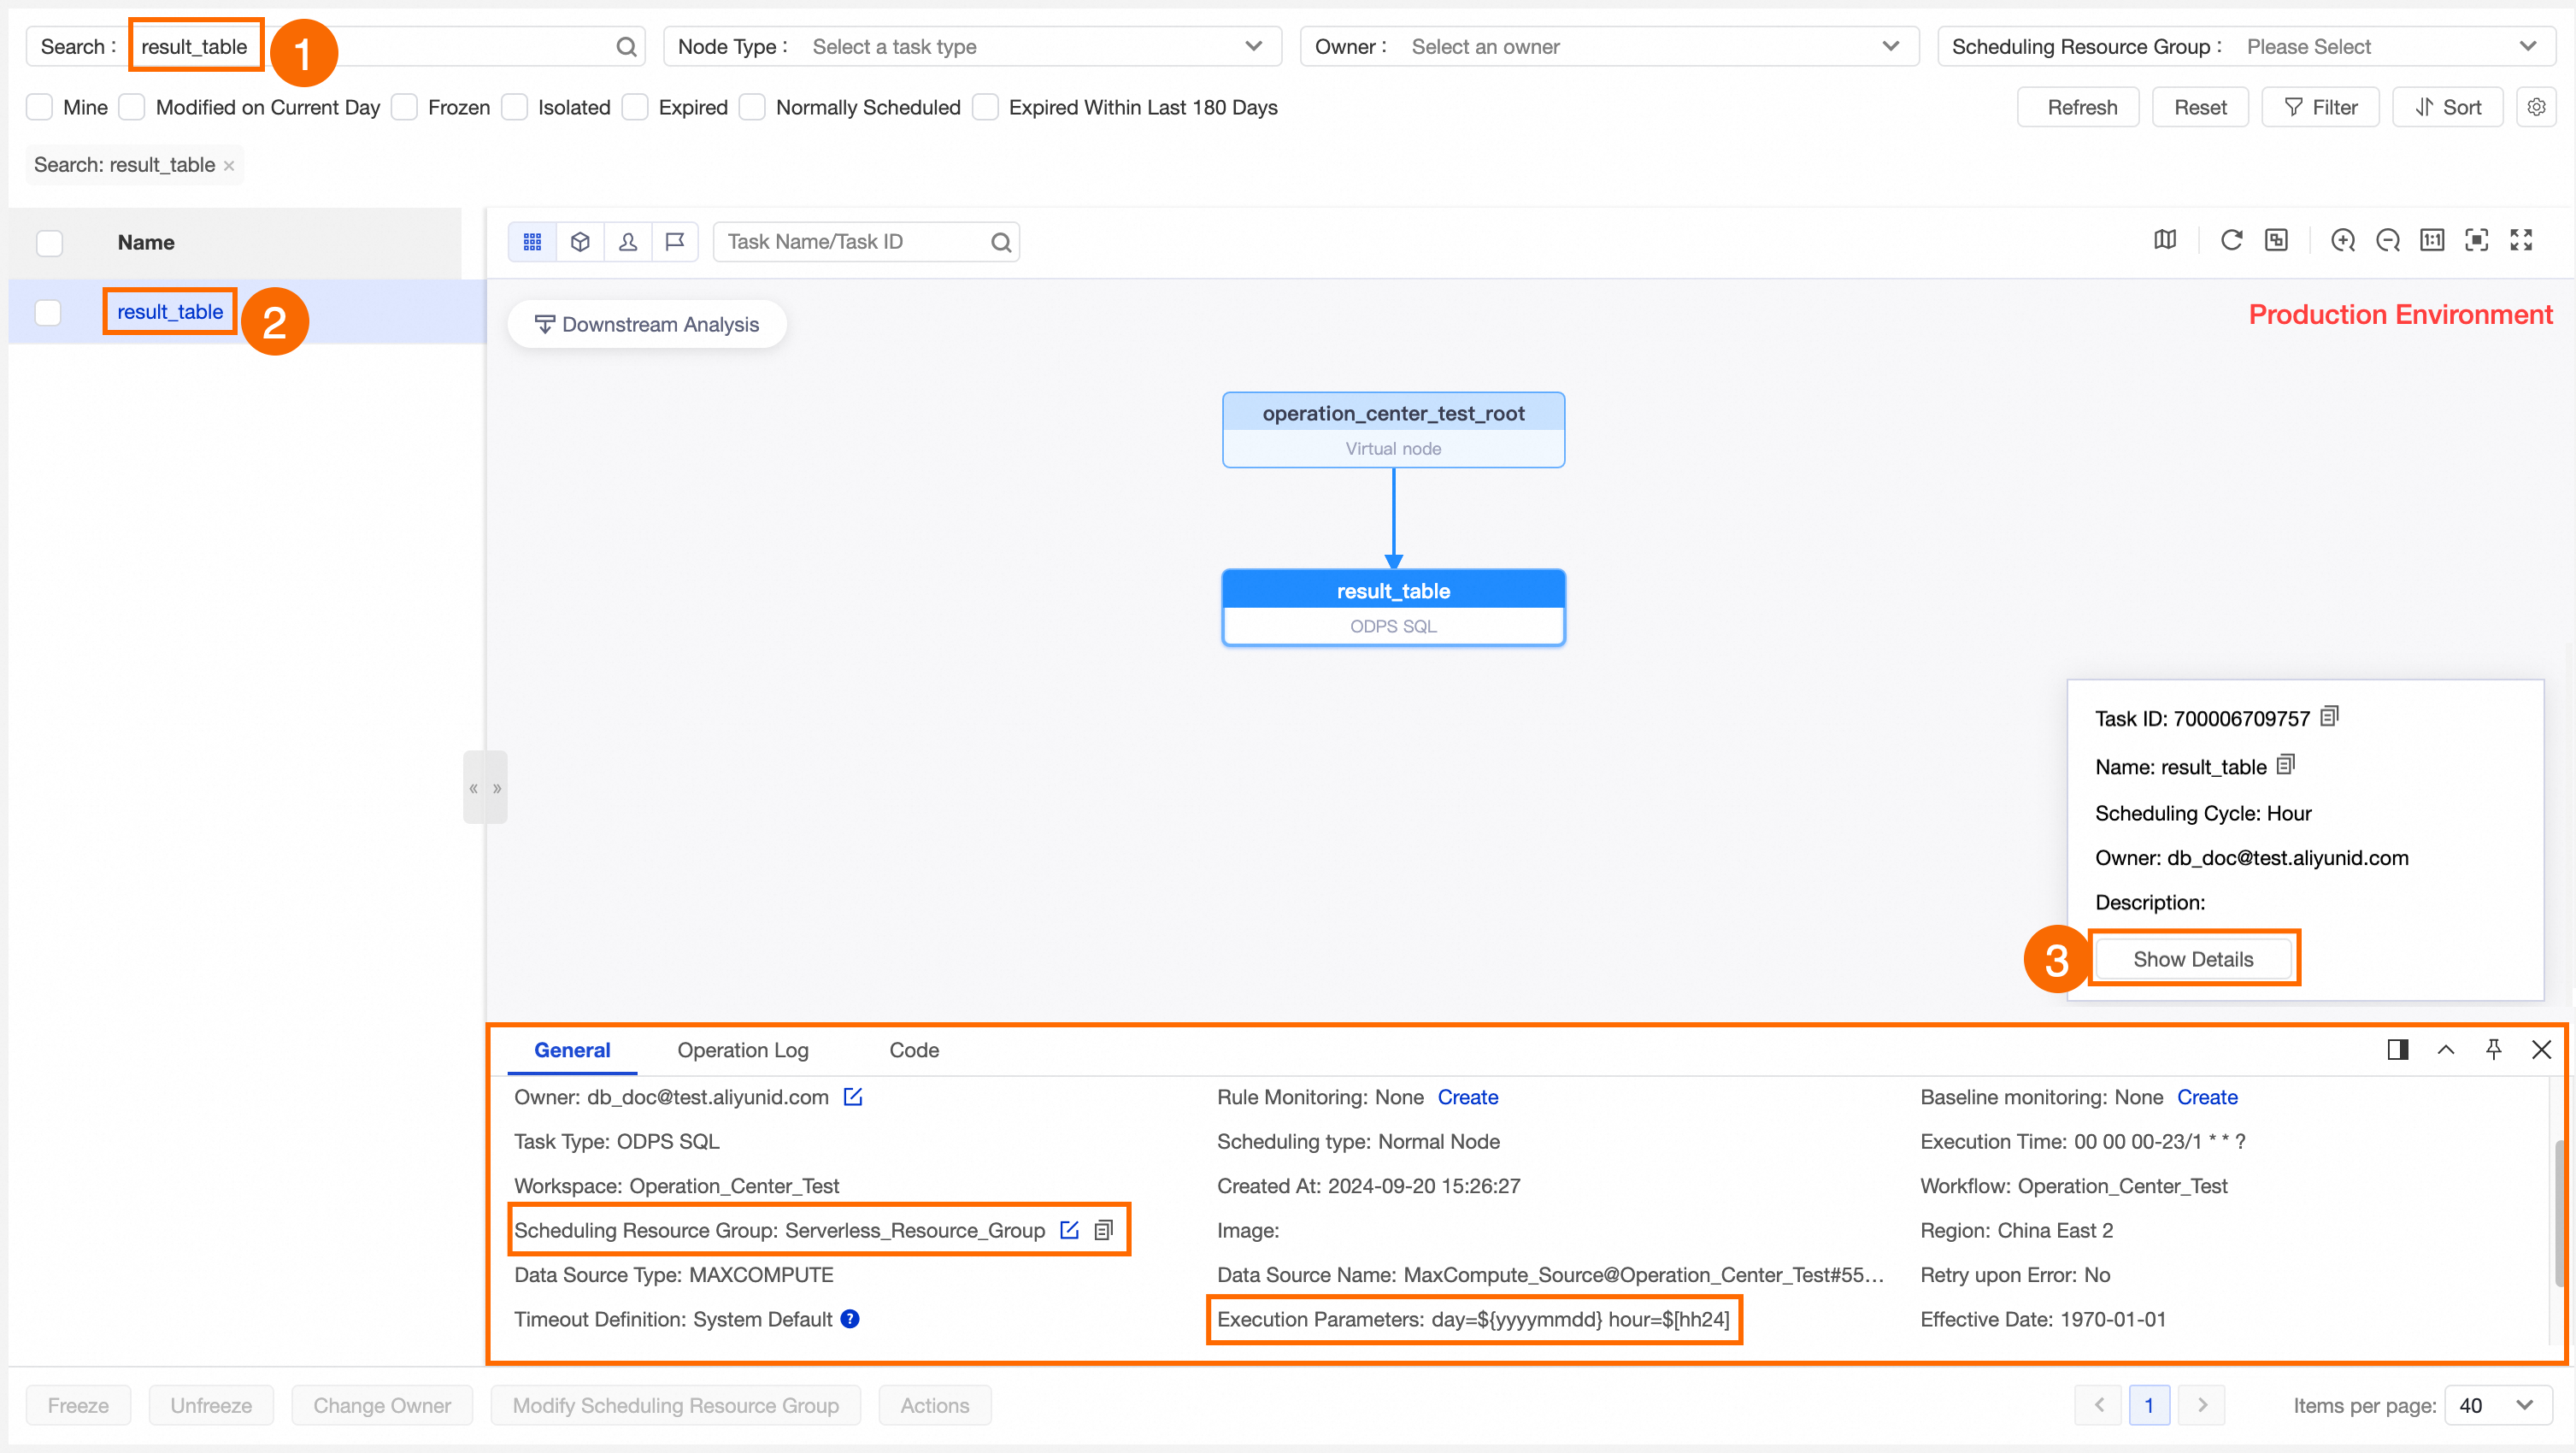
In the left navigation pane, choose Auto Triggered Node O&M > Auto Triggered Node.
-
On the Auto Triggered Node page, search for and select the destination node.
-
-
View the node details.
-
Click the node to open its Directed Acyclic Graph (DAG).
-
Click Expand Details to see the full node configuration.
-
For a complete list of node operations, see Manage auto triggered nodes.
If the configuration is incorrect, go to Data Studio, update the node, and republish it. See Node-related operations.
The following example shows the result_table node in the auto triggered node list. Confirm that Scheduling Parameter and Schedule Resource Group are set correctly.
Step 2: Run a smoke test
Smoke testing runs the node's actual code logic in the production environment, using a specific data timestamp you choose. Use this to verify that the node executes correctly before it runs on its regular schedule.
-
Go to the smoke testing page using one of the following methods:
-
In the auto triggered node list, find the node and click Test in the Operation column.
-
In the node's DAG, right-click the node and select Test.
-
-
Set the data timestamp and runtime, then click OK. A test instance is generated. Go to Auto Triggered Node O&M > Test Instance to track its status.
For smoke testing details, see Perform smoke testing.
To view test instances, see Run a test and view test instances.
The following example shows the result_table node after a smoke test, with the generated test instance and its execution status.

Step 3: Backfill historical data
Data backfill recalculates and rewrites data for a past time range. Use it when you need to reprocess historical data after fixing a bug, changing business logic, or recovering from a failed run.
Choose a backfill mode
Select the mode that fits your use case:
| Mode | Use when | Notes |
|---|---|---|
| Manual selection | Backfilling the current node and a specific subset of its descendants. | Supports up to 500 root tasks and 2,000 total tasks. Compatible with previous data backfill plans, such as Current Node, Current Node and Descendant Nodes, and Advanced Mode. |
| Select by link | End-to-end backfill across tasks with complex dependencies. | Specify a start task and one or more end tasks; the system includes all tasks along the path automatically. |
| Select by workspace | Descendant nodes span multiple workspaces. | Supports up to 20,000 tasks. Compatible with the previous Massive Nodes Mode data backfill plan. You cannot configure a task blacklist. |
| Specify task and all descendants | Backfilling a root task and all its descendants when the exact scope is not critical to confirm in advance. | Use with caution — the full scope is only visible when the backfill job runs. |
Run the backfill
-
Go to the data backfill page using one of the following methods:
-
In the auto triggered node list, find the node and click Backfill Data in the Operation column.
-
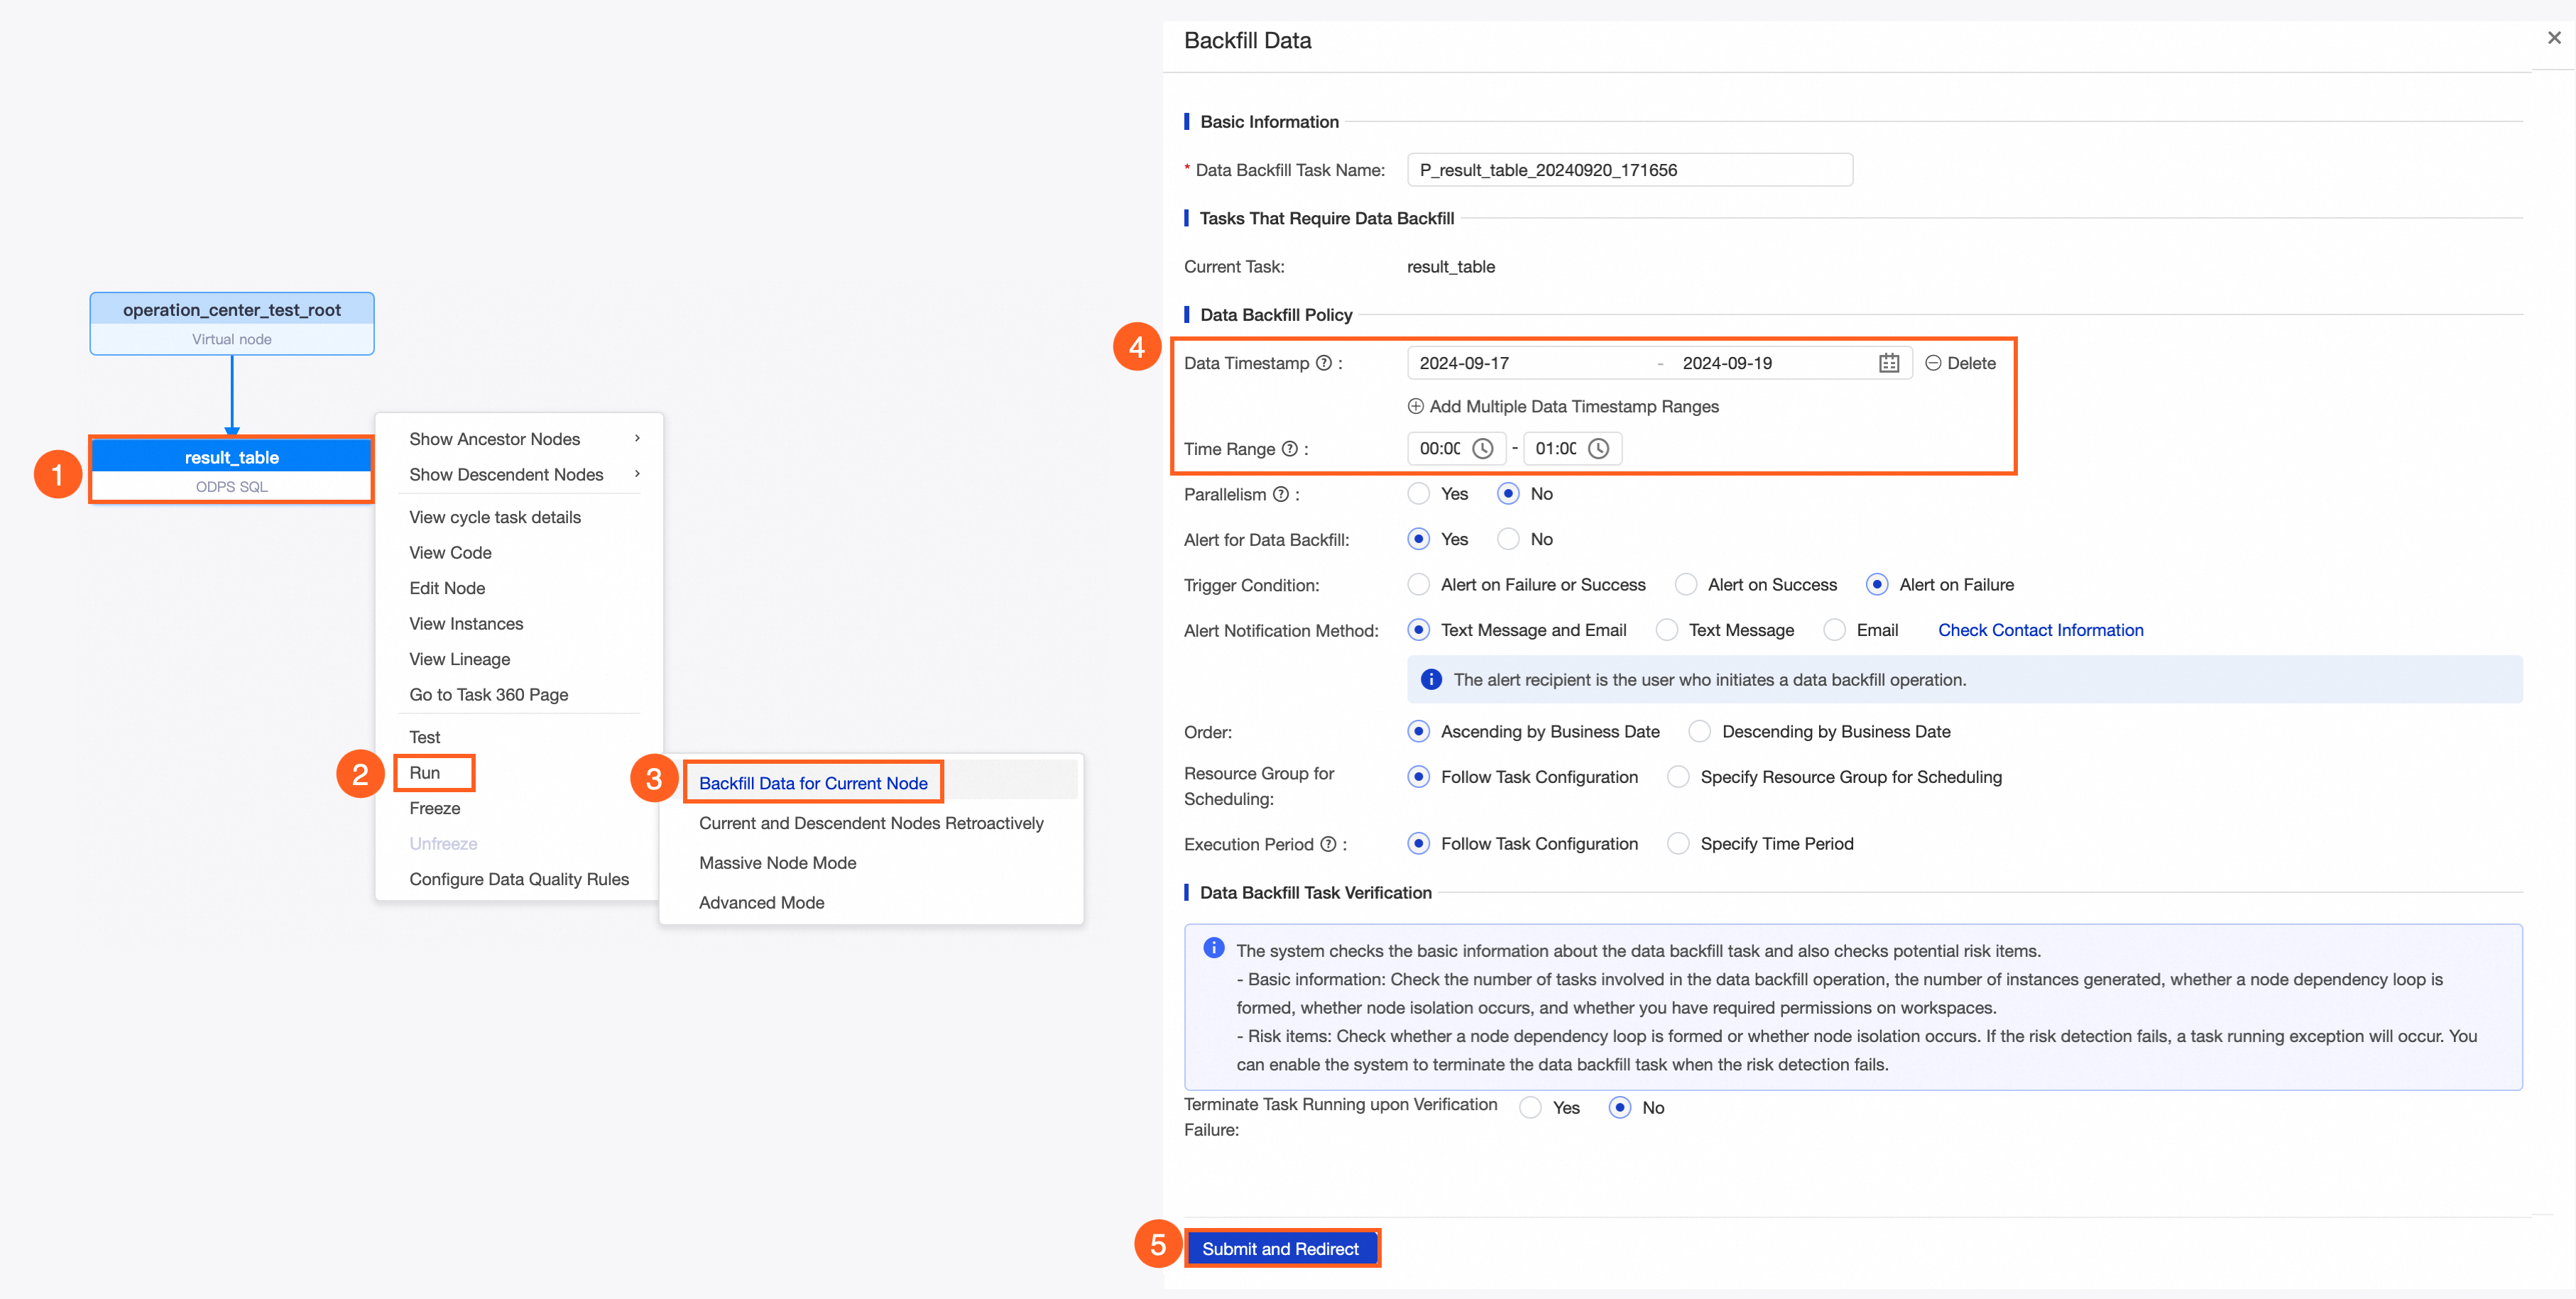
In the node's DAG, right-click the node and select Backfill Data.
-
-
Select a backfill mode.
-
Configure the data timestamp, the nodes to include, and any other required parameters. Configuration options vary by mode. For details, see Backfill data and view data backfill instances.
After you configure the backfill, variables in the node code are replaced with the values derived from the scheduling parameters and data timestamp you specified.
The following example uses Backfill Data For Current Node mode to backfill data for the result_table node. The backfill covers the 00:00–01:00 window for each day from 2024-09-17 to 2024-09-19.
Step 4: Check recurring instances
After a node is published, Operation Center generates recurring instances based on its schedule. How quickly they appear depends on the Instance Generation Mode set in Data Studio:
-
Generate On The Next Day (T+1): The first instances are generated the day after publishing.
-
Generate Immediately After Publishing: Instances start generating on the same day.
-
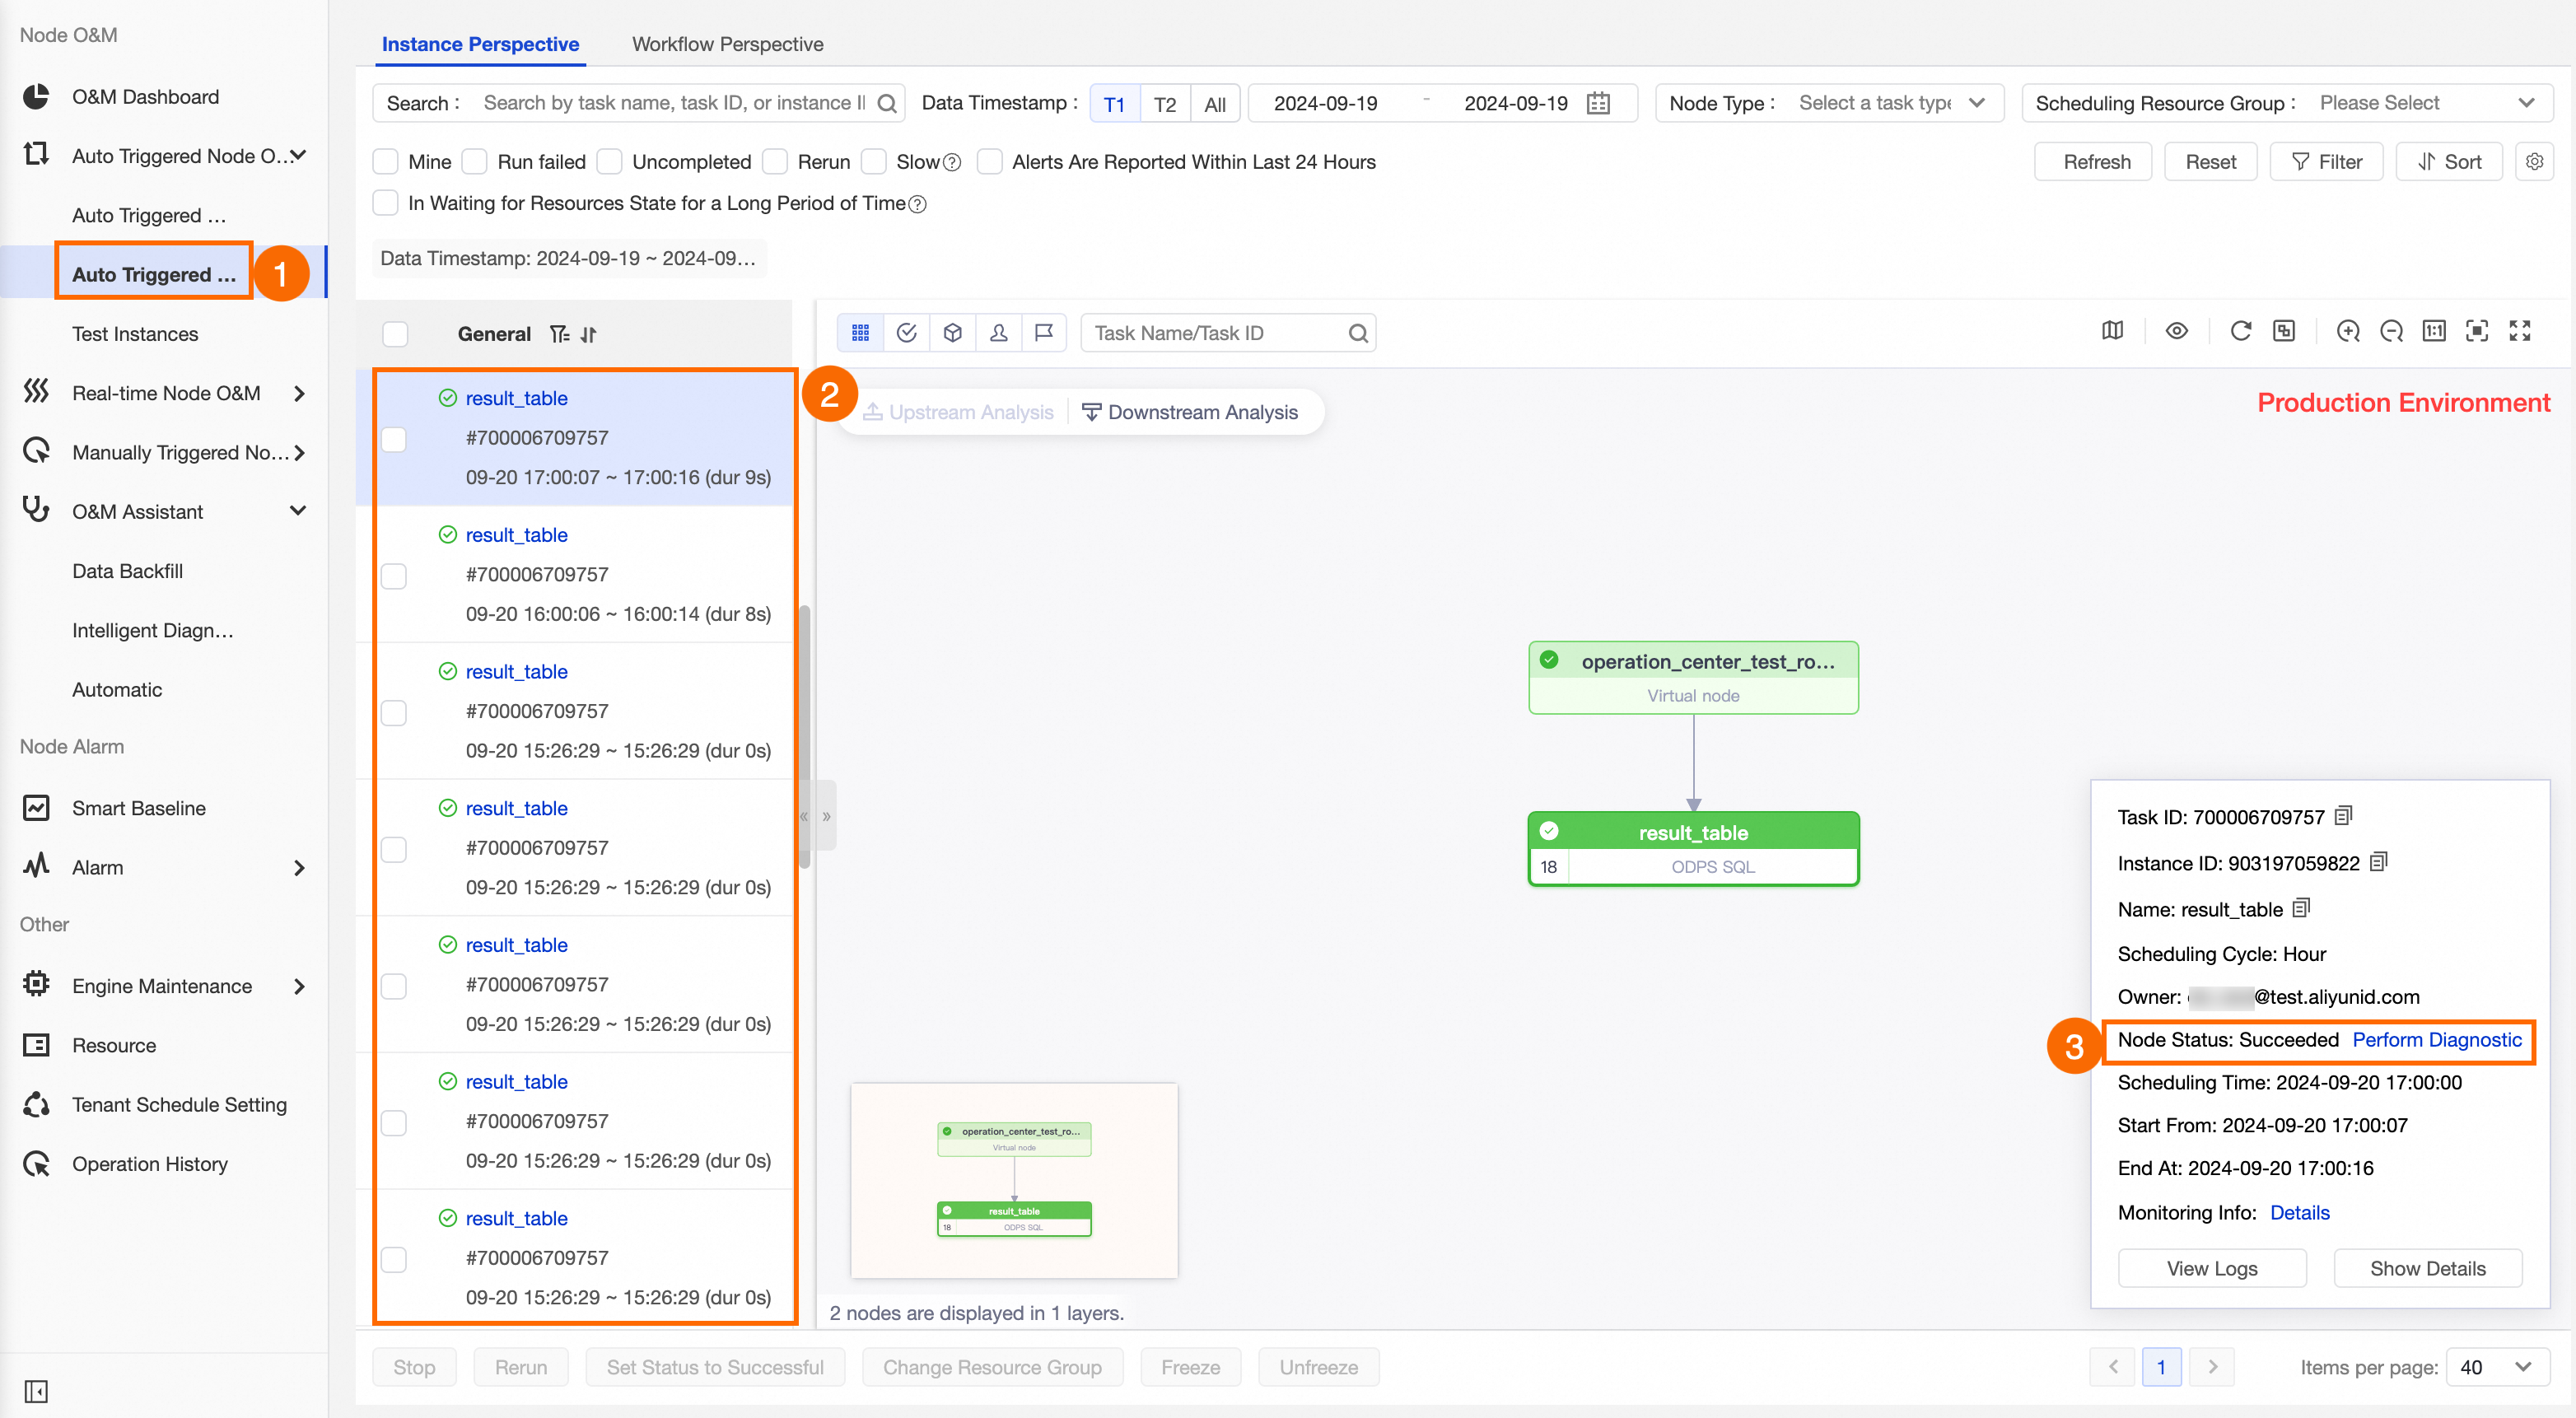
In the left navigation pane of Operation Center, choose Auto Triggered Node O&M > Recurring Instance.
-
Check whether instances are generated and running as expected based on the node's schedule configuration. For details, see View recurring instances.
Troubleshoot a blocked instance
If an instance is not running, use the following two features in sequence to diagnose the issue:
-
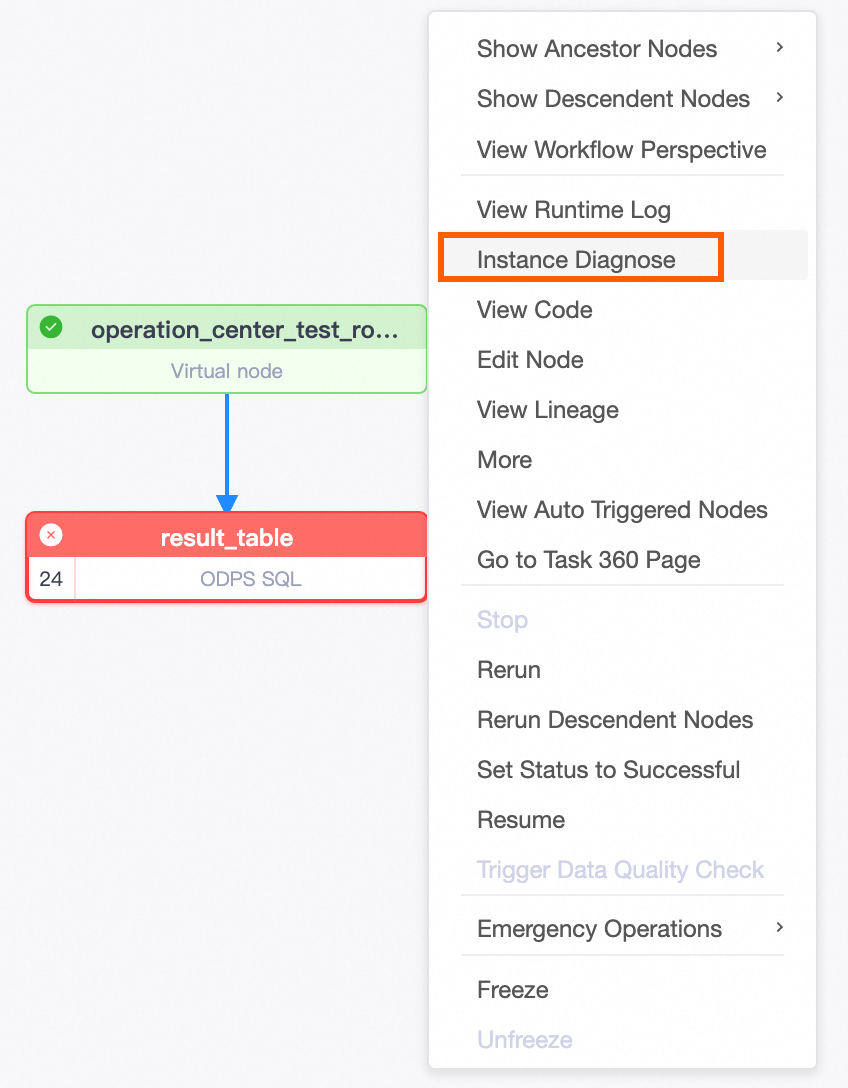
Upstream Analysis: In the DAG panel, use Upstream Analysis to identify which upstream tasks are blocking the current instance. Start here to narrow down the scope.
-
Runtime Diagnosis: On the blocking upstream task, use Runtime Diagnosis to find the root cause. This is especially useful when the dependency chain is deep — it pinpoints the issue without requiring you to trace through each layer manually.
The following example shows the recurring instances of the result_table node (scheduled hourly) generated on 2024-09-19.
Step 5: Verify execution results
After a smoke test or data backfill, confirm that data was written correctly to the destination table. Two options are available:
-
Data Map: Search for the destination table and view its details to confirm the data was written. See Find a table and View table details.
-
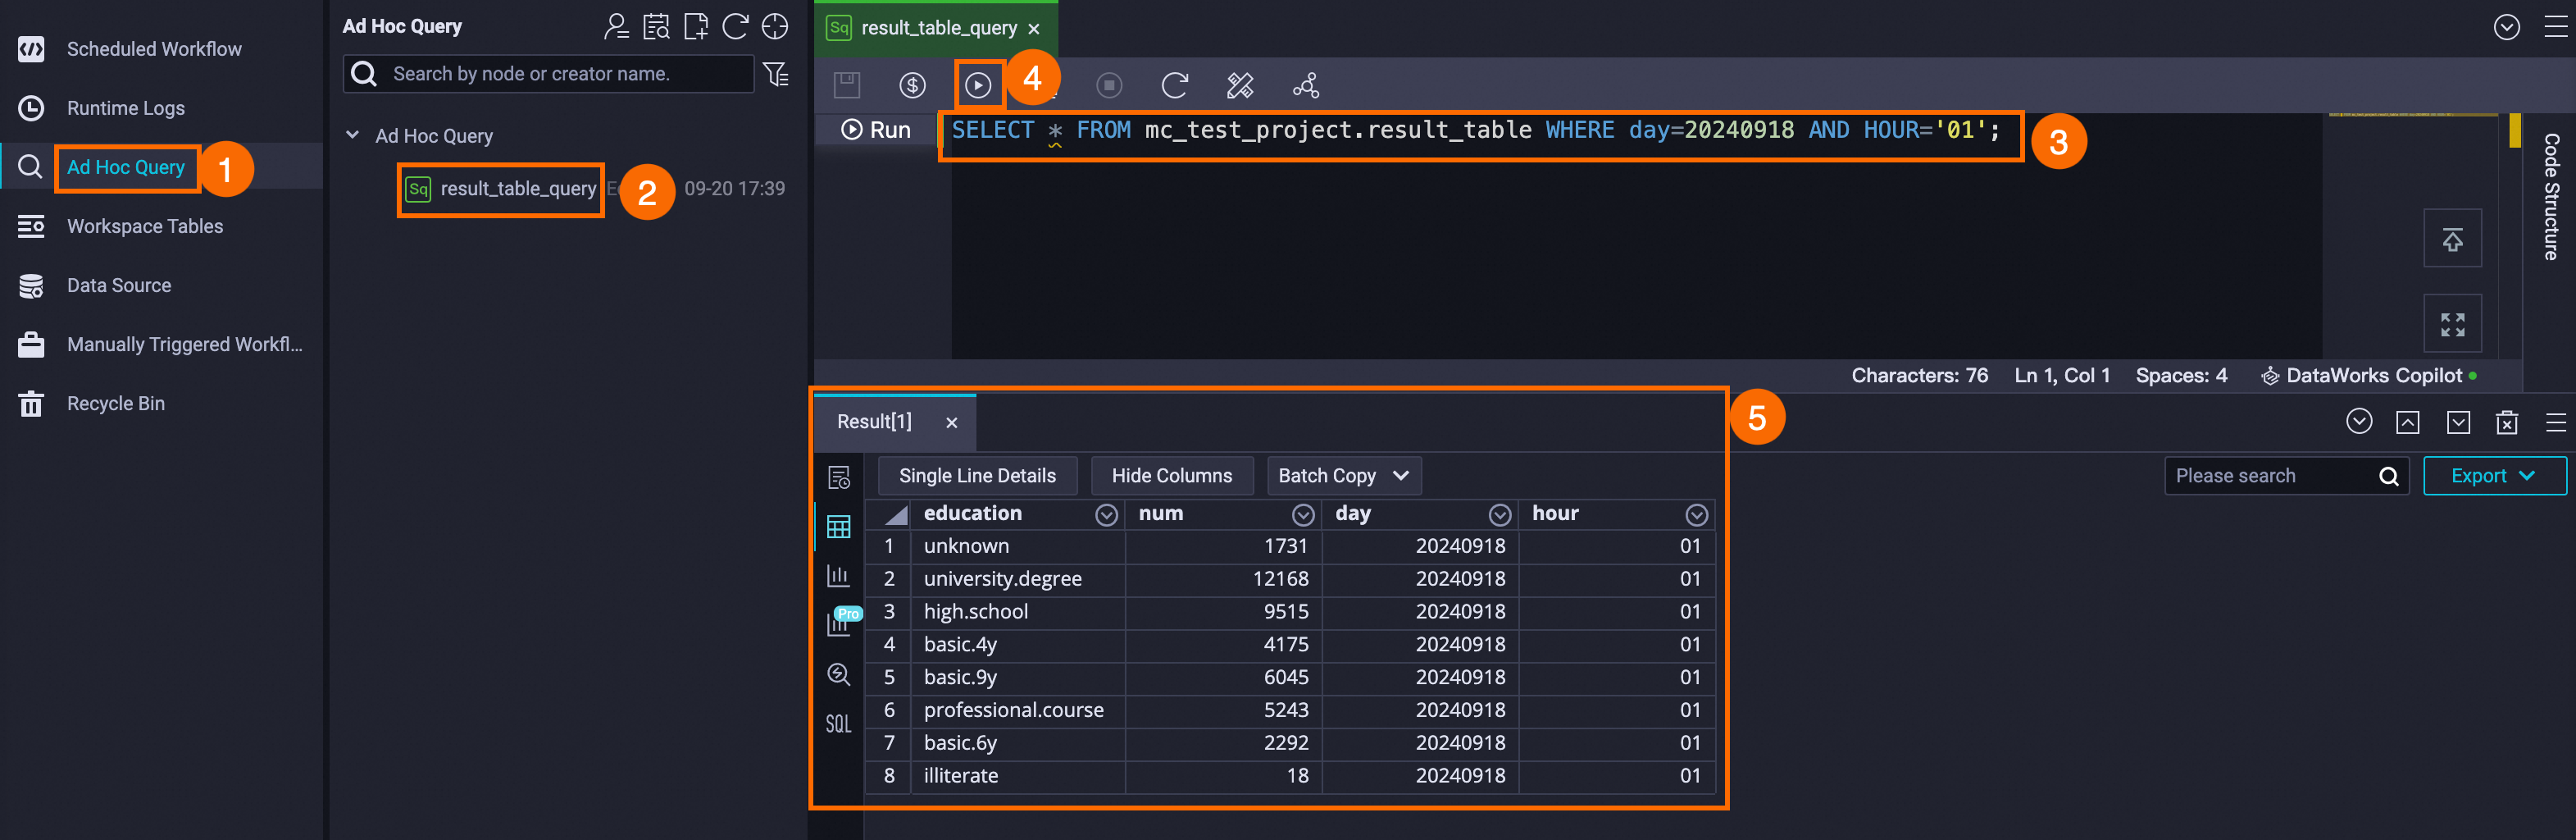
Ad Hoc Query: Run a SQL query directly in Data Studio to check whether the actual data matches your expectations — without publishing any code to production. See Create an ad hoc query file.
By default, a Resource Access Management (RAM) user does not have permission to query production tables in the MaxCompute DPI engine. Go to Data Map and request table permissions from the product page. See Request table permissions.
Data is written to different DPI engine projects depending on where the node runs: the developer environment writes to the developer DPI engine project, while the production environment writes to the production DPI engine project. Before querying, confirm which project the data is in by checking the Computing Resource page.
MaxCompute supports cross-project table access, such as accessing tables that are created in other data sources or accessing production project tables from a developer project. Not all DPI engine types support this feature — check your engine's documentation to confirm.
In this example, the production DPI engine project for result_table is mc_test_project. Use Ad Hoc Query to create an ODPS SQL node and run a SQL statement to query the partition data in mc_test_project.result_table.
Step 6: Create a custom monitoring rule
Once the node is tested and running, set up a monitoring rule to get alerted if it fails. DataWorks sends an alert based on the rule configuration, so you can identify and handle exceptions before they affect downstream data.
-
Open Operation Center.
-
In the left navigation pane, choose Monitoring > Rule Management.
-
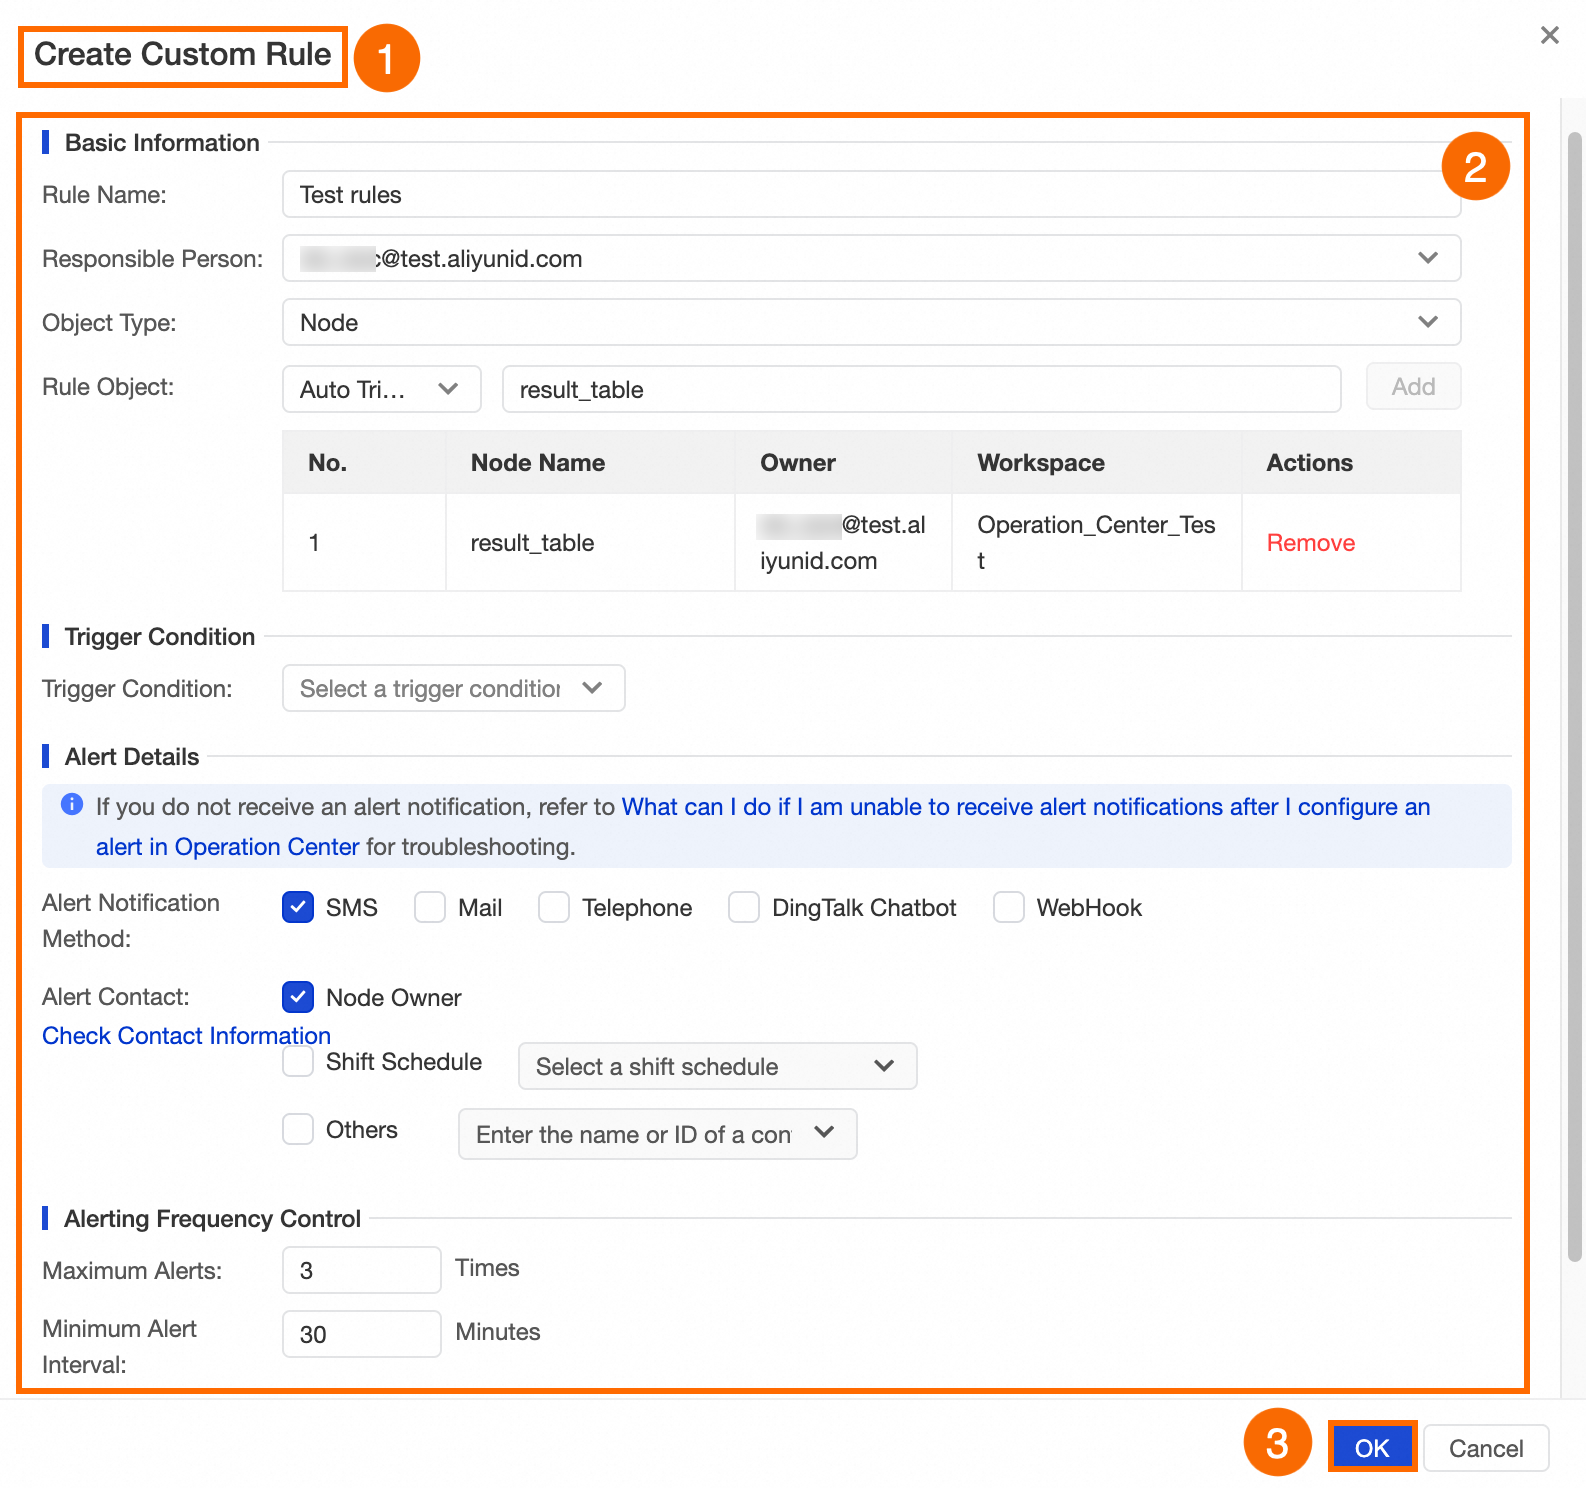
Click Create Custom Rule and configure the rule. For configuration options, see Custom monitoring rules.
Configure alert contact information before setting up rules. See View and set alert contacts.
The following example creates a rule named Test rules for the result_table node. When the node fails to run, an alert is sent to the node owner by text message, up to 3 times at 30-minute intervals.
Step 7: Create an intelligent baseline (advanced)
An intelligent baseline ensures that high-priority tasks generate data by a committed time. DataWorks calculates the estimated completion time based on the node's historical run times and gives baseline tasks preferential access to scheduling resources. If the system predicts the task will miss its committed time, it sends an alert so you can act before the deadline.
-
Open Operation Center.
-
In the left navigation pane, click Intelligent Baseline.
-
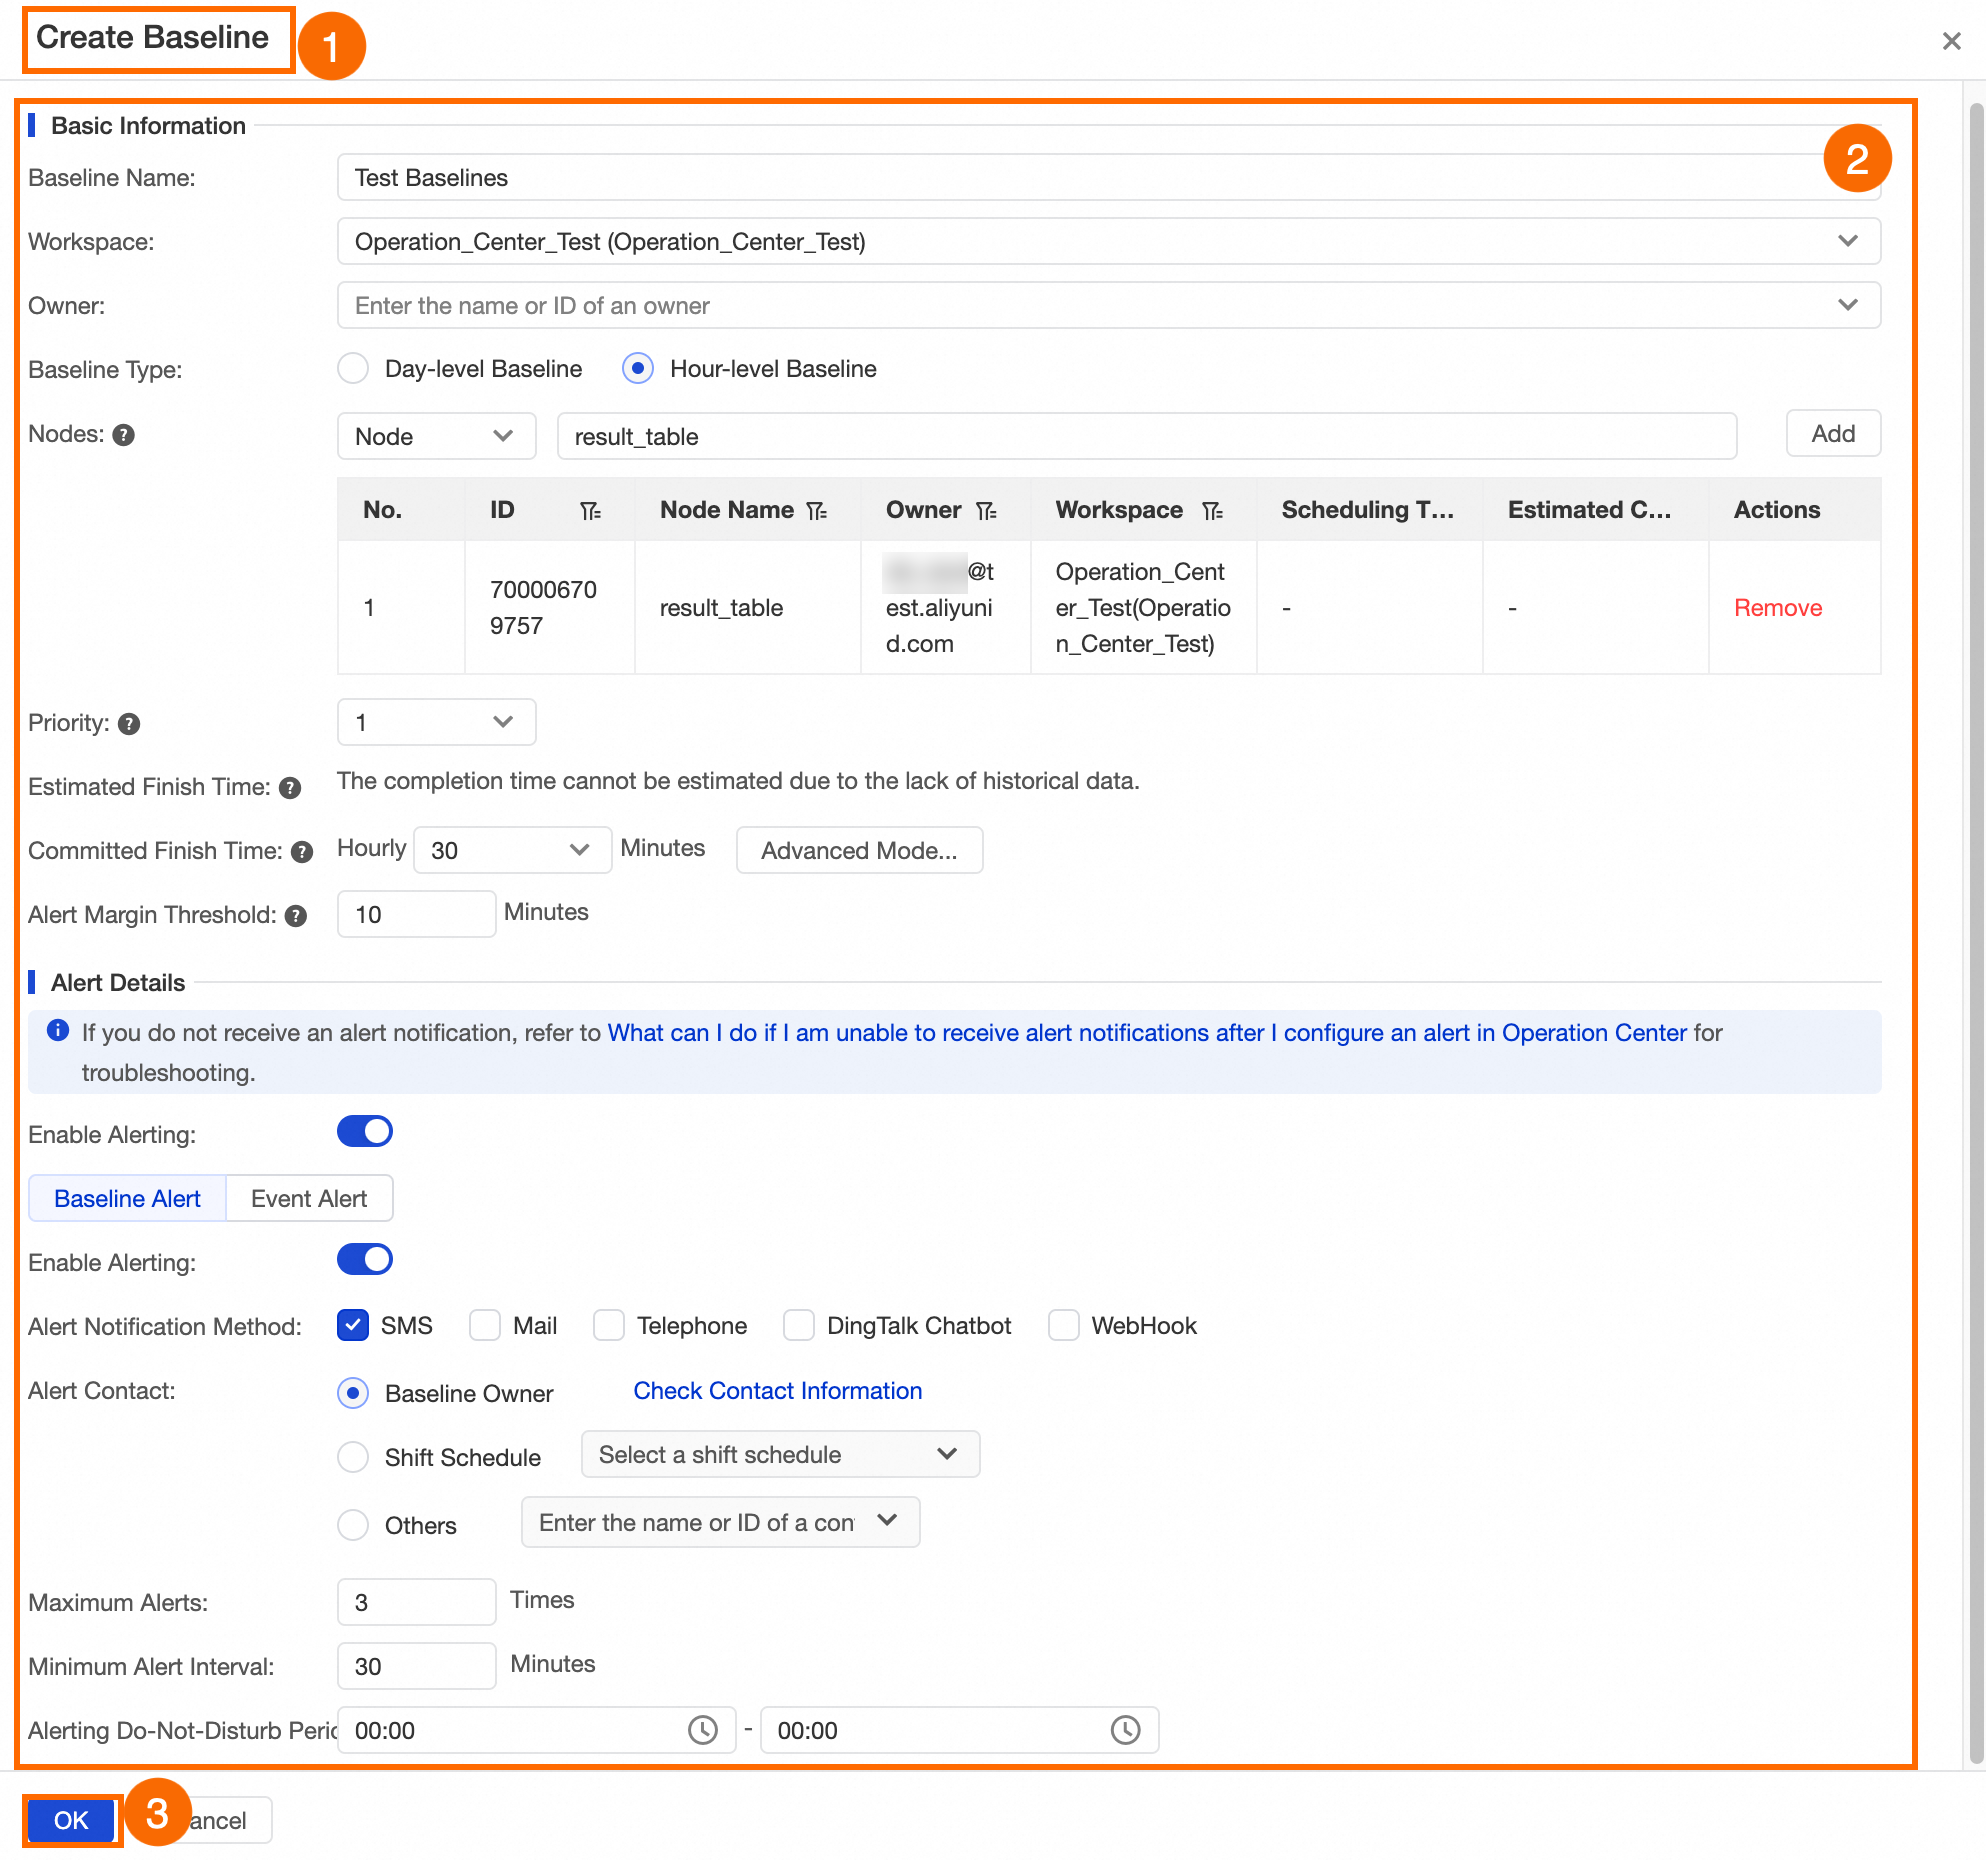
On the Baseline Management tab, click Create Baseline and configure the baseline. For configuration options, see Create a baseline.
Key parameters:
| Parameter | Description |
|---|---|
| Priority | Higher values get preferential access to scheduling resources when resources are limited. |
| Estimated finish time | Calculated from the node's completion history over a recent period. |
| Committed time | The latest time by which the node must generate data. Set this based on business requirements and actual run history. |
| Alert margin | A buffer before the committed time for handling exceptions. The interval between the alert margin and the committed time must be at least 5 minutes. |
The following example configures an hourly baseline named Test Baselines for result_table. If the hourly instance cannot complete within 30 minutes of each hour, an alert is sent to the node owner by text message, up to 3 times at 30-minute intervals.
Step 8: Create an automatic O&M rule for a resource group (advanced)
If tasks run on an exclusive resource group, you can create automatic O&M rules to respond to resource pressure without manual intervention. When a monitoring rule is triggered, DataWorks automatically performs the configured O&M action on matching instances.
Automatic O&M is currently supported only for exclusive resource groups for scheduling.
To move a task to an exclusive resource group for scheduling, see Switch resource groups.
-
Open Operation Center.
-
Create a monitoring rule for the resource group. The following example monitors the resource utilization of the
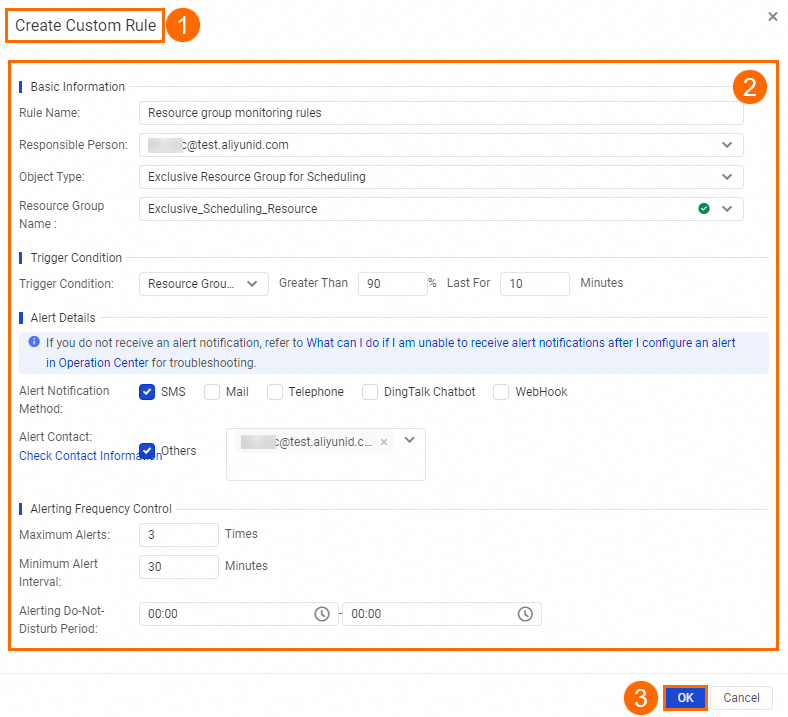
Exclusive_Scheduling_Resourceresource group. When utilization exceeds 90% for 10 minutes, theResource group monitoring rulesrule is triggered and an alert is sent by text message, up to 3 times.-
In the left navigation pane, choose Monitoring > Rule Management.
-
Click Create Custom Rule. Set Object Type to Exclusive Resource Group For Scheduling and configure the other fields. For details, see Custom monitoring rules.
This example demonstrates the configuration steps. When you set up your own rule, select the resource group you actually use.
-
-
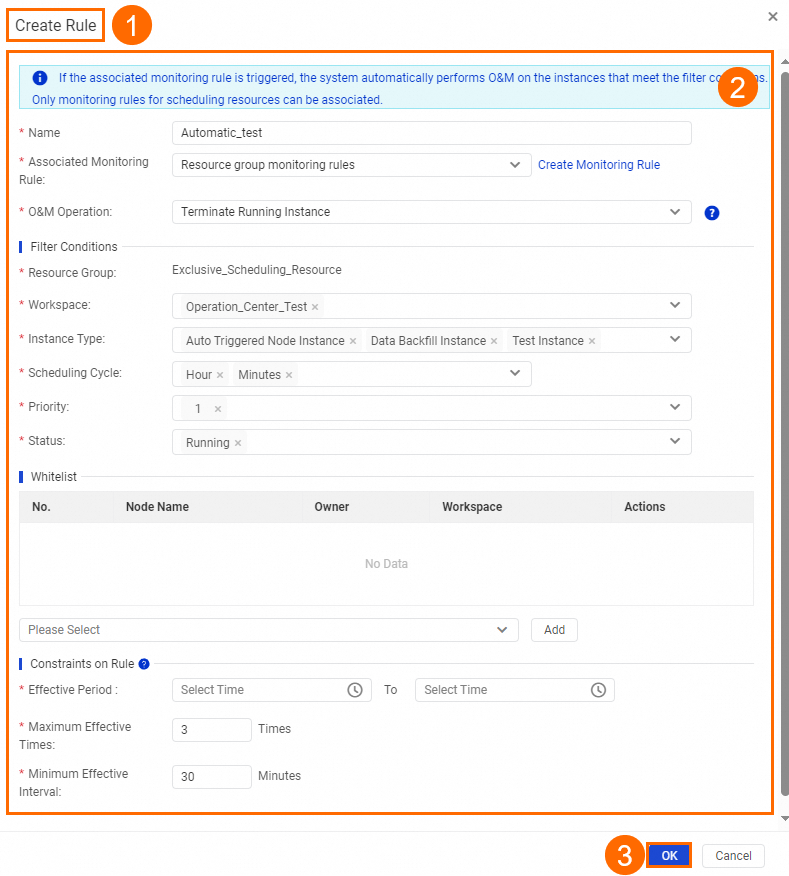
Create an automatic O&M rule linked to the monitoring rule.
-
In the left navigation pane, choose O&M Assistant > Automatic O&M.
-
On the Rule Management tab, click Add Rule and configure the rule. For details, see Create an automatic O&M rule for a resource group.
-
Key parameters:
| Parameter | Description |
|---|---|
| Associated monitoring rule | Select a monitoring rule for an exclusive resource group for scheduling. Create the monitoring rule first before configuring this field. |
| O&M action | Currently, only Stop Running Instance is supported. Instances that meet the filter conditions are stopped when the rule triggers. |
The following example creates an automatic O&M rule named Automatic_test associated with Resource group monitoring rules. When the utilization of Exclusive_Scheduling_Resource exceeds 90% for 10 minutes, DataWorks stops priority-1 hourly and minute instances (recurring, test, and backfill) running on that resource group in the specified workspace.
More operations
Operation Center supports extension points for node freezing, restoring, data backfill, and unpublishing. Use these with extension programs to build custom logic and automate O&M workflows. For details, see Overview of extensions and Application example: Check for triggering events in Operation Center.
What to do next
Set up Data Quality monitoring rules for the tables produced by your nodes to make sure the output data meets your expectations. For details, see Data Quality.