Slow batch sync jobs waste pipeline time and can block downstream processes. Data Integration tasks can be slow for several reasons — waiting on scheduling or execution resources, slow reads or writes, low concurrency, or misconfigured split keys. This topic explains how to use task logs to pinpoint the bottleneck stage, tune concurrency and split keys to maximize throughput, and apply rate limiting to protect production databases.
What affects synchronization speed
Four categories of factors determine how fast a sync job runs:
| Factor | Details |
|---|---|
| Source database | CPU, memory, disk, and network bandwidth. Higher concurrency increases database load — better-performing databases can sustain higher concurrency settings. |
| Scheduling resource group | Offline sync tasks are submitted by a scheduling resource group to a data integration resource group for execution. Scheduling resource usage affects overall efficiency. |
| Task configuration | Maximum transfer speed, concurrency (threads reading from source or writing to destination in parallel), WAIT resources, Bytes setting (default: 1,048,576 bytes per thread — reduce this value if network timeouts occur), and whether query statements use indexes. |
| Destination database | CPU, memory, disk, and network bandwidth. High destination load reduces write efficiency. |
Diagnose slow sync jobs
Open the task log and Detail log to identify which execution stage is slow. The following table summarizes each stage and its key log signal:
| Stage | Log signal | What it means |
|---|---|---|
| Waiting for scheduling resources | Task is waiting for the gateway; long resource wait time on the instance properties page | Scheduling resource group is at its task limit |
| Waiting for execution resources | wait in the task log |
Data integration resource group has insufficient remaining concurrency slots |
| Slow data reading | run with speed 0; high WaitReaderTime in Detail log |
Task is waiting a long time to receive data from the source |
| Slow data writing | run with speed 0; high WaitWriterTime in Detail log |
Task is taking a long time to write data to the destination |
| Non-zero speed but slow overall | run with non-zero speed; total duration far exceeds estimates |
Low concurrency, misconfigured split key, dirty data, or database load |
The stage with the longest wait time is your bottleneck. Start troubleshooting there.
For more information about offline sync task logs, see Offline sync log analysis.
Stage 1: Waiting for scheduling resources
Symptoms:
-
The task log shows that the task is waiting for the gateway.
-
The instance properties page shows a long resource wait time.
Cause: The scheduling resource group has reached its maximum task limit. New tasks wait until running tasks complete and release resources.
Fix: Go to the Operation Analysis page to see which tasks are using resources while the current task waits.
If you use shared resource groups for scheduling, migrate your tasks to an exclusive resource group or a Serverless resource group.
Stage 2: Waiting for execution resources
Symptom: The task log shows wait.
Cause: The data integration resource group has insufficient remaining concurrency slots for the task.
For example: a resource group supports a maximum of 8 concurrent slots. If two tasks are running with a concurrency of 3 each, they use 6 slots, leaving 2 available. A third task that requires 3 concurrent slots must wait.
Fix:
-
Go to the Operation Analysis page to see which tasks are consuming resources.
-
Check whether any running tasks are stuck or unusually slow. If so, stop or resolve them first.
-
If tasks are running normally, wait for them to complete and release resources.
-
Coordinate with task owners to reduce the concurrency of competing tasks.
-
Reduce the concurrency of the current task and resubmit it.
-
Scale out the resource group. For more information, see Scaling operations.
The maximum number of concurrent slots varies by resource group specification. For more information, see Performance metrics and billing.
Stage 3: Slow data reading (high WaitReaderTime)
Symptom: The task log shows run with a speed of 0. The Detail log shows a large value for WaitReaderTime, indicating the task is waiting a long time for data from the source.
Causes:
-
The split key is not configured properly, causing the data retrieval SQL to run slowly.
-
The
whereorquerySqlparameters are not indexed, causing a full table scan. -
The source database is under high load at sync time.
-
Network bandwidth or latency issues.
Synchronization speed over the public network cannot be guaranteed.
Fix:
-
Index the fields used for data filtering to avoid full table scans.
-
Avoid or reduce complex functions in pre-SQL or post-SQL statements. If needed, run these operations in the database before synchronization starts.
-
If the source table is very large, split the task into multiple smaller tasks.
-
Query the logs to identify the blocking SQL statement and work with your database administrator to resolve it.
-
Check the source database load at the time of synchronization.
Stage 4: Slow data writing (high WaitWriterTime)
Symptom: The task log shows run with a speed of 0. The Detail log shows a large value for WaitWriterTime, indicating the task is taking a long time to write to the destination.
Causes:
-
The
preSqlorpostSqlstatements in the writer plug-in are running slowly. -
The destination database is under high load at sync time.
-
Network bandwidth or latency issues.
Synchronization speed over the public network cannot be guaranteed.
Fix:
-
Review and optimize the
preSqlandpostSqlstatements in the writer plug-in configuration. -
Check the destination database load at the time of synchronization.
Stage 5: Non-zero speed but overall progress is slow
Symptom: The task log shows run with a non-zero speed, but the sync job takes much longer than expected.
Causes:
-
The split key for a relational database task is not configured or is configured improperly, making the concurrency setting ineffective. The task runs with a single thread instead of the configured concurrency.
-
The concurrency setting is too low.
-
A large volume of dirty data is generated during synchronization.
-
Database performance is insufficient to sustain the configured concurrency.
-
Network bandwidth or latency issues.
Synchronization speed over the public network cannot be guaranteed.
Fix:
-
Configure the split key properly. For configuration steps, see Configure a task in the codeless UI.
-
Increase task concurrency. Within the maximum concurrency quota supported by the resource group, plan concurrency across all tasks and increase the current task's concurrency as needed. Configure concurrency in the codeless UI, or set it directly in the code editor. For resource group limits, see Performance metrics and billing. For distributed tasks, ensure that:
task concurrency ÷ number of machines in resource group ≤ maximum concurrency per machine -
Handle dirty data. For more information, see Data Integration.
-
Use a private network for cross-cloud or cross-region sync. For network connectivity options, see Network connectivity solutions.
-
Check the database load at the time of synchronization.
Limit synchronization speed
By default, Data Integration tasks run at the highest possible speed within the configured concurrency limit. High speeds can put excessive pressure on your production database. Use rate limiting to cap throughput.
Keep the rate limit at or below 30 MB/s to avoid overloading your production database.
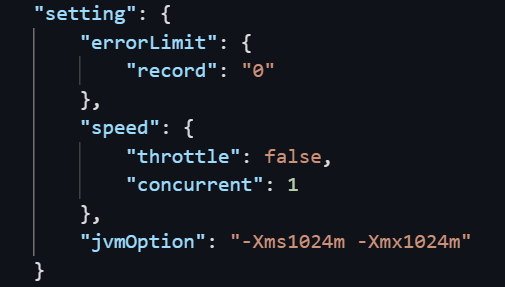
The following example sets a rate limit of 1 MB/s in the code editor:
"setting": {
  "speed": {
    "throttle": true,  // Set to true to enable rate limiting.
    "mbps": 1          // The rate limit in MB/s.
  }
}
`throttle` behavior:
-
true: Rate limiting is enabled. You must setmbpsto a specific value. Ifmbpsis not set, the task fails or behaves abnormally. -
false: Rate limiting is disabled. Thembpsvalue is ignored.
Traffic measurement: The rate measured by Data Integration reflects internal channel traffic, not actual network interface controller (NIC) traffic. NIC traffic is typically 1–2 times the channel traffic, depending on how the data storage system serializes data.
Rate limiting for semi-structured files: Single semi-structured files cannot be split and do not use a split key. For multiple files, set a job rate limit to increase throughput. The effective maximum rate depends on the number of files. For n files:
-
A limit of
n+1MB/s results innMB/s actual throughput. -
A limit of
n-1MB/s results inn-1MB/s actual throughput.
Rate limiting for relational databases: Set both a job rate limit and a split key. The split key enables table partitioning in line with the rate limit. Relational databases typically support only numeric split keys. Oracle databases support both numeric and string split keys.
FAQ
-
BatchSize and maxfilesize: These parameters control the number of records committed per batch. Larger values reduce network round trips and improve throughput, but setting them too high can cause an out-of-memory (OOM) error in the sync process. If an OOM error occurs, see FAQ about offline synchronization.
Appendix: View actual concurrency
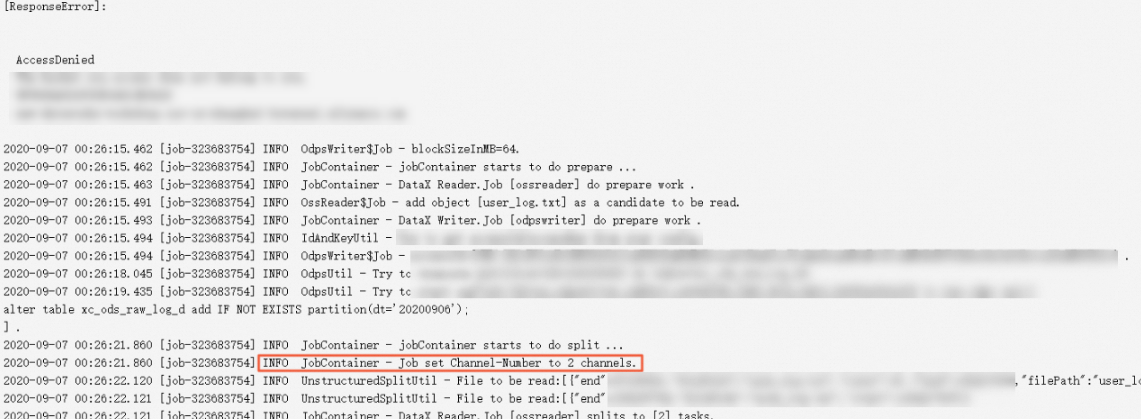
On the task log details page, find a log entry similar to:
JobContainer - Job set Channel-Number to 2 channelsThe channels value is the actual concurrency the task is using.
Appendix: Concurrency and resource usage in exclusive resource groups
Understanding how concurrency maps to CPU and memory helps you plan task submissions and avoid resource contention.
Concurrency and CPU
In an exclusive resource group, the ratio of concurrency to vCPU is 1:0.5. An ECS instance with 4 vCPUs and 8 GiB of memory provides a concurrency quota of 8. This means:
-
Up to 8 offline sync tasks with a concurrency of 1, or
-
Up to 4 offline sync tasks with a concurrency of 2.
If a newly submitted task requires more concurrency than the remaining quota, it waits until running tasks complete and release resources.
If a task's concurrency exceeds the maximum quota of the resource group, it waits indefinitely and blocks subsequent tasks. For example, submitting a task with a concurrency of 10 to a resource group on a 4 vCPU / 8 GiB ECS instance means the task never runs.
Concurrency and memory
Memory usage per task in an exclusive resource group follows this formula:
Min{768 + (concurrency - 1) × 256, 8029} MBOverride this in the code editor by setting the $.setting.jvmOption JSON path.
To keep tasks stable, total memory used by all running tasks must stay at least 1 GB below the total memory of all machines in the resource group. If this threshold is exceeded, the Linux OOM Killer may forcibly stop tasks.
If you do not override memory settings in the code editor, only the concurrency quota limit applies when planning task submissions.
Appendix: Synchronization speed reference
The following tables list average single-concurrency throughput for common connectors in an exclusive resource group. Use these values as a baseline when estimating expected sync duration and setting concurrency.
These figures are measured under controlled conditions in an exclusive resource group. Actual throughput varies depending on your database performance, network conditions, data volume, and resource group specification.
Writer plug-ins
| Writer | Average single-concurrency speed (KB/s) |
|---|---|
| AnalyticDB for PostgreSQL | 147.8 |
| AnalyticDB for MySQL | 181.3 |
| ClickHouse | 5,259.3 |
| DataHub | 45.8 |
| DRDS | 93.1 |
| Elasticsearch | 74.0 |
| FTP | 565.6 |
| GDB | 17.1 |
| HBase | 2,395.0 |
| hbase20xsql | 37.8 |
| HDFS | 1,301.3 |
| Hive | 1,960.4 |
| HybridDB for MySQL | 323.0 |
| HybridDB for PostgreSQL | 116.0 |
| Kafka | 0.9 |
| LogHub | 788.5 |
| MongoDB | 51.6 |
| MySQL | 54.9 |
| ODPS | 660.6 |
| Oracle | 66.7 |
| OSS | 3,718.4 |
| OTS | 138.5 |
| PolarDB | 45.6 |
| PostgreSQL | 168.4 |
| Redis | 7,846.7 |
| SQLServer | 8.3 |
| Stream | 116.1 |
| TSDB | 2.3 |
| Vertica | 272.0 |
Reader plug-ins
| Reader | Average single-concurrency speed (KB/s) |
|---|---|
| AnalyticDB for PostgreSQL | 220.3 |
| AnalyticDB for MySQL | 248.6 |
| DRDS | 146.4 |
| Elasticsearch | 215.8 |
| FTP | 279.4 |
| HBase | 1,605.6 |
| hbase20xsql | 465.3 |
| HDFS | 2,202.9 |
| Hologres | 741.0 |
| HybridDB for MySQL | 111.3 |
| HybridDB for PostgreSQL | 496.9 |
| Kafka | 3,117.2 |
| LogHub | 1,014.1 |
| MongoDB | 361.3 |
| MySQL | 459.5 |
| ODPS | 207.2 |
| Oracle | 133.5 |
| OSS | 665.3 |
| OTS | 229.3 |
| OTSStream | 661.7 |
| PolarDB | 238.2 |
| PostgreSQL | 165.6 |
| RDBMS | 845.6 |
| SQLServer | 143.7 |
| Stream | 85.0 |
| Vertica | 454.3 |