View details of published metric assets, including properties, data preview, lineage, and quality scores.
Prerequisites
You have purchased the Asset Management value-added service and the current tenant has activated the Asset Management module.
Limits
For PolarDB-X (formerly DRDS), SAP HANA, IBM DB2, or OceanBase (MySQL or Oracle tenant mode) data sources, tables and their custom metrics do not support applying for consumption permissions or support data preview.
Metric asset details
-
In the top navigation bar of the Dataphin homepage, choose Asset > Asset Catalog.
-
On the Metrics tab, click the target asset name to open its details page.
Area
Description
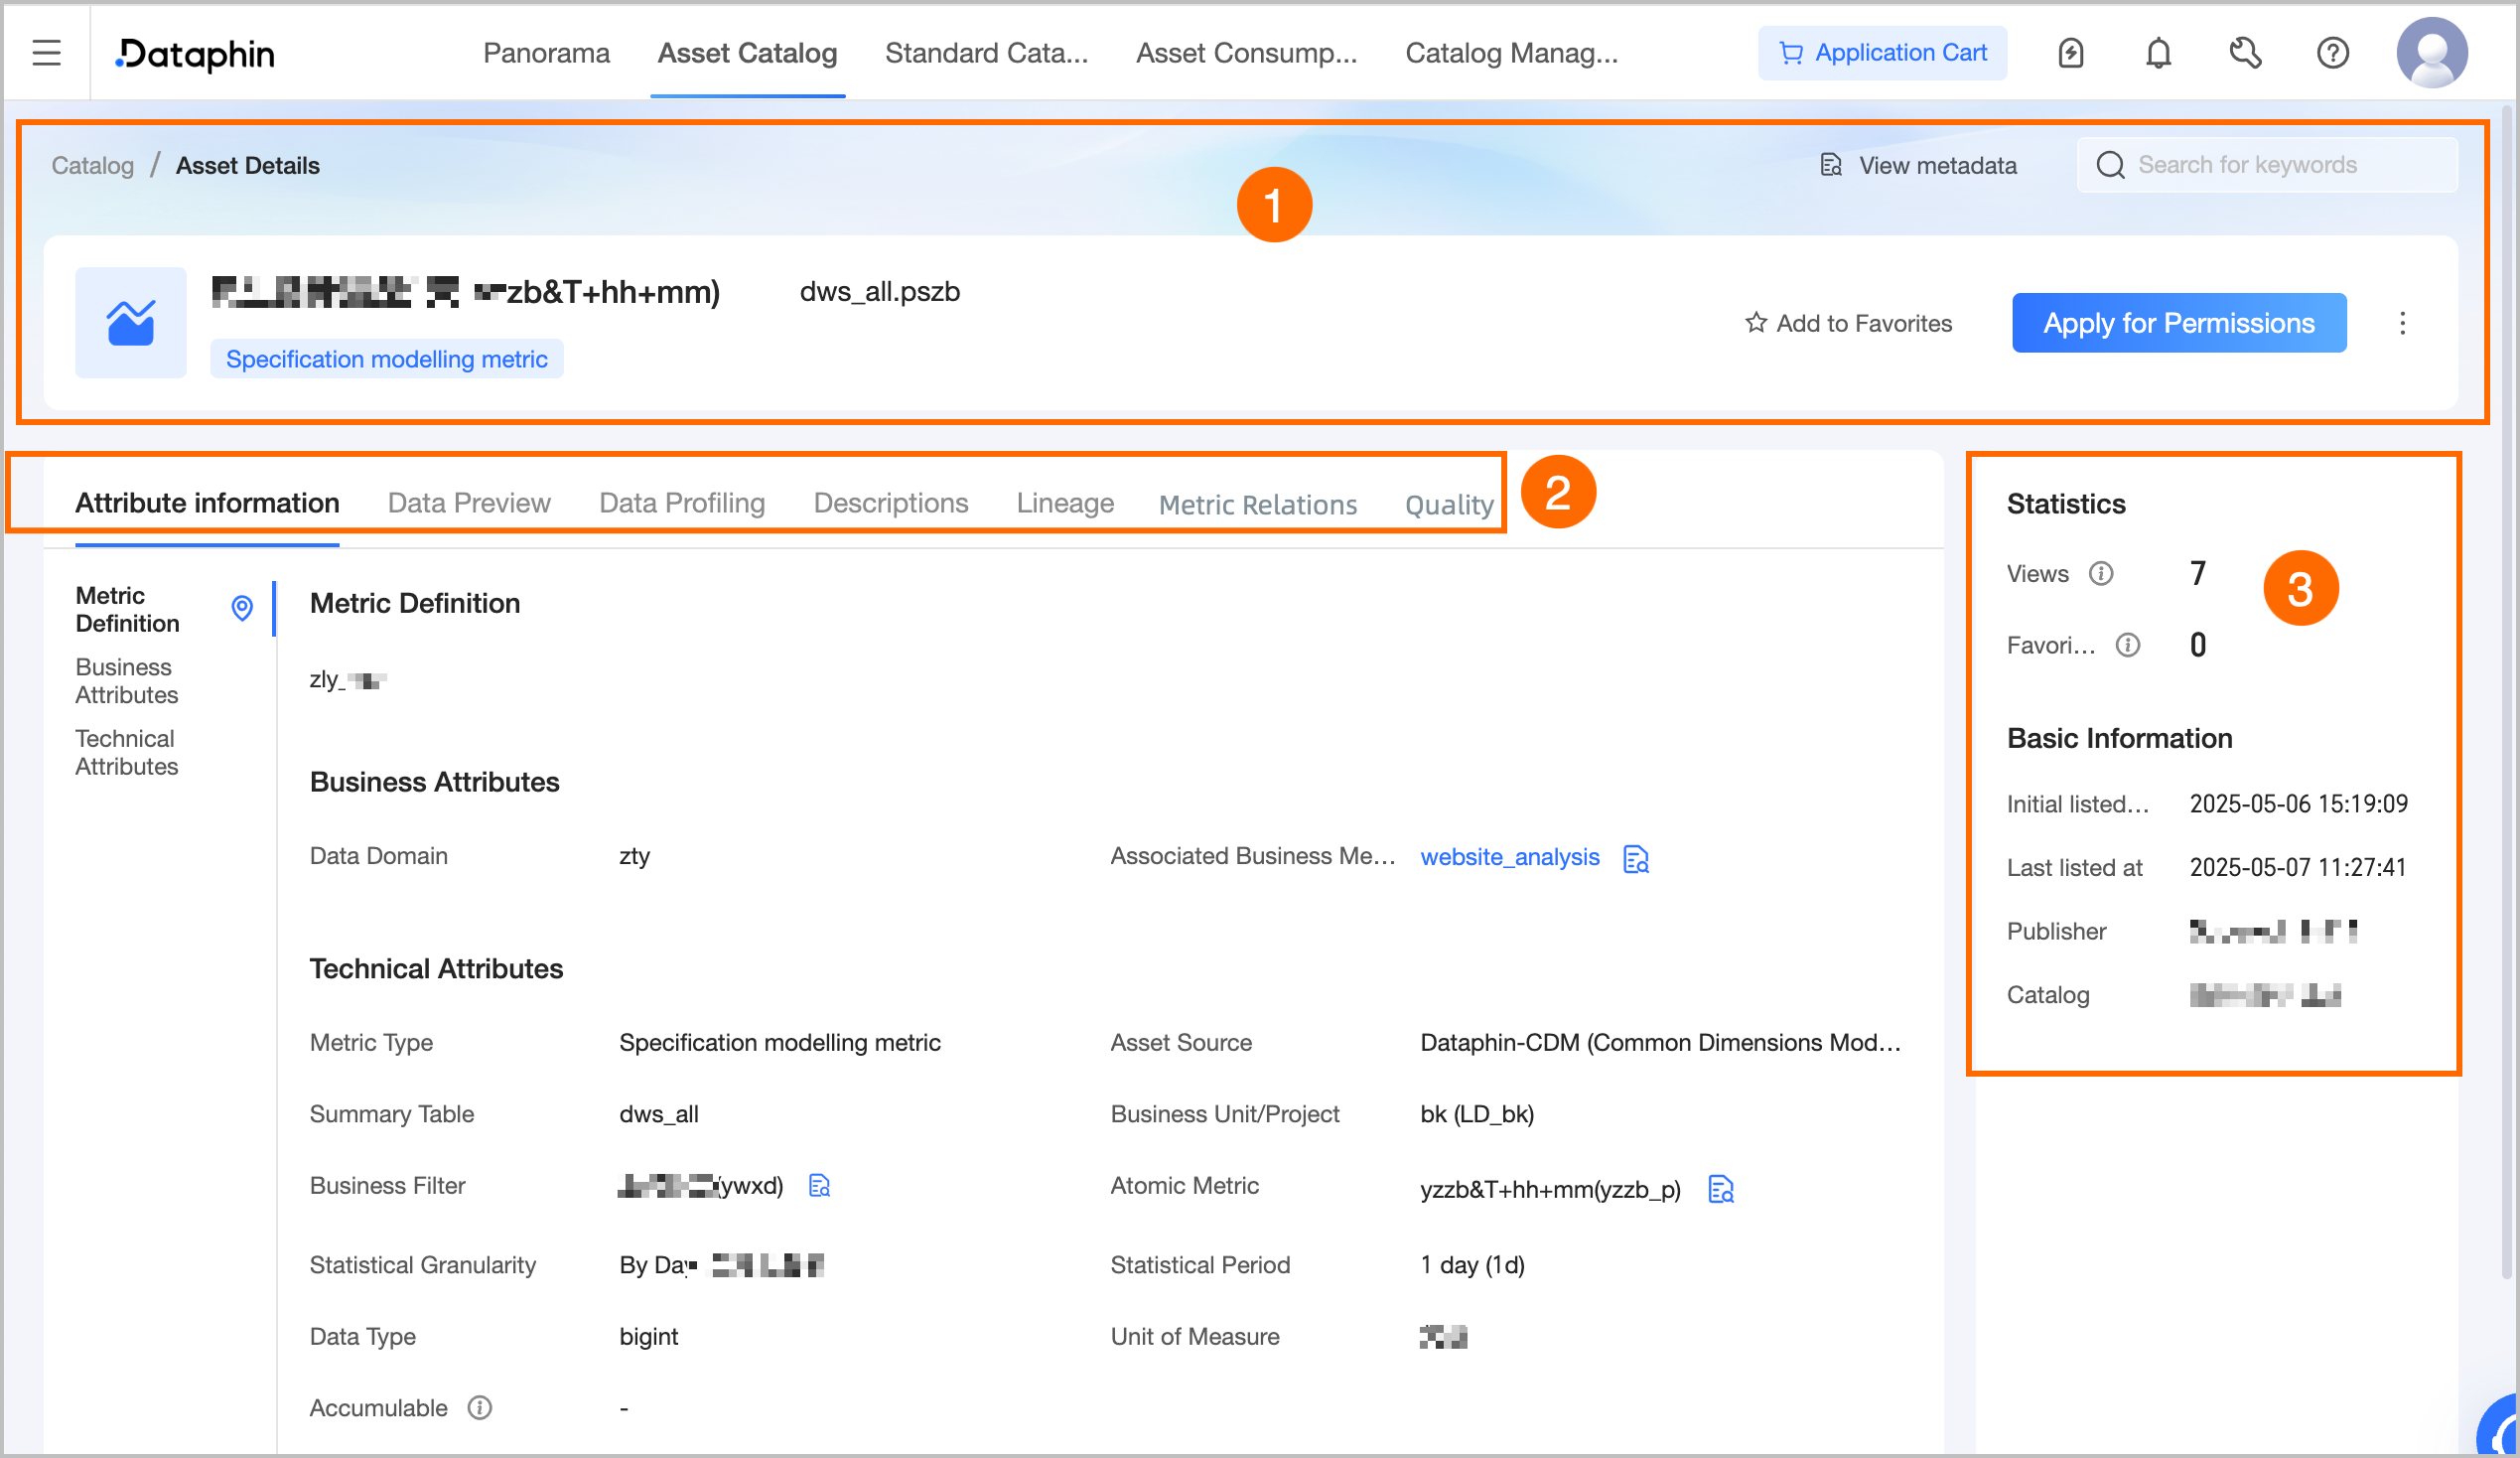
①Overview
Shows the metric name, type, description, and tags. Available operations:
-
View Metadata: Opens the metric details page in the asset inventory. Not supported for custom metrics.
-
Search Assets: Search for and navigate to other asset details pages.
-
Favorite: Add or remove from favorites. Favorited assets appear in Personal Data Center. View and manage my favorited assets.
-
Apply For Permission: Opens the permission application page for the current table. Apply for, renew, and return table permissions.
-
Listing Management: Opens the edit page for this metric asset in catalog management to modify property information and usage instructions. Edit asset information.
-
Report Quality Issues: Click the
 icon and select Report Quality Issues. Report issues such as unstable data production or inaccurate data to the quality owner for resolution. Add and manage issue lists.
Requires the Data Quality module. Reported issues and their progress appear in the quality module's issue list.
②Basic Information
-
Property Information: Includes metric definition, business properties, and technical properties.
-
Metric Definition: Only modeling metrics support viewing this. Displays the metric definition filled in Development > Develop > Metrics.
-
Business Properties: Shows the subject area and associated business metrics.
Associated Business Metrics: Click a business metric name to open its details page in the asset catalog.
-
Technical Properties: Displays the metric type, asset source, aggregate table, data domain, business filter, atomic metric, statistical granularity, statistical period, data type, measurement unit, and whether it is additive.
-
Aggregate Table: Shows the table name. Click the name to open its details page in the asset catalog if you have viewing permissions.
-
Atomic Metric/Business Filter: Custom metrics do not support this operation. Click the View icon after the metric name to view the calculation logic of the metric.
-
Statistical Granularity: You can view the entity names that make up the statistical granularity. Click the View icon to see the name, code, description, domain, and subject area information of each entity. You can also perform the following operations:
-
View Details: Click to navigate to Planning > Data Architecture to view detailed information under the business entity tab.
-
View Entity Relationship Diagram: Click to open the Entity Relationship Diagram panel to view the entity relationship diagram centered on this business entity.
-
-
-
Custom Properties: Shows properties created in Data Warehouse Planning > Attribute Management that are visible in the asset catalog, categorized as business, management, and technical properties.
-
-
Data Preview: After applying for consumption permissions, preview up to 50 records for fields you have select permissions on. To apply for permissions (if the asset consumption feature is activated, see Apply for Consumption Permissions), see Apply for, renew, and return table permissions, Apply for consumption permissions.
Filter, search, view row details, adjust column width, and transpose rows and columns. Click a field's sort icon for No Sort, Ascending, or Descending order. Double-click a value to copy it.
-
Data Exploration: Requires the Data Quality feature. If the metric's table has exploration results, view the exploration report for the metric value field.
-
Usage Instructions: Must be enabled on the edit page of manually listed metric assets. Shows usage instructions for the asset as reference for data consumers.
-
Lineage: Lineage needs to be enabled on the edit page of manually listed metric assets. Displays the direct lineage relationship with the current asset as the central node, including assets that are not yet listed or for which you do not have viewing permissions, but you cannot view their details. For more information, see Metric lineage.
-
Metric Relationship: Must be a modeling metric and have the metric relationship diagram enabled on the edit page of manually listed metric assets. Displays the metric relationship diagram with the current asset as the root node. For more information, see Metric relationship diagram.
-
Quality Overview: Requires enabling the quality overview on the edit page of manually listed metric assets and purchasing the Data Quality module. Displays the quality score overview and rule verification details for the current metric. For more information, see Quality overview.
③Asset Information
Displays detailed information about the metric, including Usage Statistics and Basic Information.
-
Usage Statistics: Includes the page views and number of favorites for the metric.
-
Page Views: Shows the PV count for this metric, incremented on each page refresh and updated in real-time. Counts only asset catalog details page views.
-
Number Of Favorites: Shows how many users have favorited this metric, updated in real-time.
-
-
Basic Information: Includes the initial listing time, most recent listing time, publisher, and catalog to which it belongs.
-
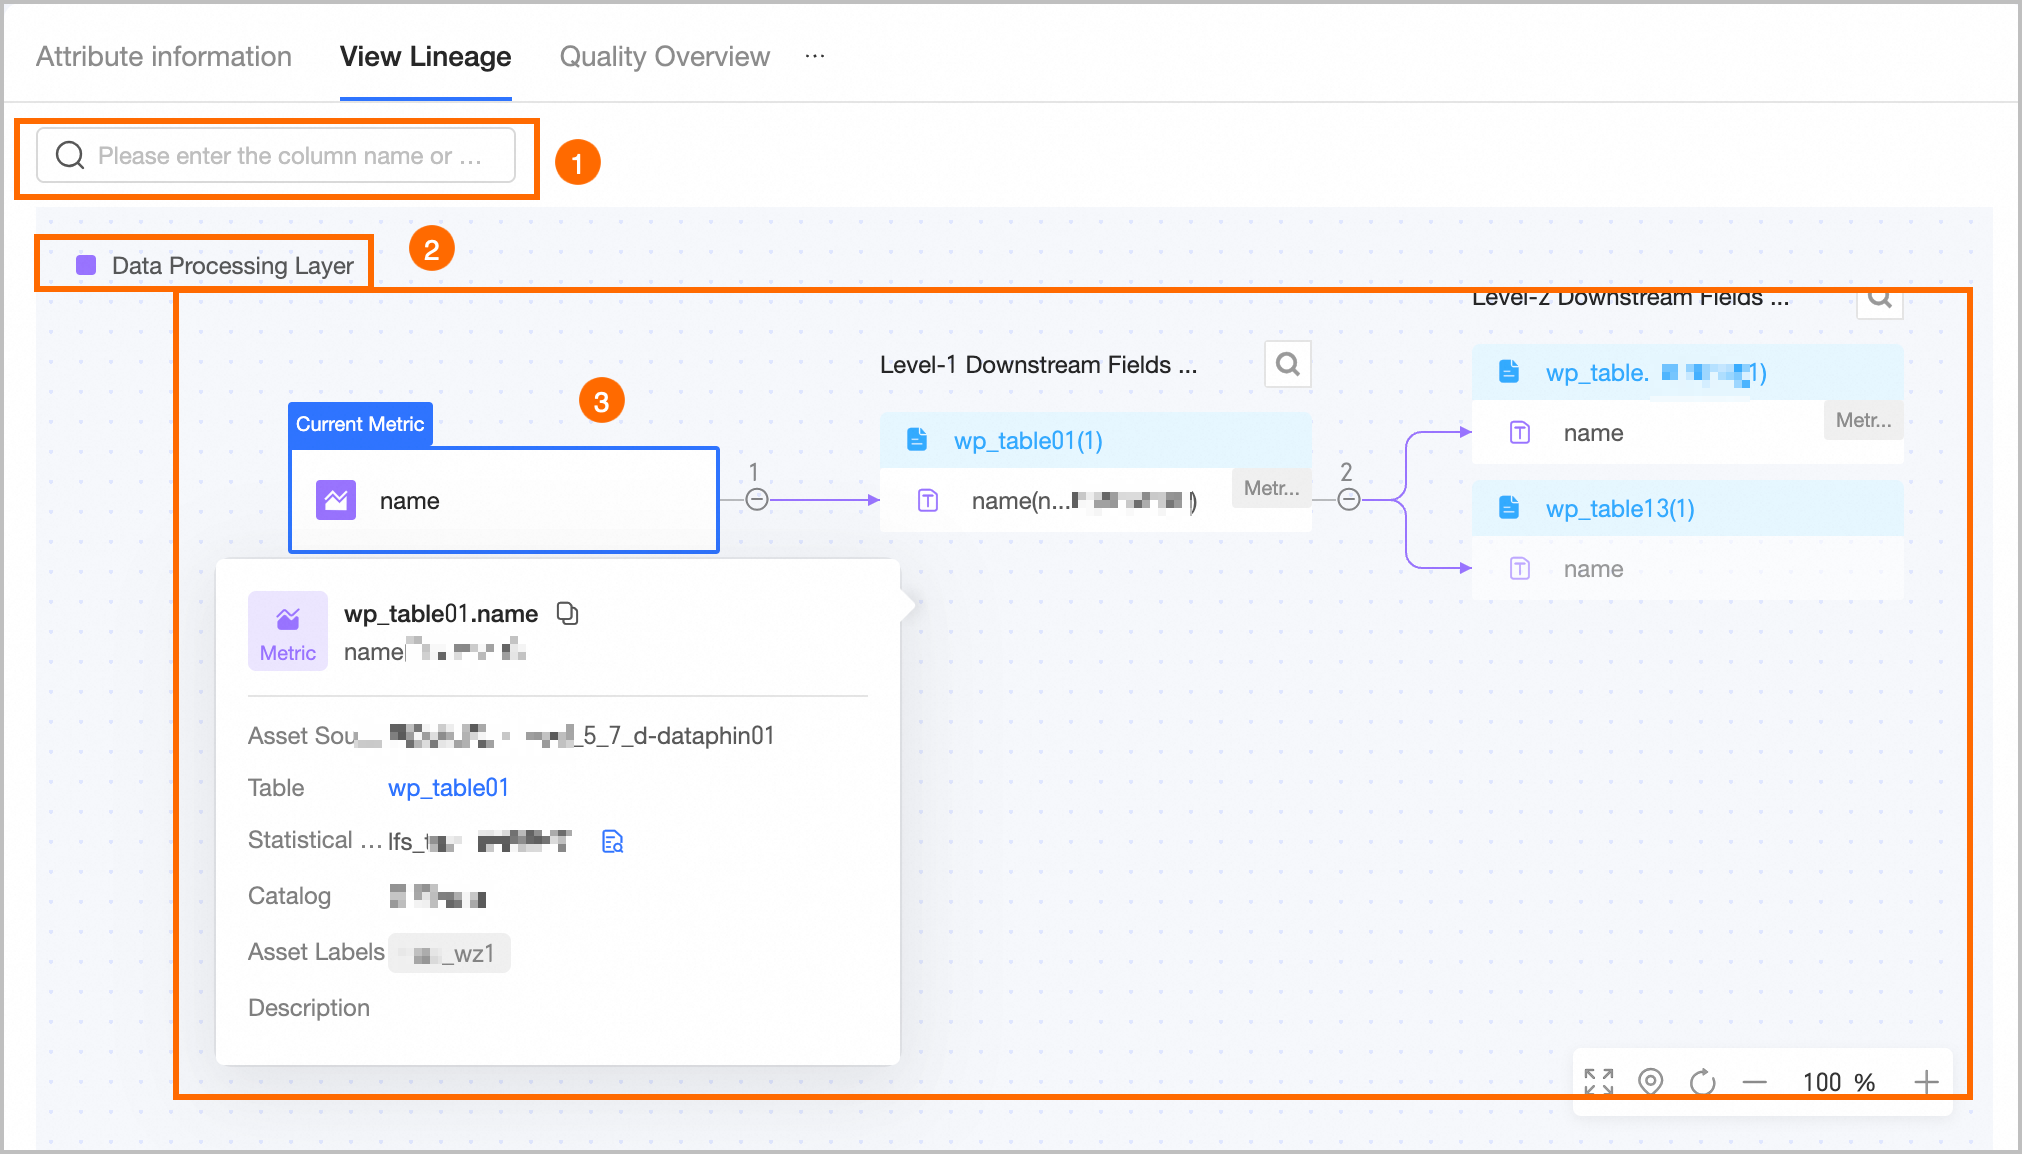
Metric lineage
|
Area |
Description |
|
①Search |
Search expanded nodes by field name. Use the left/right arrows or keyboard arrow keys to cycle through matches. Defaults to the first match. |
|
②Legend |
Shows the hierarchy levels: business systems (data source tables, custom metric systems), data collection layer (source layer), data transformation layer (intermediate layer, logical table/modeling metric systems), application data layer, DataService Studio, report application layer, and common layer. |
|
③Lineage diagram display |
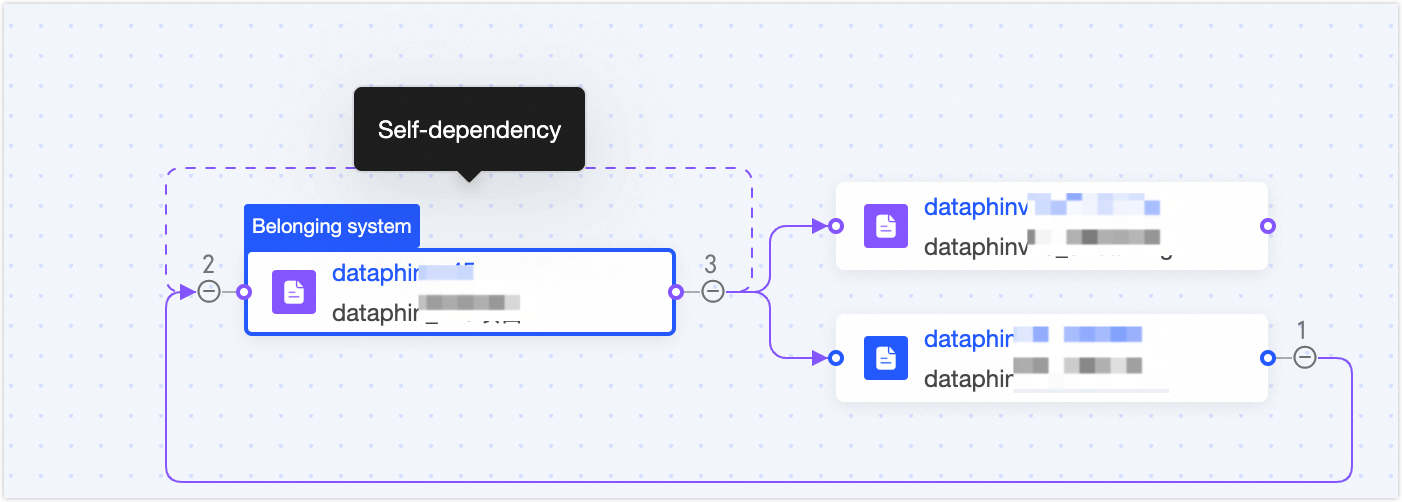
Shows the full lineage chain. Expand multiple levels upstream or downstream manually. Supports fuzzy search by field name. Circular dependencies block further expansion — continue from the starting node instead.
|
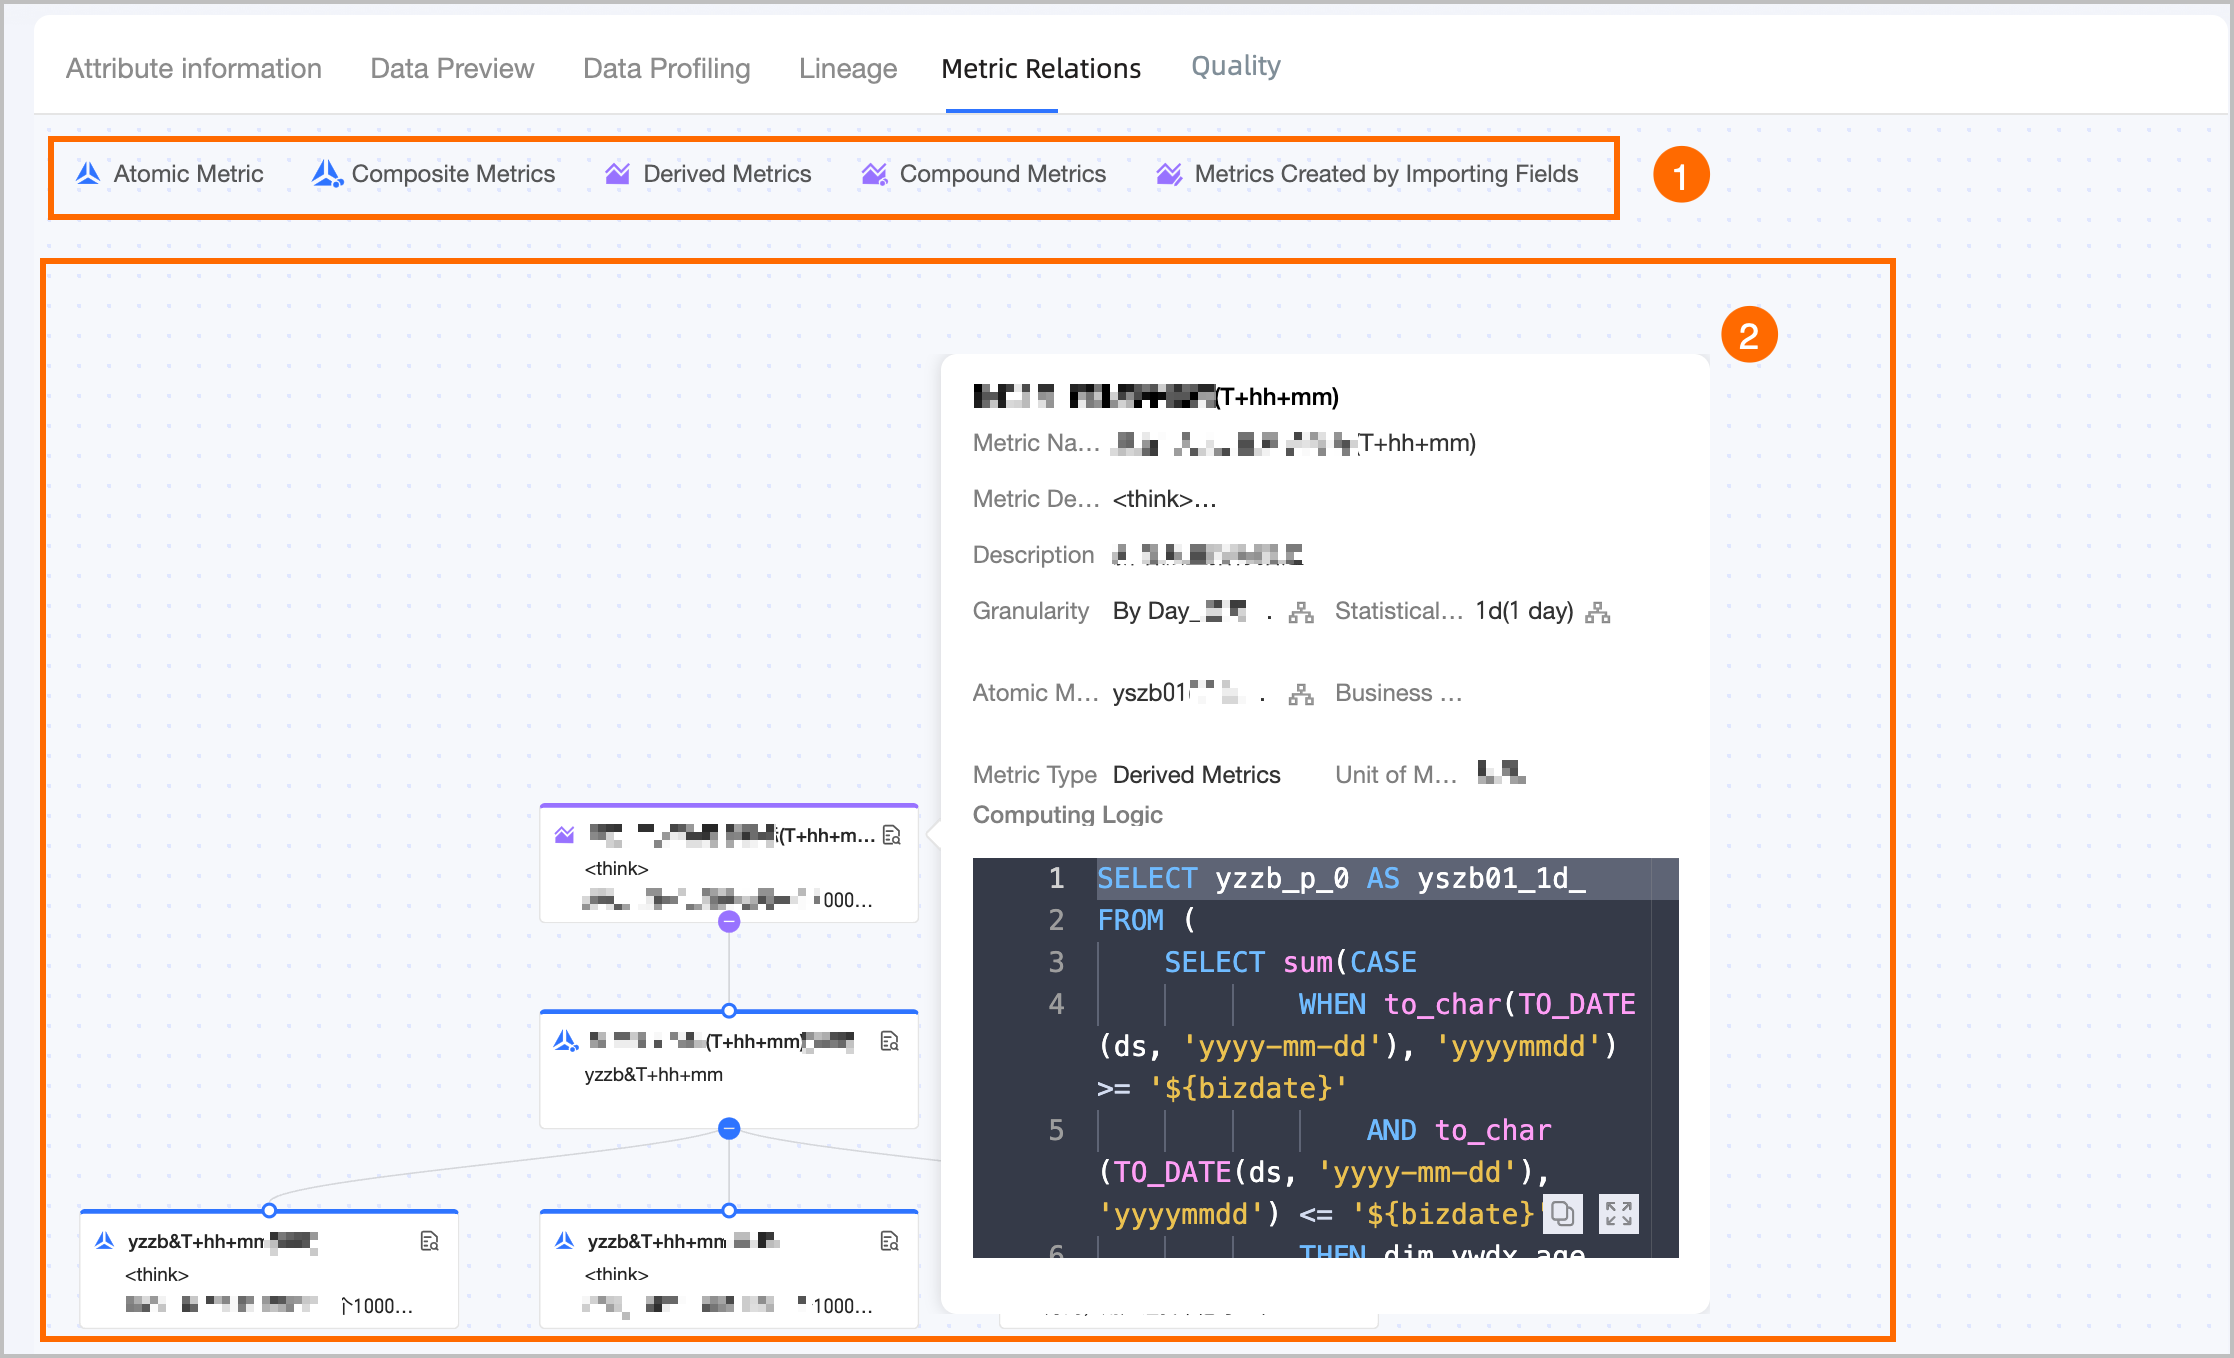
Metric relationship diagram
|
Area |
Description |
|
①Legend |
Displays the metric types in the metric relationship diagram, including atomic metrics, composite metrics, derived metrics, derived composite metrics, and registered metrics. |
|
②Metric relationship diagram |
Shows the processing logic relationships with the current metric as the root node. Hover over a metric to view its name, measurement unit, and definition. View Details: Only listed metrics with viewing permissions support this. Information varies by metric type.
Note
|
Quality overview
|
Area |
Description |
|
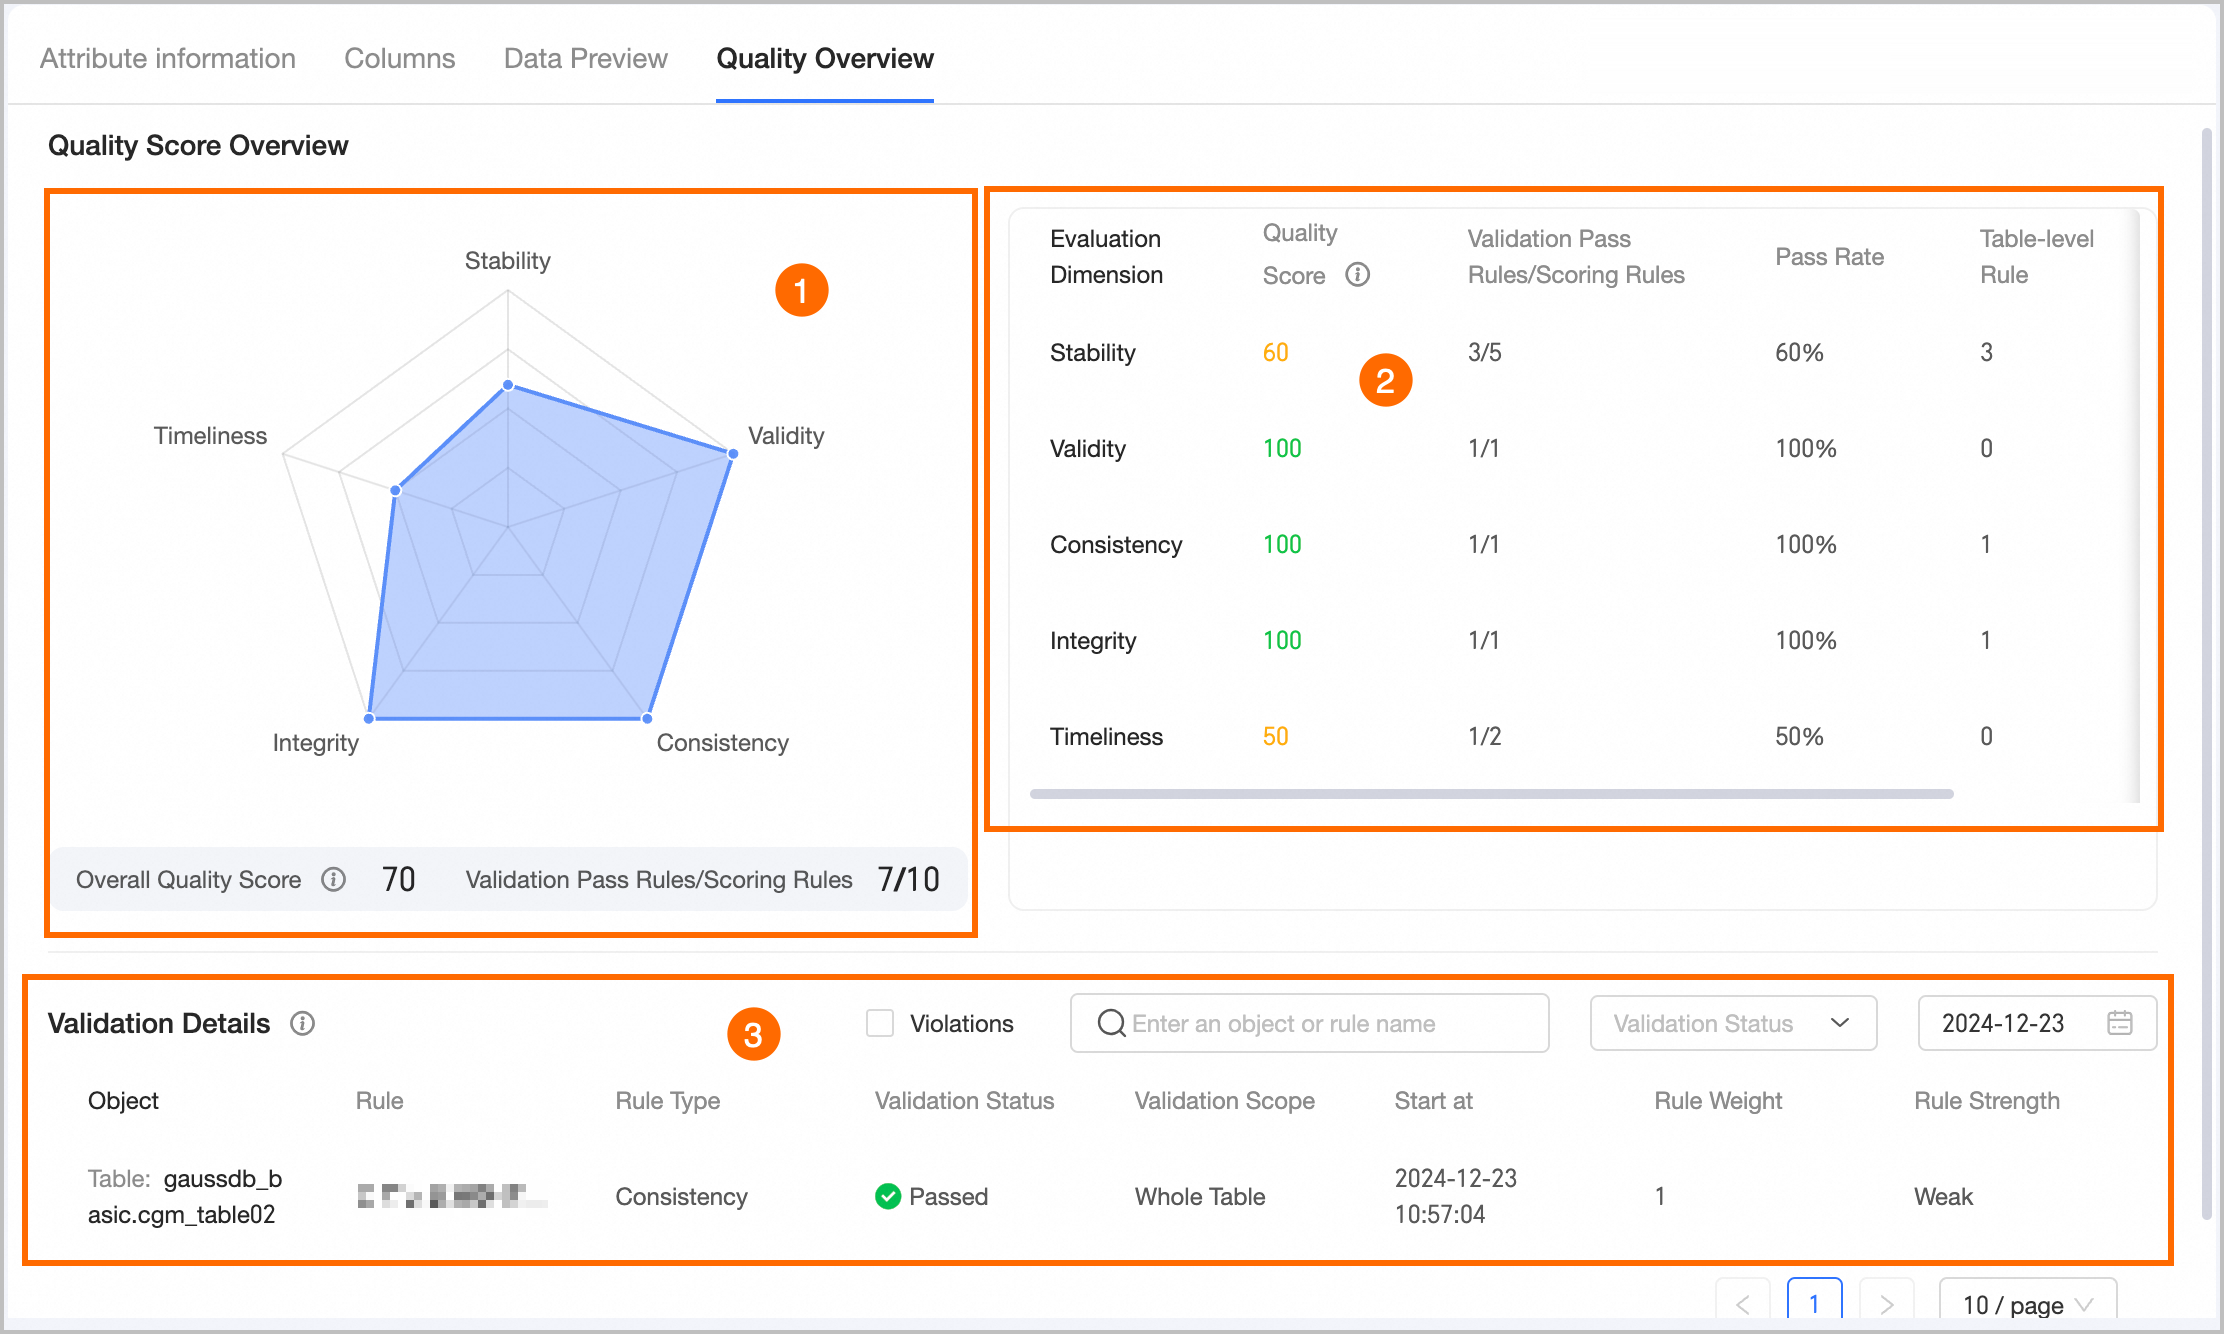
①Quality score radar chart |
Shows the quality characteristics radar chart, overall quality score, and passed rules/scoring rules for the current metric.
|
|
②Score list |
Shows quality characteristic assessment details: dimension, score, passed/scoring rules, pass rate, and table-level and field-level rule counts.
|
|
③Rule verification details |
Must be enabled on the edit page of manually listed table assets. Filter by date, verification status, or rule name, or use the Abnormal Results filter.
|