ACK clusters are compatible with Managed Service for Prometheus and Grafana. This saves you the need to develop a self-managed monitoring system and create dashboards. After you deploy applications in Knative, you can ingest the monitoring data of Knative to Managed Service for Prometheus and view the monitoring data, such as the response latency, number of concurrent requests, and CPU and memory usage, in Grafana dashboards.
Prerequisites
Knative is deployed in the ACS cluster. For more information, see Deploy Knative.
Billing rules
After ingesting the Knative monitoring data to Managed Service for Prometheus, the corresponding components can automatically send monitoring metrics to Managed Service for Prometheus. These metrics are treated as custom metrics. Fees are charged for custom metrics.
Before you enable this feature, we recommend that you read Billing overview to understand the billing rules of custom metrics. The fees may vary based on the cluster size and number of applications. You can follow the steps in View resource usage to monitor and manage resource usage.
Enable Managed Service for Prometheus
Log on to the ACS console. In the left-side navigation pane, click Clusters.
On the Clusters page, find the cluster that you want to manage and click its ID. In the left-side navigation pane of the cluster details page, choose .
On the Knative page, click the Monitoring Dashboards tab and click Enable Prometheus Dashboard.
View the Knative dashboard
After Managed Service for Prometheus is enabled, you can view the monitoring data on the Monitoring Dashboards tab.
Category | Description |
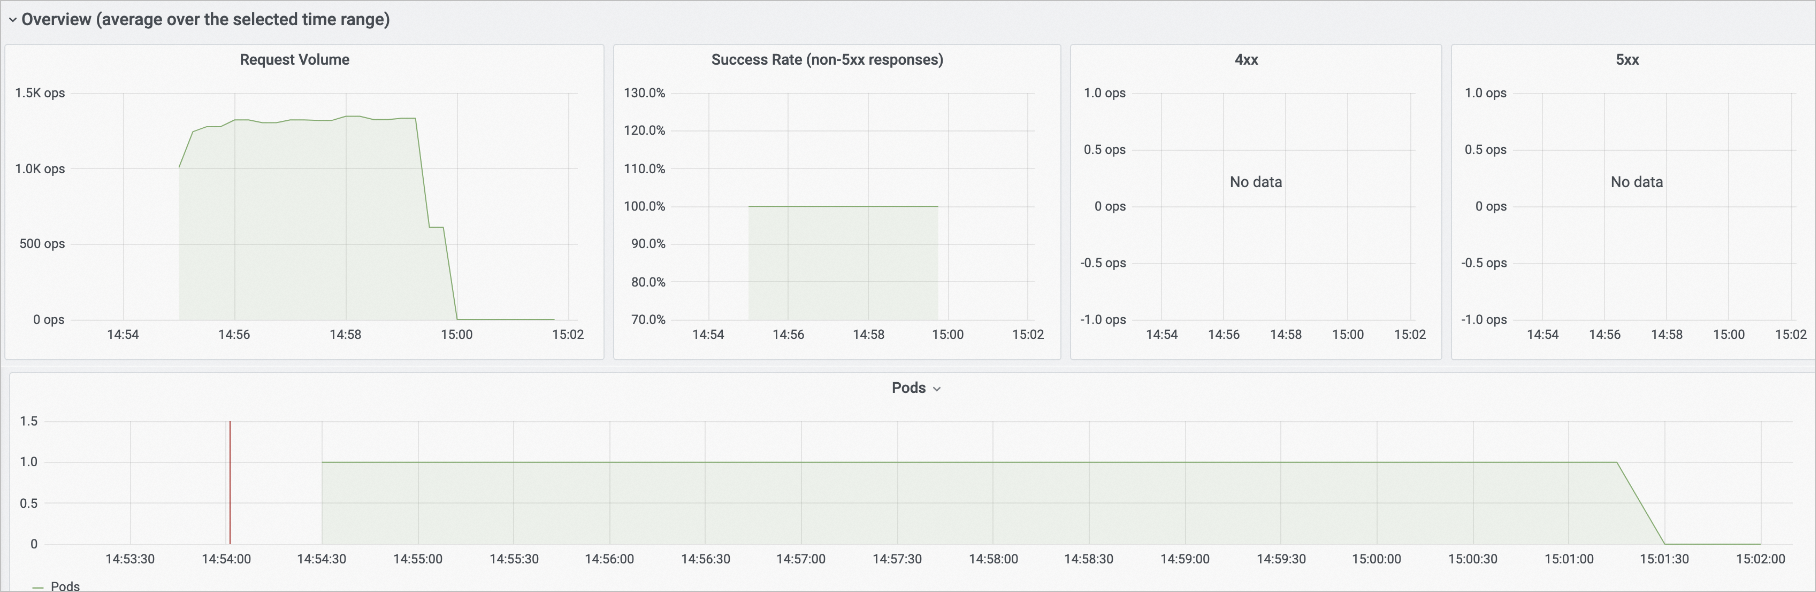
Request data | In the Overview (average over the selected time range) section, you can view the number of Knative requests (Request Volume), request success rate (Success Rate), client errors (4xx), server errors (5xx), and pod scaling trend. Note The vertical axis ops/sec of the Request Volume, 4xx, and 5xx charts indicates the number of requests processed per second.
|
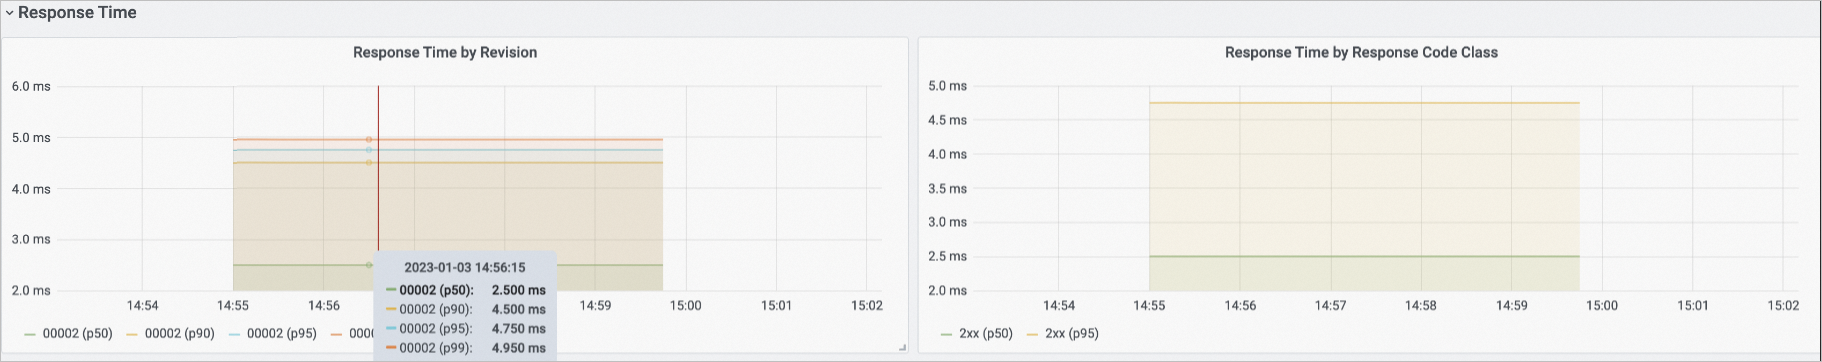
Response latency data | In the Response Time section, you can view the response latency data of Knative, including the P50, P90, P95, and P99 response latency. |
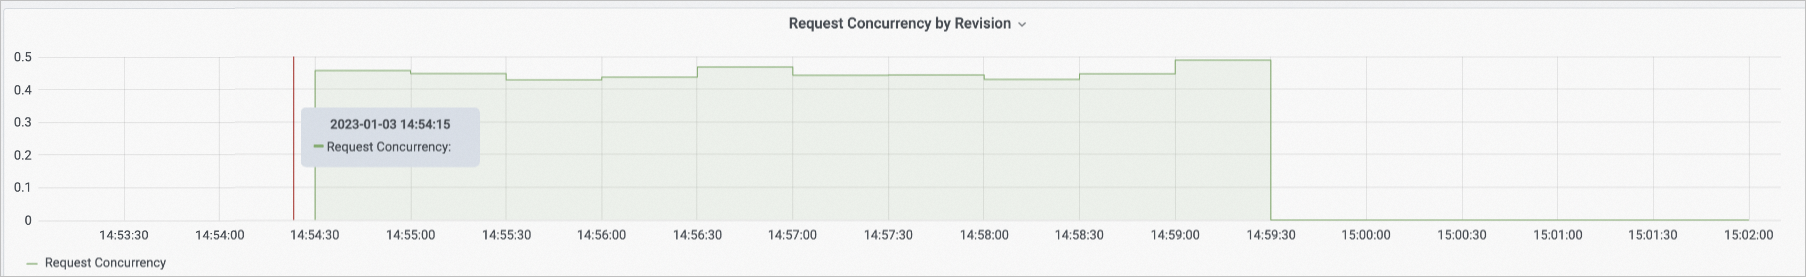
Request concurrency data | In the Autoscaler section, you can view detailed information about the request concurrency of Knative. |
| |
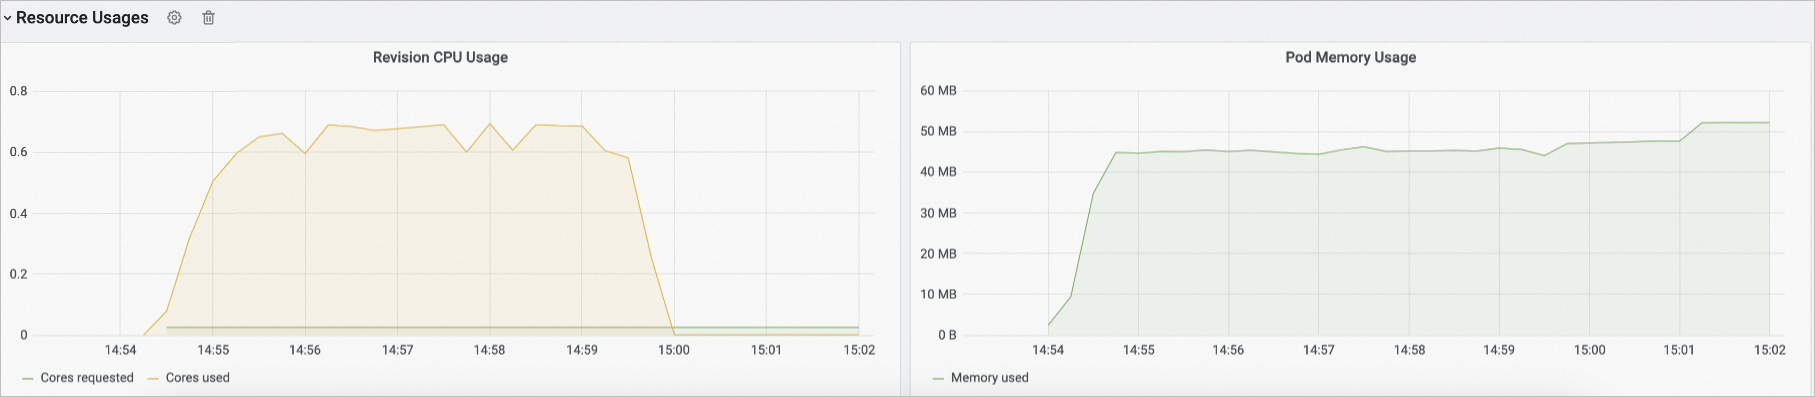
Resource usage | In the Resource Usages section, you can view the usage information of Knative resources, including CPUs and memory. |
View key service discovery metrics of Knative
In the left-side navigation pane of the ARMS console, click Integration Management. Click Container Service on the Integrated Environments tab, click the name of the corresponding Prometheus instance. On the Container Service page, click the Metric Scraping tab to view the Knative Service discovery metrics. The following table describes the key service discovery metrics of Knative.
When the number of pods for a Knative application is scaled to zero, metrics such as the request concurrency and the number of requests sent per second cannot be collected by Managed Service for Prometheus. The console displays these metrics only after traffic is forwarded to the pods of the Knative application.
When the number of pods for a Knative application is not zero, you can directly view the metrics, such as the request concurrency and the number of requests sent to a pod per second, in the console. You do not need to access the pods of the Knative application.
Metric | Description |
queue_average_concurrent_requests | The number of concurrent requests sent to the pod. |
queue_requests_per_second | The number of requests sent to the pod per second. |
revision_request_latencies | The response latency. |
revision_request_count | The number of revision requests. |
References
To use Simple Log Service to collect logs and generate alerts based on monitoring data, see Enable Simple Log Service on Knative and Configure alerting for Knative Services.