Use Simple Log Service (SLS) to collect logs and alert on Knative Service anomalies. Configure alert monitoring rules such as check frequency and trigger conditions, set notification policies, and notify operators and developers via DingTalk, SMS, or email when a service fault occurs so the service keeps running.
How it works
Knative alerting uses a three-stage pipeline:
-
Query — SLS runs a SQL query against your Logstore at a configured frequency to detect error patterns.
-
Evaluate — SLS checks whether the query results meet your alert trigger conditions.
-
Notify — When conditions are met, SLS sends notifications through your configured channels.
Prerequisites
Complete the following:
-
Log collection is enabled for the Knative Service.
Step 1: Query and analyze logs
Build and verify the query your alert rule uses to detect errors. For query syntax, see Query and analyze logs.
-
Log on to the SLS console.
-
In the Projects section, click your project.

-
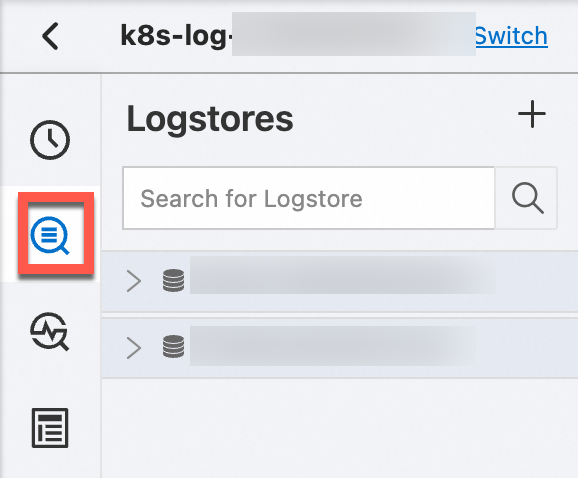
In the left-side navigation pane, click Log Storage. In the Logstores list, click your Logstore.
-
Enter a query in the search box and click Search & Analyze.
To monitor Services by error count, use this query. It counts log records with the error field, grouped by type.
* | select 'ERROR' , count(1) as total group by 'ERROR'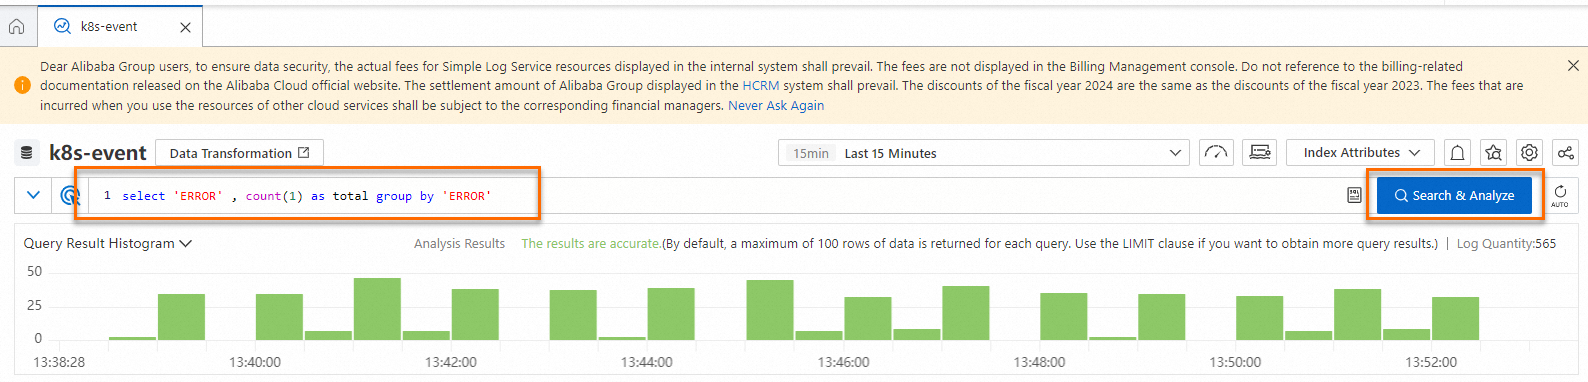
Step 2: Configure an alert monitoring rule
From the Logstore query page in the SLS console:
-
Click the
 icon.
icon.
-
In the Alert Monitoring Rules section, configure your alert rule.
Key parameters to set:
Parameter Description Example Check frequency How often SLS evaluates your query. Lower values detect faster but cost more. Every 1 minute Trigger condition The threshold that causes the alert to fire. Fire when error count exceeds 0 All parameters are documented in Create log alert monitoring rules.
-
Configure a notification policy for alert recipients and channels (DingTalk, SMS, or email). See Quickly set log alerts.
-
Verify the alert. Send a request to
helloworld-goto trigger an error in the logs:curl -H "Host: helloworld-go.default.example.com" http://<Gateway IP>Replace
<Gateway IP>with your gateway IP and update the domain to match your setup.Expected response:
Hello Knative!After each check interval, SLS evaluates query results against your trigger condition and sends alerts through your configured notification channels.
Next steps
Visualize Knative monitoring data in real time on a Grafana dashboard with Prometheus Service. See View Knative service monitoring dashboard.