Collect Knative Service container text logs by running a log agent on each node through a DaemonSet for non-invasive collection. Install a log collection component on your ACK cluster so logs from all containers on each node are forwarded to Simple Log Service (SLS) for management and analysis.
Prerequisites
Before you begin, make sure you have:
-
Knative is deployed in your cluster.
Step 1: Install a log collection component
ACK supports two log collection components: LoongCollector and Logtail. Install one component per cluster — you cannot run both at the same time.
| Component | Status | When to use |
|---|---|---|
| LoongCollector | Canary release | New clusters in supported regions |
| Logtail (logtail-ds) | Generally available | Existing clusters or regions not yet supported by LoongCollector |
Install LoongCollector
LoongCollector, SLS's next-generation log agent, upgrades Logtail with planned Application Real-Time Monitoring Service (ARMS) integration, including Managed Service for Prometheus and eBPF-based data collection. See LoongCollector-based data collection.
loongcollector and logtail-ds cannot coexist. If logtail-ds is installed, you cannot upgrade directly — an upgrade path is coming soon.
-
Log on to the ACK console. In the left-side navigation pane, click Clusters.
-
On the Clusters page, click the cluster you want to manage. In the left-side navigation pane, choose Operations > Add-ons.
-
On the Logs and Monitoring tab, find the loongcollector component and click Install.
After installation, SLS automatically creates a project named k8s-log-${your_k8s_cluster_id} and the following resources:
| Resource type | Resource name | Description | Example |
|---|---|---|---|
| Machine group | k8s-group-${your_k8s_cluster_id} |
Machine group for loongcollector-ds, used for log collection | k8s-group-my-cluster-123 |
| Machine group | k8s-group-${your_k8s_cluster_id}-cluster |
Machine group for loongcollector-cluster, used for metric collection | k8s-group-my-cluster-123-cluster |
| Machine group | k8s-group-${your_k8s_cluster_id}-singleton |
Machine group for a single instance, used to create LoongCollector configurations | k8s-group-my-cluster-123-singleton |
| Logstore | config-operation-log |
Stores loongcollector-operator logs. Do not delete this Logstore. | config-operation-log |
Install Logtail
Logtail is an SLS agent that collects logs from multiple sources — including ECS instances, on-premises servers, and third-party cloud servers — without code changes. See Logtail-based data collection.
Install Logtail in an existing ACK cluster
-
Log on to the ACK console. In the left-side navigation pane, click Clusters.
-
On the Clusters page, click the target cluster. In the left-side navigation pane, choose Operations > Add-ons.
-
On the Logs and Monitoring tab, find the logtail-ds component and click Install.
Install Logtail when creating an ACK cluster
-
Log on to the ACK console. In the left-side navigation pane, click Clusters.
-
On the Clusters page, click Create Kubernetes Cluster. In the Component Configurations step, select Enable Log Service. Only SLS settings are covered here. See Create an ACK managed cluster for other settings. Choose how to create the SLS project:
-
Select Project: use an existing project to manage collected container logs.
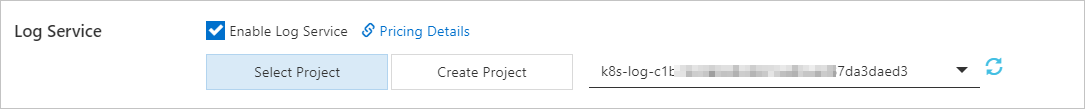
-
Create Project: SLS automatically creates a project. The project name includes the
ClusterIDof the new cluster.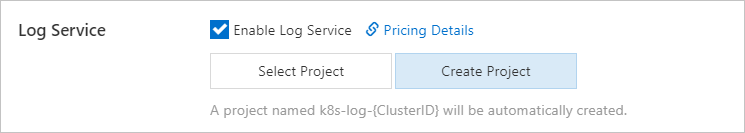
ImportantIn the Component Configurations step, Enable is selected by default for Control Plane Component Logs. When enabled, the system automatically collects logs from the cluster's control plane components and charges you based on the pay-as-you-go billing method. Decide whether to enable this based on your requirements. See Collect logs of control plane components in ACK managed clusters.

-
After installation, SLS automatically creates a project named k8s-log-<YOUR_CLUSTER_ID> and the following resources:
| Resource type | Resource name | Description | Example |
|---|---|---|---|
| Machine group | k8s-group-<YOUR_CLUSTER_ID> |
Machine group for logtail-daemonset, used for log collection | k8s-group-my-cluster-123 |
| Machine group | k8s-group-<YOUR_CLUSTER_ID>-statefulset |
Machine group for logtail-statefulset, used for metric collection | k8s-group-my-cluster-123-statefulset |
| Machine group | k8s-group-<YOUR_CLUSTER_ID>-singleton |
Machine group for a single instance, used to create Logtail configurations | k8s-group-my-cluster-123-singleton |
| Logstore | config-operation-log |
Stores alibaba-log-controller logs. Avoid creating a Logtail configuration for this Logstore. You can delete it; operational log collection stops after deletion. Charged the same as regular Logstores. See Billable items of pay-by-ingested-data. | — |
Step 2: Create a collection configuration
Choose one method to create a collection configuration. Use only one per configuration.
| Method | Best for |
|---|---|
| CRD - AliyunPipelineConfig (recommended) | Complex collection and processing; version consistency between the Logtail configuration and the Logtail container in an ACK cluster. Requires logtail-ds later than V1.8.10. |
| SLS console | Simple settings via GUI; some advanced features and custom settings are not available. |
| Environment variables | Simple settings only; single-line text logs; no complex processing. Supports collecting from multiple apps to the same or different Logstores. |
| CRD - AliyunLogConfig | Legacy scenarios using the old CRD. Migrate to AliyunPipelineConfig for better extensibility and stability. |
CRD - AliyunPipelineConfig (recommended)
Recommended for new configurations. Better extensibility and stability than AliyunLogConfig, with support for complex collection and processing pipelines. Requires Logtail V0.5.1+.
Create a Custom Resource (CR) from the AliyunPipelineConfig CRD. The configuration applies automatically. To modify it, update the CR.
Key constraints:
-
The
configNamevalue must be unique within the SLS project. -
Create one CR per Logtail configuration. If multiple CRs reference the same configuration, only the first CR takes effect.
Steps:
-
Get the kubeconfig file and connect to your cluster using kubectl.
-
Create a YAML file:
vim cube.yaml -
Add the configuration to the YAML file. See the examples below.
-
Apply the configuration:
kubectl apply -f cube.yamlLogtail starts collecting logs from the specified containers and sending them to SLS.
After collection starts, create indexes in the Logstore to enable querying and analysis.
Collect single-line text logs from specific containers
This example creates a Logtail configuration named example-k8s-file to collect single-line text logs from containers whose names contain app. The log file is test.LOG at path /data/logs/app_1. Logs are stored in Logstore k8s-file in project k8s-log-test.
apiVersion: telemetry.alibabacloud.com/v1alpha1
# Create a CR from the ClusterAliyunPipelineConfig CRD.
kind: ClusterAliyunPipelineConfig
metadata:
  # The name must be unique in the Kubernetes cluster. It is also used as the Logtail configuration name.
  name: example-k8s-file
spec:
  # Specify the project to collect logs into.
  project:
    name: k8s-log-test
  # Create a Logstore to store logs.
  logstores:
    - name: k8s-file
  config:
    inputs:
      # Use input_file to collect text logs from containers.
      - Type: input_file
        # Log file path inside the containers.
        FilePaths:
          - /data/logs/app_1/**/test.LOG
        # Enable container discovery.
        EnableContainerDiscovery: true
        # Filter containers. Multiple conditions use logical AND.
        ContainerFilters:
          # Match containers in the default namespace.
          K8sNamespaceRegex: default
          # Match containers whose name contains "app".
          K8sContainerRegex: ^(.*app.*)$
    flushers:
      # Use flusher_sls to send logs to a Logstore.
      - Type: flusher_sls
        Logstore: k8s-file
        # For valid endpoint and region values, see https://www.alibabacloud.com/help/en/sls/developer-reference/service-entrance
        Endpoint: cn-hangzhou.log.aliyuncs.com
        Region: cn-hangzhou
        TelemetryType: logs
See (Recommended) Use AliyunPipelineConfig to manage a Logtail configuration and CreateLogtailPipelineConfig.
Collect multi-line text logs from all containers
This example creates a Logtail configuration named example-k8s-file to collect multi-line text logs from all containers in a cluster. The log file is test.LOG at path /data/logs/app_1. Logs are parsed with a regular expression and stored in Logstore k8s-file in project k8s-log-test.
The input_file plug-in reads logs in the format {"content": "2024-06-19 16:35:00 INFO test log\nline-1\nline-2\nend"} and the processor_parse_regex_native plug-in parses them into {"time": "2024-06-19 16:35:00", "level": "INFO", "msg": "test log\nline-1\nline-2\nend"}.
apiVersion: telemetry.alibabacloud.com/v1alpha1
# Create a CR from the ClusterAliyunPipelineConfig CRD.
kind: ClusterAliyunPipelineConfig
metadata:
  name: example-k8s-file
spec:
  project:
    name: k8s-log-test
  logstores:
    - name: k8s-file
  config:
    # Optional: add a sample log for reference.
    sample: |
      2024-06-19 16:35:00 INFO test log
      line-1
      line-2
      end
    inputs:
      - Type: input_file
        FilePaths:
          - /data/logs/app_1/**/test.LOG
        EnableContainerDiscovery: true
        # Enable multi-line log collection.
        Multiline:
          # Use a custom regex to identify the first line of each log entry.
          Mode: custom
          StartPattern: \d+-\d+-\d+.*
    processors:
      # Parse logs using a regular expression. Capturing groups define extracted fields.
      - Type: processor_parse_regex_native
        SourceKey: content
        Regex: (\d+-\d+-\d+\s*\d+:\d+:\d+)\s*(\S+)\s*(.*)
        Keys: ["time", "level", "msg"]
    flushers:
      - Type: flusher_sls
        Logstore: k8s-file
        Endpoint: cn-hangzhou.log.aliyuncs.com
        Region: cn-hangzhou
        TelemetryType: logs
CRD - AliyunLogConfig
Create a CR from the AliyunLogConfig CRD. The configuration is applied automatically. To modify it, update the CR.
If multiple CRs reference the same Logtail configuration, modifying or deleting one CR affects all others and causes status inconsistency with SLS.
Steps:
-
Get the kubeconfig file and connect to your cluster using kubectl.
-
Create a YAML file:
vim cube.yaml -
Add the configuration. See the example below. The
configNamevalue must be unique in the SLS project. -
Apply the configuration:
kubectl apply -f cube.yaml
After collection starts, create indexes to enable querying and analysis.
Collect single-line text logs from specific containers
This example creates a configuration named example-k8s-file to collect single-line text logs from pods whose names begin with app. The log file is test.LOG at path /data/logs/app_1. Logs are stored in Logstore k8s-file in project k8s-log-test.
apiVersion: log.alibabacloud.com/v1alpha1
kind: AliyunLogConfig
metadata:
  name: example-k8s-file
  namespace: kube-system
spec:
  # If left blank, the project named k8s-log-<your_cluster_id> is used.
  project: k8s-log-test
  # If the specified Logstore does not exist, SLS creates it automatically.
  logstore: k8s-file
  logtailConfig:
    # Set to "file" for text logs.
    inputType: file
    configName: example-k8s-file
    inputDetail:
      # Simple mode for text logs.
      logType: common_reg_log
      logPath: /data/logs/app_1
      # Supports wildcard characters (* and ?). Example: log_*.log
      filePattern: test.LOG
      # Required for container log collection.
      dockerFile: true
      advanced:
        k8s:
          K8sPodRegex: '^(app.*)$'
See Use AliyunLogConfig to manage a Logtail configuration and CreateConfig.
SLS console
-
Log on to the Simple Log Service console.
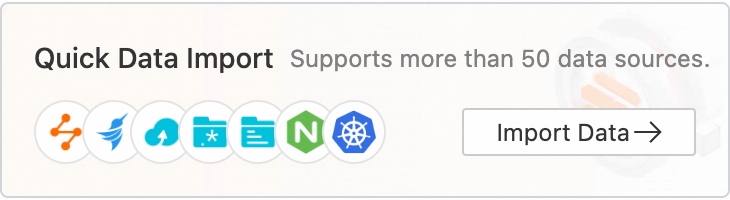
-
In the Quick Data Import section, click Import Data. In the Import Data dialog box, click the Kubernetes - File card.
-
Select the project and Logstore, then click Next. Use the project created during Logtail installation.
-
In the Machine Group Configurations step, configure the following:
-
Select a machine group option based on your setup:
-
Kubernetes Clusters > ACK Daemonset
-
Kubernetes Clusters > Self-managed Cluster in DaemonSet Mode
ImportantSubsequent settings vary based on which option you select.
-
-
Confirm the machine groups appear in Applied Server Groups, then click Next. SLS automatically creates a machine group named
k8s-group-${your_k8s_cluster_id}during Logtail installation.Important-
To create a new machine group, click Create Machine Group and configure the parameters. See Collect container logs from ACK clusters.
-
If a machine group's heartbeat status is FAIL, click Automatic Retry. If the issue persists, see How do I troubleshoot an error related to a Logtail machine group?
-
-
-
Create a Logtail configuration and click Next. Log collection begins after creation. Container filtering options Available for Logtail 1.0.34+. Earlier versions: environment variables and container labels only.
-
K8s Pod Name Regular Matching: Match containers by pod name using a regular expression. Example:
^(nginx-log-demo.*)$matches all containers in pods whose name starts withnginx-log-demo. -
K8s Namespace Regular Matching: Match containers by namespace. Example:
^(default|nginx)$matches containers in thenginxanddefaultnamespaces. -
K8s Container Name Regular Matching: Match containers by container name (as defined in
spec.containers). Example:^(container-test)$matches containers namedcontainer-test. -
Container Label Whitelist / Blacklist: Filter containers by container labels (key-value pairs). Kubernetes namespaces and container names map to the labels
io.kubernetes.pod.namespaceandio.kubernetes.container.name. Key-value pairs are evaluated with OR logic. String matching is the default; prefix with^and suffix with$for regex matching. -
Environment Variable Whitelist / Blacklist: Filter containers by environment variable key-value pairs. OR logic applies. Example: set Environment Variable Name to
NGINX_SERVICE_PORTand Environment Variable Value to^(80|6379)$to match containers on port 80 or 6379. -
Kubernetes Pod Label Whitelist / Blacklist: Filter containers by Kubernetes pod labels (distinct from container labels). OR logic applies. Example: set Label Name to
environmentand Label Value to^(dev|pre)$to match containers with pod labelsenvironment:devorenvironment:pre.
Note A Logtail configuration takes up to 3 minutes to take effect.ImportantContainer labels (retrieved via
docker inspect) differ from Kubernetes labels. See Obtain labels and Obtain environment variables.Global configurations
Parameter Description Configuration name Unique name within the project. Cannot be changed later. Log topic type Log topic source. Machine Group Topic: by machine group. File Path Extraction: regex on file path. Custom: user-defined. See Log topics. Advanced parameters Optional. See CreateLogtailPipelineConfig. Input configurations
Parameter Description Logtail deployment mode Select Daemonset for this use case. File path type Select Path in Container in most cases. Select Host Path only for hostPath-mounted volumes. File path Specify the log file path. Linux paths start with /(example:/apsara/nuwa//app.Log`). Windows paths start with a drive letter (example: `C:\Program Files\Intel\\*.Log). Use*and?as wildcard characters only. Examples:/apsara/nuwa/**/*.logcollects all.logfiles under/apsara/nuwarecursively./var/logs/app_*/**/*.logcollects.logfiles in subdirectories matchingapp_*under/var/logs./var/log/nginx/**/access*collects files starting withaccessunder/var/log/nginxrecursively.Maximum directory monitoring depth Maximum subdirectory depth for the **wildcard.0monitors only the specified directory. Keep low — larger values increase resource consumption and may cause latency.Enable container metadata preview Shows matched container metadata after configuration creation. Container filtering Filter containers for log collection. Logtail earlier than 1.0.34: environment variables and container labels only. Logtail 1.0.34+: Kubernetes-level filtering (K8s Pod Name, Namespace, Container Name, Pod Label). Log tag enrichment Add log tags from environment variables and pod labels. File encoding Encoding format of the log files. First collection size Data size for initial collection. Default: 1,024 KB. Range: 0–10,485,760 KB. Files smaller than 1,024 KB are read from the start; larger files are read from the last 1,024 KB. Collection blacklist Exclude directories or files by exact path or wildcards ( *and?). Maximum 10 entries. Paths cannot end with/. Types: File Path, File, and Directory.Allow file to be collected multiple times By default, one Logtail configuration per file. Enable to allow multiple configurations per file. Advanced parameters Optional. See Create a Logtail pipeline configuration. Processor configurations
Parameter Description Log sample Sample logs for processing configuration. Maximum: 1,500 characters. Multi-line mode Multi-line log detection. Custom: use Regex to Match First Line for log boundaries. Multi-line JSON: each JSON object spans multiple lines. Processing Method If Splitting Fails: Discard (drop unmatched logs) or Retain Single Line (one line per entry). Processing method Add processors for data processing. Logtail V2.0: freely combine native and extended processors (extended must follow native). Earlier versions: no mixing. -
-
Create indexes and preview data, then click Next. Full-text indexing is enabled by default. To create field indexes automatically, click Automatic Index Generation. See Create indexes.
ImportantUse full-text indexes to query all fields. Use field indexes to query specific fields and reduce index traffic. Field indexes are required for log analysis (queries must include a SELECT statement).
-
Click Query Log. Wait about 1 minute for indexes to take effect, then view logs on the Raw Logs tab. See Guide to log query and analysis.
Environment variables
Configure log collection in your Knative Service YAML using environment variables. Names must use the aliyun_logs_ prefix. The {key} part allows only lowercase letters, digits, and hyphens (-).
Environment variable-based configuration is not supported in edge computing scenarios.
Enable SLS when creating a Knative Service
-
Log on to the ACK console. In the left-side navigation pane, click Clusters.
-
On the Clusters page, click the target cluster. In the left-side navigation pane, choose Applications > Knative.
-
Click the Services tab, select a namespace, and click Create from Template. Select Custom in the Sample Template section and use the following YAML:
apiVersion: serving.knative.dev/v1
kind: Service
metadata:
  name: helloworld-go-log
spec:
  template:
    spec:
      containers:
      - name: my-demo-app
        image: 'registry.cn-hangzhou.aliyuncs.com/log-service/docker-log-test:latest'
        env:
        # Collect stdout to Logstore "log-stdout".
        - name: aliyun_logs_log-stdout
          value: stdout
        # Collect /var/demo/*.log files to Logstore "log-varlog".
        - name: aliyun_logs_log-varlog
          value: /var/demo/*.log
        # Add a custom tag to all logs collected by this container.
        - name: aliyun_logs_mytag1_tags
          value: tag1=v1
        volumeMounts:
        - name: volumn-sls-mydemo
          mountPath: /var/demo
        # Optional: add a sleep command if the pod restarts repeatedly.
        command: ["sh", "-c"]
        args: ["sleep 3600"]
      volumes:
      - name: volumn-sls-mydemo
        emptyDir: {}
How the environment variables work:
-
aliyun_logs_{key}: The{key}becomes the Logstore name and the configuration name. Setvaluetostdoutto collect container stdout, or to a file path to collect log files.-
aliyun_logs_log-stdout: stdoutcreates Logstorelog-stdoutand collects stdout from the container. -
aliyun_logs_log-varlog: /var/demo/*.logcreates Logstorelog-varlogand collects matching files.
-
-
aliyun_logs_{key}_tags: Appends a tag to all logs from the container. Format:{tag-key}={tag-value}. The{key}is the tag name (without underscores). -
volumeMounts: Required when collecting non-stdout log files. ThemountPathmust match the directory in the log path variable.
-
Click Create to submit the configuration.
(Optional) Advanced environment variable settings
| Variable | Required | Description | Example | Notes |
|---|---|---|---|---|
aliyun_logs_{key} |
Yes | Specifies the log source. Set to stdout or a log file path. Creates Logstore {key} if aliyun_logs_{key}_logstore is not set. |
value: stdout or value: /var/log/nginx/access.log |
Logs are collected in simple mode by default. For parsing, use the SLS console or CRDs. |
aliyun_logs_{key}_tags |
No | Adds tags to logs. Format: {tag-key}={tag-value}. |
value: app=catalina |
— |
aliyun_logs_{key}_project |
No | Specifies the SLS project. Defaults to the project created during Logtail installation. | value: my-k8s-project |
The project must be in the same region as Logtail. |
aliyun_logs_{key}_logstore |
No | Specifies the Logstore name. Defaults to {key}. |
value: my-logstore |
— |
aliyun_logs_{key}_shard |
No | Number of shards for the Logstore. Valid values: 1–10. Default: 2. | value: '4' |
Has no effect if the Logstore already exists. |
aliyun_logs_{key}_ttl |
No | Log retention period in days. Valid values: 1–3650. Set to 3650 for permanent storage. Default: 90 days. | value: '3650' |
Has no effect if the Logstore already exists. |
aliyun_logs_{key}_machinegroup |
No | Machine group where the application is deployed. Defaults to the Logtail machine group. | value: my-machine-group |
See Collect container logs from an ACK cluster. |
aliyun_logs_{key}_logstoremode |
No | Logstore type. Default: standard. standard: real-time monitoring and SQL analysis. query: high-performance queries at ~50% index cost, no SQL analysis. Use query for large data volumes or long retention. |
value: standard or value: query |
Requires logtail-ds image v1.3.1 or later. Has no effect if the Logstore already exists. |
Step 3: Query and analyze logs
-
Log on to the Simple Log Service console.
-
In the Projects section, click the project to open its details page.

-
In the left-side navigation pane, click the
 icon next to the Logstore. In the drop-down list, select Search & Analysis.
Wait about 1 minute for indexes to take effect, then view logs on the Raw Logs tab. See Guide to log query and analysis.
Default fields in container text logs
Each container text log includes the following fields by default:
| Field | Description |
|---|---|
__tag__:__hostname__ |
Name of the container host |
__tag__:__path__ |
Log file path in the container |
__tag__:_container_ip_ |
IP address of the container |
__tag__:_image_name_ |
Name of the image used by the container |
__tag__:_pod_name_ |
Name of the pod |
__tag__:_namespace_ |
Namespace of the pod |
__tag__:_pod_uid_ |
UID of the pod |
Next steps
-
Troubleshoot log collection errors: How do I view Logtail collection errors? and What do I do if errors occur when I collect logs from containers?
-
Deploy Logtail DaemonSet to collect container logs from ACK clusters.