Real User Monitoring (RUM) uses user sessions to track errors, slow performance, and exceptions that occur when users interact with your application. By integrating with Application Monitoring, RUM provides end-to-end analysis to help you obtain a complete view of an issue. This topic describes how to associate end-to-end traces for mobile app monitoring.
Prerequisites
Your mobile app (Android or iOS) is integrated with the latest RUM software development kit (SDK). For more information, see Android application monitoring.
NoteUse Android and iOS SDKs V0.2.0 or later.
Your backend application is integrated with Application Monitoring or Managed Service for OpenTelemetry. For more information, see Integrate services or components.
Your backend application provides an HTTP-based web service to parse headers and associate the trace context.
Supported trace protocol types
SkyWalking: V3 (SkyWalking 8.*)
OpenTelemetry (W3C)
Integration procedure
Add your service domain name and enable trace pass-through
Log on to the ARMS console.
In the navigation pane on the left, choose . In the top navigation bar, select the destination region.
Click the name of your application and click Application Settings.
Click the Request Management tab, and configure your service domain name.
ImportantDo not add third-party service domain names. Otherwise, trace association may fail.
Add your service domain name, enable the Link tracing switch, and select the pass-through protocol for the backend service.
NoteThe backend application must first be integrated with ARMS Managed Service for OpenTelemetry. For more information, see Integrate services or components.
Pass-through format
Value
sw8: {sample}-{trace-id}-{segment-id}-{0}-{service}-{instance}-{endpoint}-{peer}
traceparent : {version}-{trace-id}-{parent-id}-{trace-flags}
tracestate: rum={version}&{appType}&{pid}&{sessionId}
Click OK. The system automatically pushes the tracing configuration to the mobile client.
ImportantThe configuration may take several minutes to take effect on the client. The delay depends on user behavior. By default, the SDK pulls the configuration once when the app performs a cold start. The SDK also pulls the configuration again if the app is reopened after being in the backend for more than 30 seconds.
Note that mobile clients do not have the Cross-Origin Resource Sharing (CORS) policy restrictions of web clients. However, the request headers for each pass-through protocol must be supported by the server-side gateway. If the gateway does not pass through the headers, the backend service cannot receive them, and RUM cannot be associated with traces.
Verify the configuration
This section uses the SkyWalking v3 pass-through protocol as an example to show how to verify the configuration.
Android
Use the App Inspection tool in Android Studio to check whether the request headers of network requests contain sw8 protocol information. The presence of this information confirms a successful integration.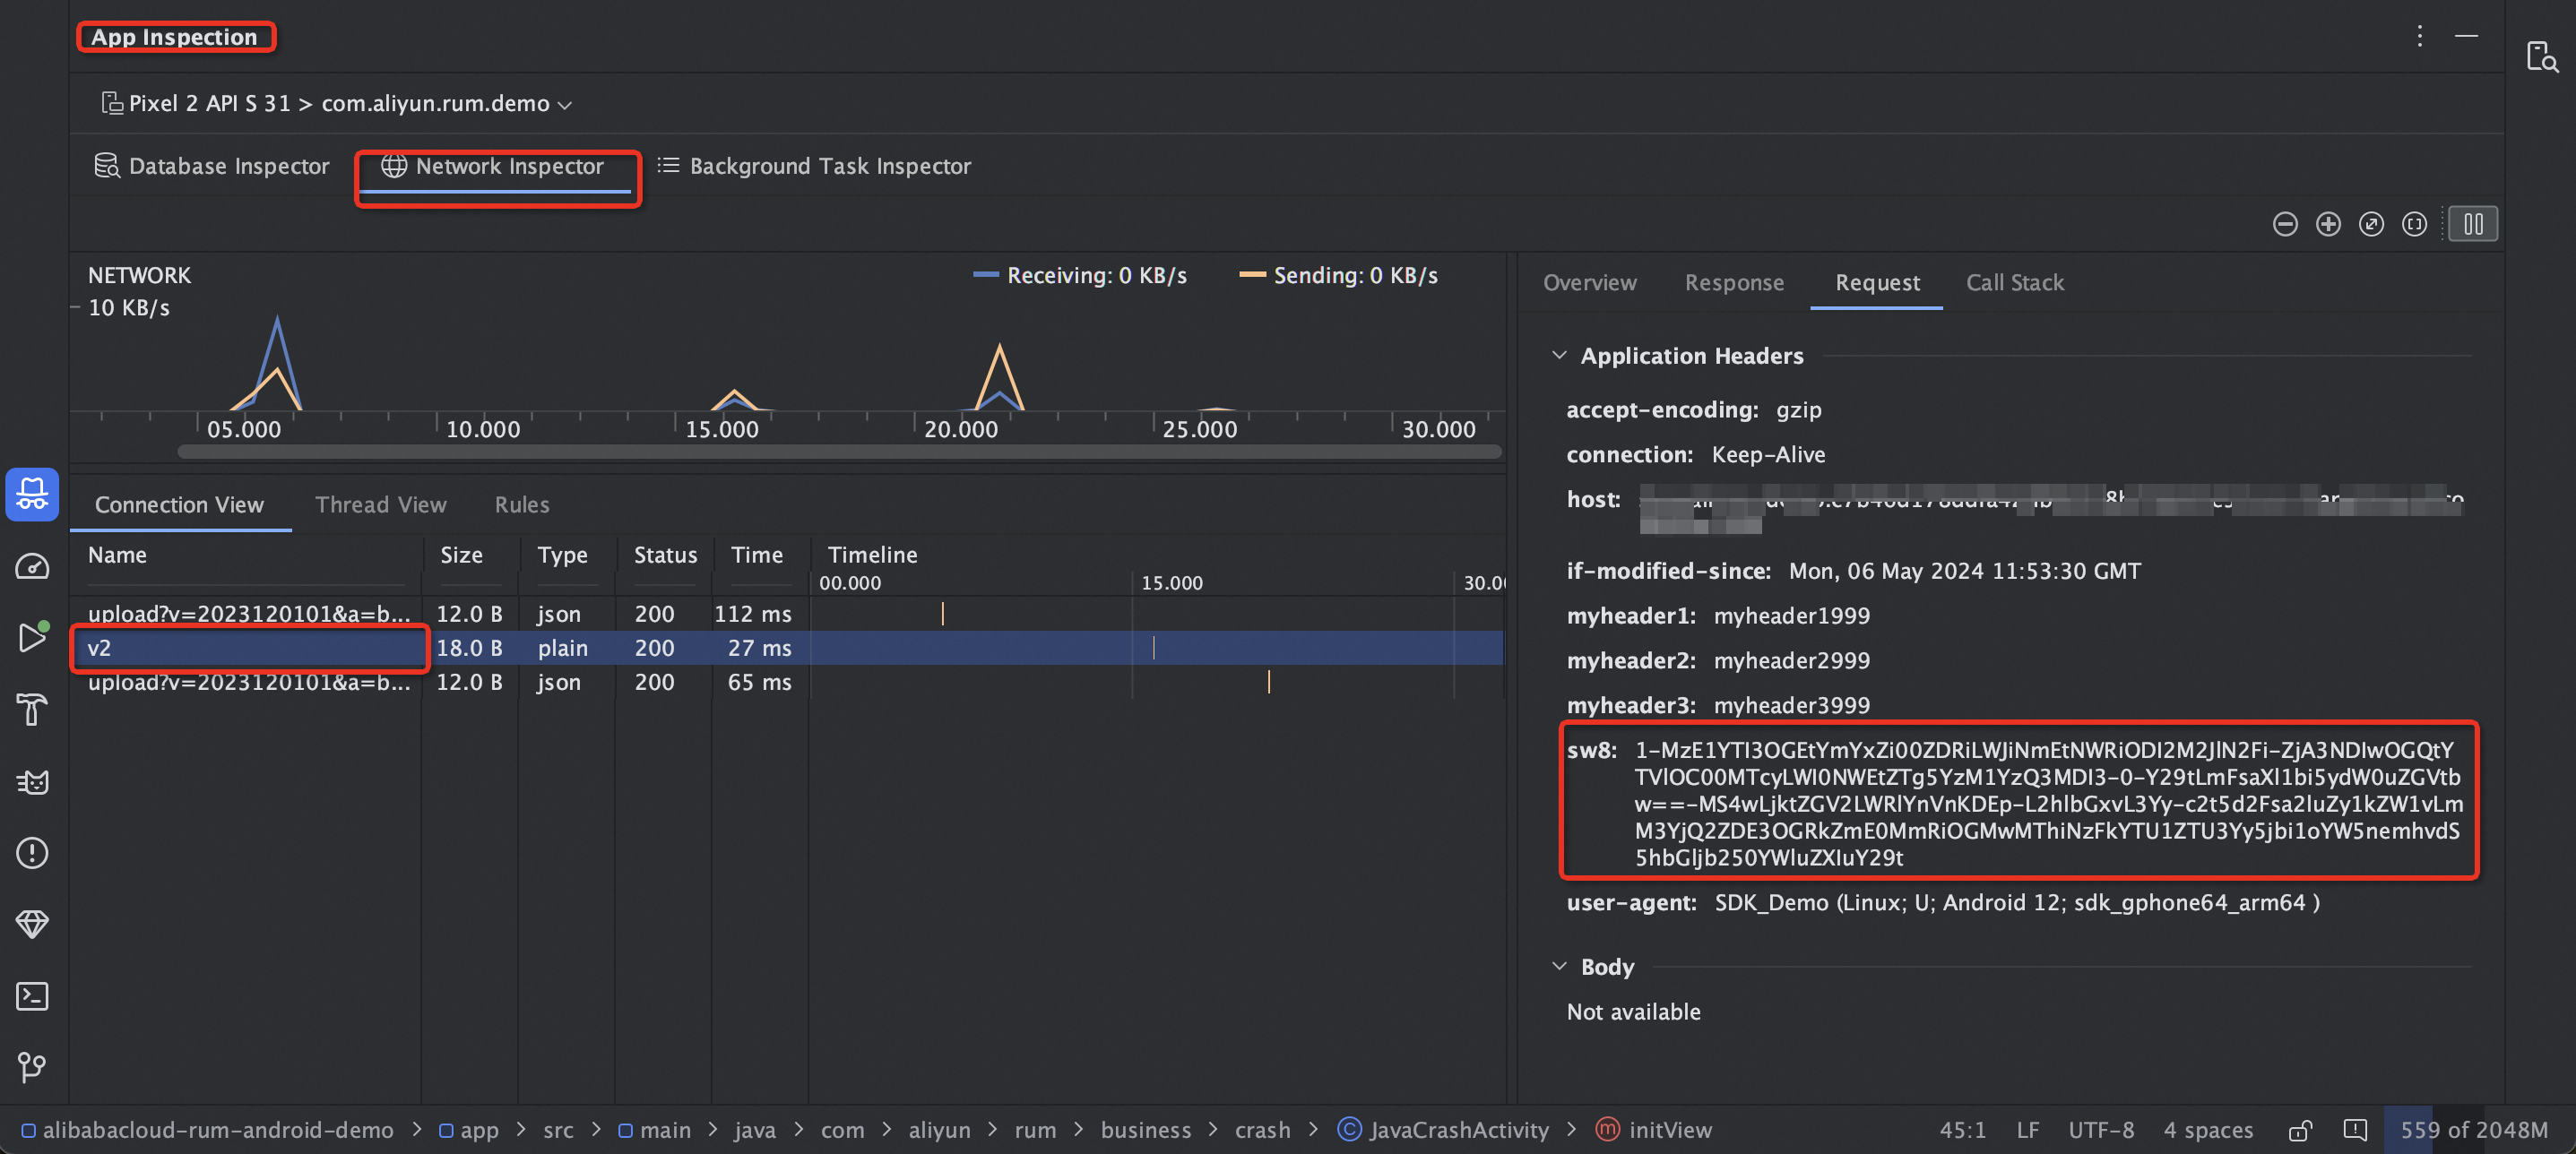
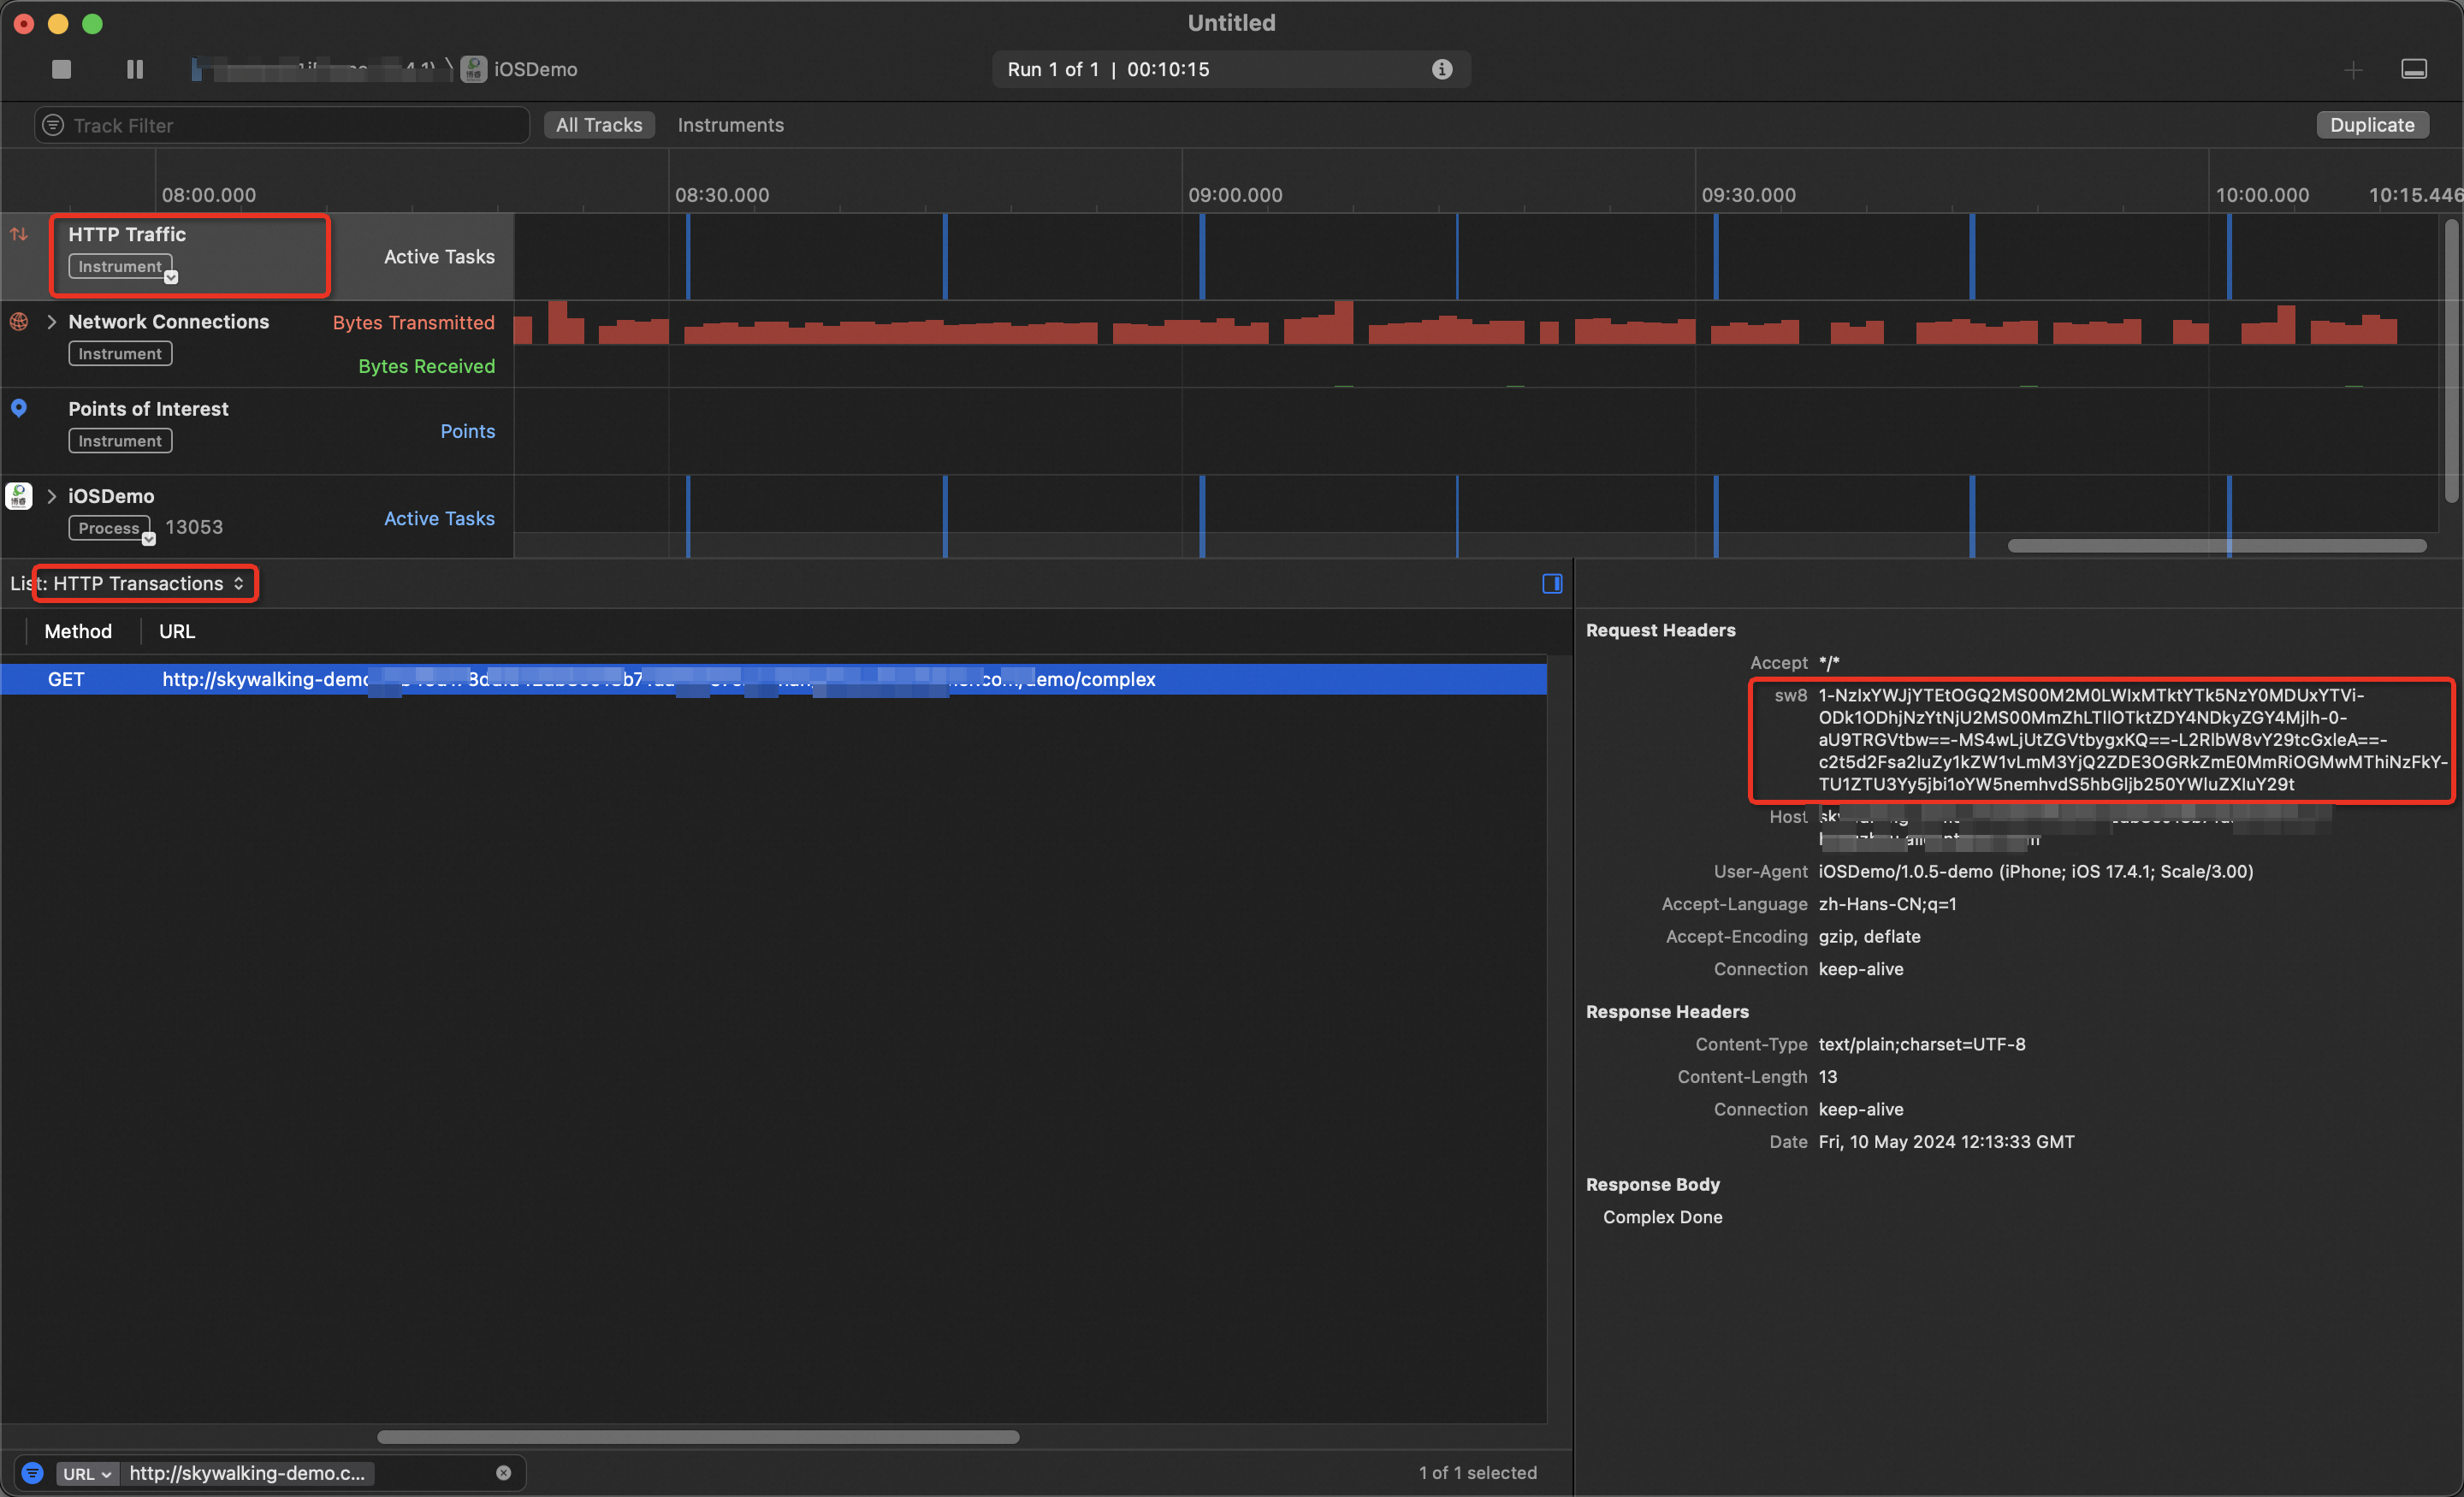
iOS
Use the Xcode Profile tool. In the Xcode toolbar, choose . Check whether the request headers of network requests contain sw8 protocol information. The presence of this information confirms a successful integration.
Configure backend application tracing
To create a complete trace, you must also configure the backend application. The supported backend application types and connection types are as follows:
Java applications
Integrate using the ARMS Application Monitoring agent
The ARMS Application Monitoring agent has built-in support for the OpenTelemetry protocol. No additional configuration is required to associate with RUM traces. However, you must ensure the following:
Supported ARMS Application Monitoring agent versions: 2.x, 3.x, and 4.x. For an optimal experience, we recommend that you upgrade to V4.x.
Supported web containers and frameworks: Support is provided for mainstream web containers, such as Tomcat, Jetty, WebLogic, and Undertow, and frameworks, such as Spring Boot and Spring MVC. For a complete list of supported components and frameworks, see Java components and frameworks supported by ARMS.
For more information about how to integrate the ARMS Application Monitoring agent, see Monitor Java applications.
Integrate using OpenTelemetry
You can integrate with ARMS (Managed Service for OpenTelemetry) using OpenTelemetry in two ways: automatic instrumentation and manual instrumentation.
In automatic instrumentation scenarios, OpenTelemetry supports most mainstream frameworks. No additional configuration is required to associate with RUM traces.
NoteFor more information about the Java frameworks supported by OpenTelemetry, see Use OpenTelemetry to report the trace data of Java applications.
In manual instrumentation scenarios, you must use the extension mechanism provided by the OpenTelemetry SDK to link with RUM traces. This involves parsing the trace context from the frontend request headers (traceparent and tracestate). The following code shows an example for a Spring Boot scenario:
Add the OpenTelemetry dependencies.
<dependency>
  <groupId>io.opentelemetry</groupId>
  <artifactId>opentelemetry-api</artifactId>
</dependency>
<dependency>
  <groupId>io.opentelemetry</groupId>
  <artifactId>opentelemetry-sdk-trace</artifactId>
</dependency>
<dependency>
  <groupId>io.opentelemetry</groupId>
  <artifactId>opentelemetry-extension-annotations</artifactId>
  <version>1.18.0</version>
</dependency>
<dependency>
  <groupId>io.opentelemetry</groupId>
  <artifactId>opentelemetry-exporter-otlp</artifactId>
</dependency>
<dependency>
  <groupId>io.opentelemetry</groupId>
  <artifactId>opentelemetry-sdk</artifactId>
</dependency>
<dependency>
  <groupId>io.opentelemetry</groupId>
  <artifactId>opentelemetry-semconv</artifactId>
  <version>1.30.1-alpha</version>
</dependency>
<dependency>
  <groupId>io.opentelemetry</groupId>
  <artifactId>opentelemetry-sdk-extension-autoconfigure</artifactId>
  <version>1.34.1</version>
</dependency>
<dependency>
  <groupId>io.opentelemetry</groupId>
  <artifactId>opentelemetry-extension-incubator</artifactId>
  <version>1.35.0-alpha</version>
</dependency>
Add the W3C Propagator during OpenTelemetry initialization.
Resource resource = Resource.getDefault()
        .merge(Resource.create(Attributes.of(
                ResourceAttributes.SERVICE_NAME, "otel-demo",
                ResourceAttributes.HOST_NAME, "xxxx"
)));

SdkTracerProvider sdkTracerProvider = SdkTracerProvider.builder()
        .addSpanProcessor(BatchSpanProcessor.builder(OtlpHttpSpanExporter.builder()
                .setEndpoint("Your Endpoint")
                .addHeader("Authentication", "Your Token")
                .build()).build())
        .setResource(resource)
        .build();

openTelemetry = OpenTelemetrySdk.builder()
        .setTracerProvider(sdkTracerProvider)
        // Add the W3C Propagator here.
        .setPropagators(ContextPropagators.create(
                TextMapPropagator.composite(W3CTraceContextPropagator.getInstance(), W3CBaggagePropagator.getInstance()))
         ).buildAndRegisterGlobal();
// Use the extended Tracer here.
tracer = ExtendedTracer.create(openTelemetry.getTracer("com.example.tracer", "1.0.0"));
In the business interface, add the headers parameter, parse the trace context from the request header, and set the parent.
// Add the request header parameter in the Controller to parse the trace context.
@RequestMapping("/test")
public String test(@RequestHeader Map<String, String> headers) {
    Span span = OpenTelemetrySupport.getTracer()
            .spanBuilder("/test")
            // Parse the parent span from the headers.
            .setParentFrom(OpenTelemetrySupport.getContextPropagators(), headers)
            .setSpanKind(SpanKind.SERVER)
            .startSpan();
    try (Scope scope = span.makeCurrent()) {
        // do something
    } catch (Throwable t) {
        span.setStatus(StatusCode.ERROR, "handle parent span error");
    } finally {
        span.end();
    }
    return "success";
}
Integrate using SkyWalking
For more information about the complete integration method, see Java Agent plugin.
SkyWalking provides only the Java Agent integration method. Follow the instructions in the document to link RUM with backend traces.
Protocol matching requirement for the RUM configuration: sw8 (v3) corresponds to the SkyWalking 8.x agent.
Go applications
Integrate using OpenTelemetry
For more information about the complete integration method, see Use OpenTelemetry to submit the trace data of a Go application.
Follow the instructions in the document to integrate. Then, generate a span from the request context in the HTTP request handler to associate with RUM traces.
// Initialize the tracer.
tracer := otel.Tracer(common.TraceInstrumentationName)
// Generate a span from the request context.
handler := http.HandlerFunc(func(w http.ResponseWriter, req *http.Request) {
    ctx := req.Context()
    span := trace.SpanFromContext(ctx)
    // do something
    w.Write([]byte("Hello World"))
})
Integrate using SkyWalking
For more information about the complete integration method, see Use SkyWalking to report the trace data of Go applications.
Follow the instructions in the document to integrate. We recommend using the skywalking-go integration method. This method supports mainstream web service frameworks, such as gin, go-restful, http, go-kratos v2, go-micro, and go-resty. You can associate with RUM traces without modifying your code.
If you want to manually parse the trace context from the HTTP request header, you can also use the following code:
//Extract context from the HTTP request header `sw8`.
span, ctx, err := tracer.CreateEntrySpan(r.Context(), "/api/test", func(key string) (string, error) {
		return r.Header.Get(key), nil
})
Python applications
Integrate using OpenTelemetry
For more information about the complete integration method, see Use OpenTelemetry to report the trace data of a Python application.
Follow the instructions in the document to integrate. Then, parse the Span context from the HTTP request header to associate with RUM traces. The following code shows an example:
// Initialize the tracer.
trace.set_tracer_provider(TracerProvider())
trace.get_tracer_provider().add_span_processor(BatchSpanProcessor(ConsoleSpanExporter()))

tracer = trace.get_tracer(__name__)

@app.route('/test')
def test():
    headers = dict(request.headers)

    // Parse the trace context from the headers.
    carrier ={'traceparent': headers['Traceparent'], 'tracestate': headers['Tracestate']}
    ctx = TraceContextTextMapPropagator().extract(carrier=carrier)

    with tracer.start_span("test", context=ctx):
        // do something
        return "success"
Integrate using SkyWalking
For more information about the complete integration method, see Use SkyWalking to report Python application data.
Follow the instructions in the document to integrate. Then, parse the span context from the HTTP request header to link with RUM traces. The following code shows an example:
from skywalking import config, agent
from skywalking.trace.context import SpanContext, get_context
from skywalking.trace.carrier import CarrierItem

# Configure SkyWalking. Adjust the parameters as needed.
config.init(agent_collector_backend_services='<endpoint>',
            agent_authentication='<auth-token>')

agent.start()

# Example HTTP request handler that requires passing the HTTP request headers.
def handle_request(headers):
    # Extract trace information from the request headers.
    carrier_items = []
    for item in SpanContext.make_carrier():
        carrier_header = headers.get(item.key.lower())
        if carrier_header:
            carrier_items.append(CarrierItem(item.key, carrier_header))

    carrier = SpanContext.make_carrier(carrier_items)

    # Extract the trace context from the Carrier.
    context = get_context().extract(carrier)

    # Create a new Span to process the request.
    with get_context().new_entry_span(op='operation_name') as span:
        # Process the request here. The span is automatically submitted when finished.
        ...

# Simulate a received HTTP request header that contains sw8.
incoming_headers = {
    'sw8': '1-My40LjU=-MTY1MTcwNDI5OTk5OA==-xxxx-xx-x-x==',  # Example value. Use the actual value from the request.
    # Other headers...
}

# Call the function to process the request.
handle_request(incoming_headers)
View end-to-end trace data
After you associate the frontend and backend traces, you can view the traces for frontend requests in the ARMS console.
Click API Request to view the complete trace and application topology for the request. You can then analyze slow or faulty requests by combining the request details from RUM with the backend trace data.
The top-level span is the RUM entry span. It varies based on the client-side connection type:
Web and H5 scenarios: The application name is rum-browser and the span name prefix is
"browser.request:".Miniapp scenarios: The application name is rum-miniapp and the span name prefix is
"miniapp.request: ".Android scenarios: The application name is rum-android and the span name prefix is
"android.request: ".iOS scenarios: The application name is rum-ios and the span name prefix is
"ios.request: ".
You can also use the topology graph to obtain a clear view of the upstream and downstream service topology for the entire request.